目录
下载 Prometheus
访问Prometheus
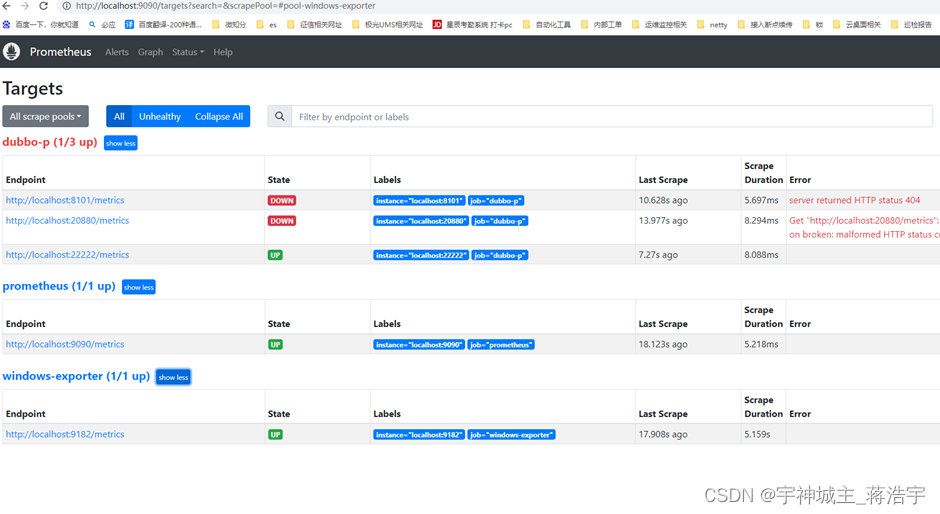
Targets 发现服务
dubbo%20%E6%8C%87%E6%A0%87%E5%B0%B1%E5%87%BA%E6%9D%A5%E4%BA%86-toc" style="margin-left:80px;"> 对应的 dubbo 指标就出来了
Dubbo脚手架生成个最简单的项目
导入 Prometheus 相关包
或者使用这个包即可
启动后就自动上报指标了
Windows_exporter or node_exporter
端口 9182
windows_exporter-toc" style="margin-left:80px;">Prometheus 配置 windows_exporter
Targets 自动就出来了
Windows 系统的 指标就出来了
配个指标都就出来了
下载 Prometheus
清华大学开源镜像站
清华大学开源软件镜像站 | Tsinghua Open Source Mirror


根目录下直接启动即可 无其他操作

访问Prometheus
http://localhost:9090/ 访问 Prometheus

Targets 发现服务

dubbo%20%E6%8C%87%E6%A0%87%E5%B0%B1%E5%87%BA%E6%9D%A5%E4%BA%86" style="margin-left:0;"> 对应的 dubbo 指标就出来了

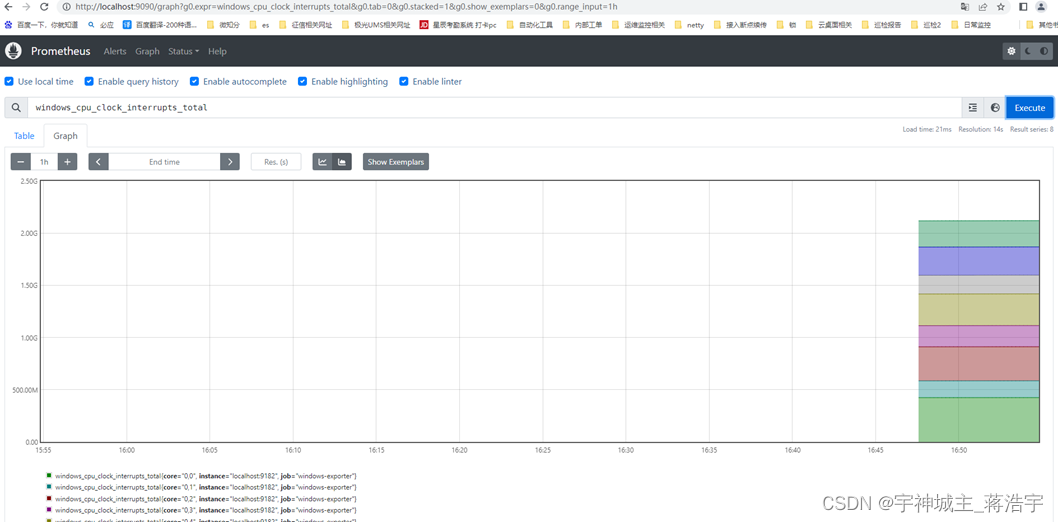
选择指标后选择graph 或 table 就可以看报告内容了
Dubbo脚手架生成个最简单的项目
Initializer Dubbo

导入 Prometheus 相关包
<dependency>
    <groupId>org.apache.dubbo</groupId>
    <artifactId>dubbo-metrics-prometheus</artifactId>
</dependency>
<dependency>
    <groupId>io.micrometer</groupId>
    <artifactId>micrometer-core</artifactId>
</dependency>
<dependency>
    <groupId>io.micrometer</groupId>
    <artifactId>micrometer-registry-prometheus</artifactId>
</dependency>
或者使用这个包即可
<dependency>
    <groupId>org.apache.dubbo</groupId>
    <artifactId>dubbo-spring-boot-observability-starter</artifactId>
    <version>3.2.0</version>
</dependency>
启动后就自动上报指标了
![]()
Windows_exporter or node_exporter
下载
GitHub - prometheus-community/windows_exporter: Prometheus exporter for Windows machines
Releases · prometheus-community/windows_exporter (github.com)
下载下来直接启动即可
端口 9182

windows_exporter" style="margin-left:0;">Prometheus 配置 windows_exporter
# my global config
global:
scrape_interval: 15s # Set the scrape interval to every 15 seconds. Default is every 1 minute.
evaluation_interval: 15s # Evaluate rules every 15 seconds. The default is every 1 minute.
# scrape_timeout is set to the global default (10s).
# Alertmanager configuration
alerting:
alertmanagers:
- static_configs:
- targets:
# - alertmanager:9093
# Load rules once and periodically evaluate them according to the global 'evaluation_interval'.
rule_files:
# - "first_rules.yml"
# - "second_rules.yml"
#- win_alert_rules.yml
# A scrape configuration containing exactly one endpoint to scrape:
# Here it's Prometheus itself.
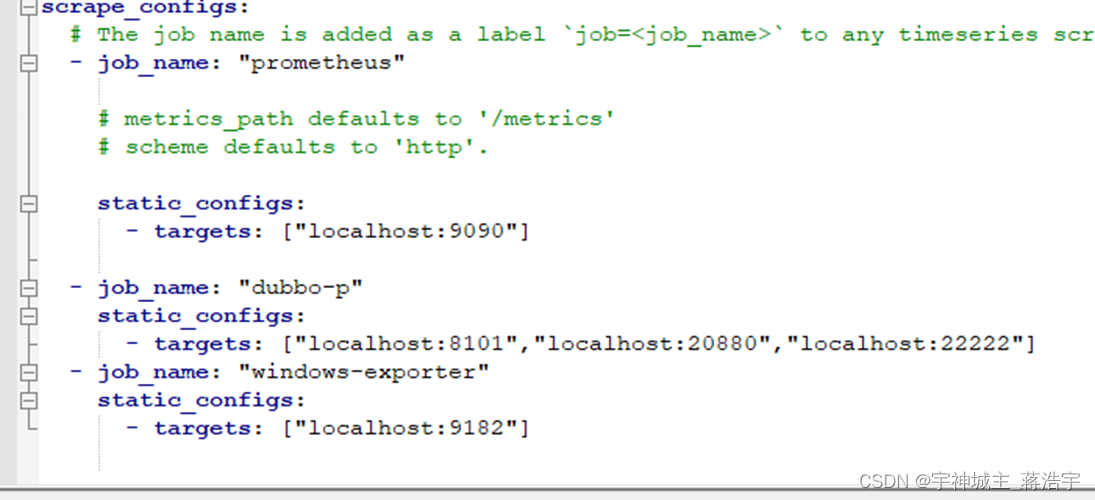
scrape_configs:
# The job name is added as a label `job=<job_name>` to any timeseries scraped from this config.
- job_name: "prometheus"
# metrics_path defaults to '/metrics'
# scheme defaults to 'http'.
static_configs:
- targets: ["localhost:9090"]
- job_name: "dubbo-p"
static_configs:
- targets: ["localhost:8101","localhost:20880","localhost:22222"]
- job_name: "windows-exporter"
static_configs:
- targets: ["localhost:9182"]
Targets 自动就出来了
Windows 系统的 指标就出来了

配个指标都就出来了
ok
持续更新