下载安装包
下载prometheus:https://github.com/prometheus/prometheus/releases/download/v2.42.0/prometheus-2.42.0.windows-amd64.zip
下载grafana:
https://dl.grafana.com/enterprise/release/grafana-enterprise-9.4.1.windows-amd64.zip
SpringBoot配置
我使用的是springboot3
导入依赖
<dependency>
    <groupId>org.springframework.boot</groupId>
    <artifactId>spring-boot-starter-actuator</artifactId>
</dependency>
<dependency>
    <groupId>io.micrometer</groupId>
    <artifactId>micrometer-registry-prometheus</artifactId>
</dependency>
添加配置
# 暴露 actuator 端点
# 如果配置了拦截器,需要在拦截器中排除 /actuator/**
management:
  endpoints:
    web:
      exposure:
        include: health,info,prometheus,metrics,metrics-requiredMetricName
        exclude:
    # 自定义端点的启用和关闭
    enabled-by-default: true
  endpoint:
    health:
      show-details: ALWAYS
  # 对外暴露tag
  metrics:
    tags:
      application: 修改为你的服务名
添加配置类
@Configuration(proxyBeanMethods = false)
public class MicrometerConfig {

  @Bean
  MeterRegistryCustomizer<MeterRegistry> registryCustom(@Value("${spring.application.name}") String applicationName) {
    return registry -> registry.config().commonTags("application", applicationName);
  }

}
启动springboot服务,访问actuator接口,例如: http://localhost:8001/cloud-web-01/actuator ,接口返回值如下图所示

Prometheus配置
1、解压prometheus-2.42.0.windows-amd64.zip,修改prometheus.yml

添加如下配置,注意:除了scrape_interval可以不改之外,其他的配置项都要修改为你的微服务
  # 被监控的服务是cloud-web-01
  - job_name: 'cloud-web-01'
    scrape_interval: 15s
    # actuator/prometheus的URI
    metrics_path: '/cloud-web-01/actuator/prometheus'
    static_configs:
      # cloud-web-01的ip和端口
      - targets: ['127.0.0.1:8001']
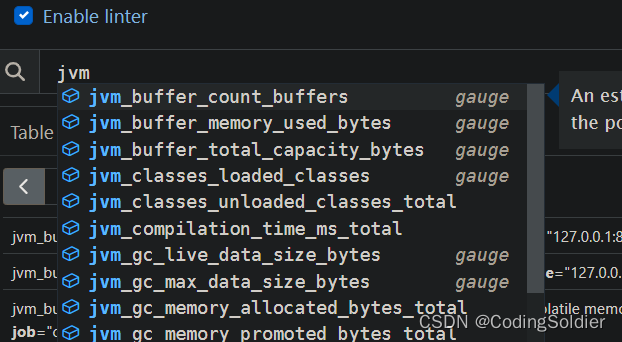
2、双击prometheus.exe启动,访问Prometheus:http://127.0.0.1:9090/
在搜索栏输入jvm,如下图所示,能查看到cloud-web-01的jvm信息
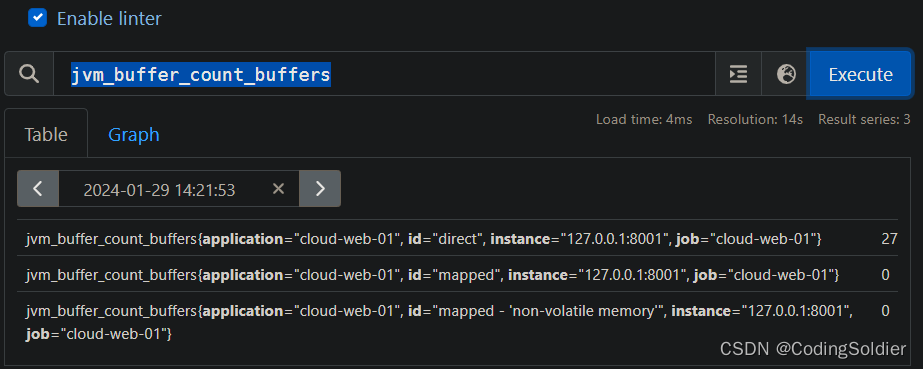
选择jvm_buffer_count_buffers,点击Execute,即可查看jvm_buffer_count_buffers信息
如果你的微服务打印了请求日志,会看到每隔15S,Prometheus就会请求 actuator/prometheus 接口获取微服务的监控数据

grafana配置
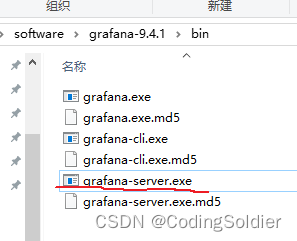
1、解压 grafana-enterprise-9.4.1.windows-amd64.zip,双击bin目录下的grafana-server.exe,启动grafana
2、访问grafana:http://localhost:3000/login 默认账号/密码是:admin/admin
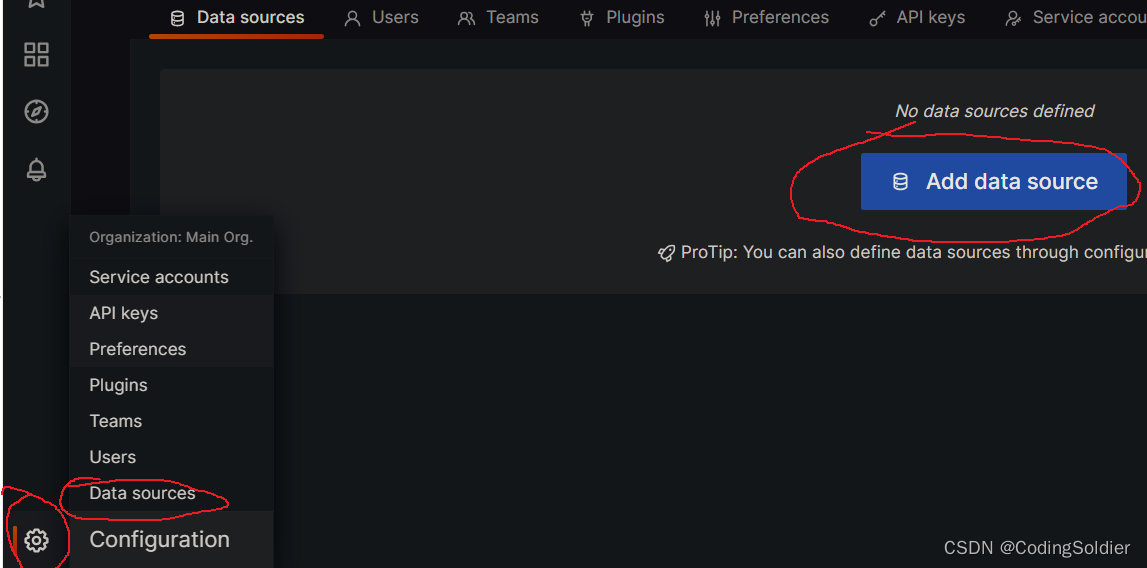
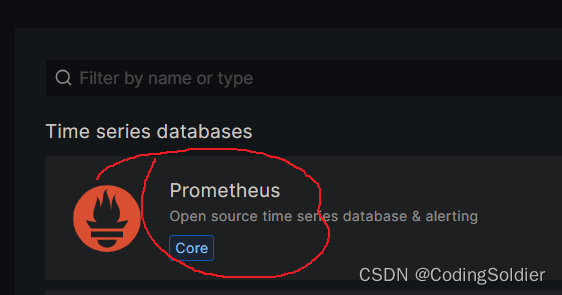
3、点击 配置按钮 -> Data sources -> Add data source
选择Prometheus数据源
HTTP URL 修改为 http://127.0.0.1:9090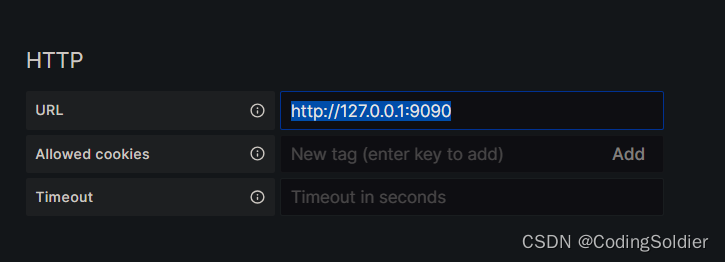
点击 Save & test

显示 Data source is working 表明添加成功

4、打开 https://grafana.com/grafana/dashboards/?plcmt=footer ,搜索 jvm

有很多JVM的监控模板供选择,我们选择 JVM (Micrometer)
点击 JVM (Micrometer) ,拷贝模板ID

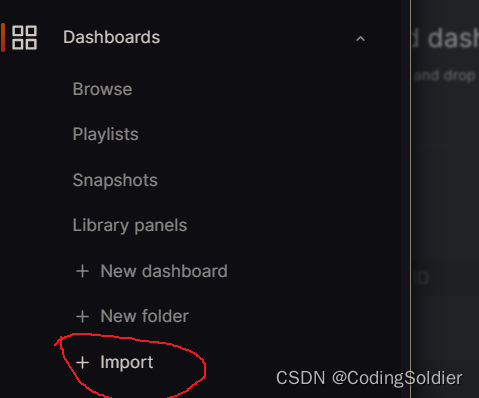
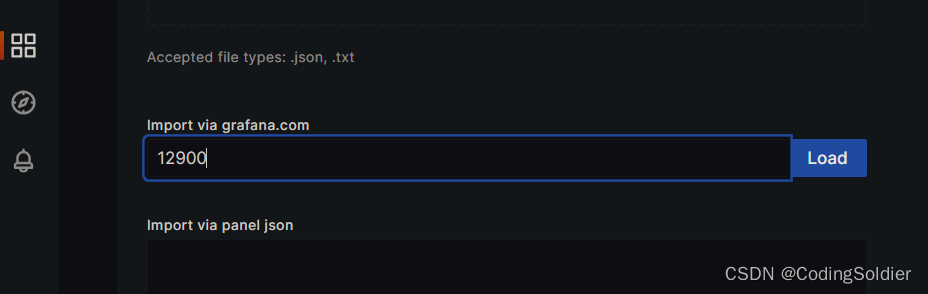
回到 http://localhost:3000/ 系统,点击 Dashboards -> Import 导入模板
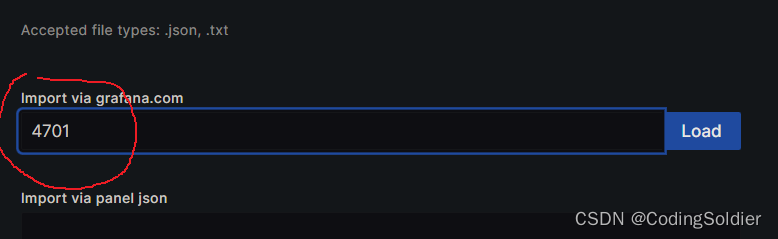
填写模板ID 4071,点击 Load
选择Prometheus数据源,点击Import

就可以监控cloud-web-01服务的JVM了
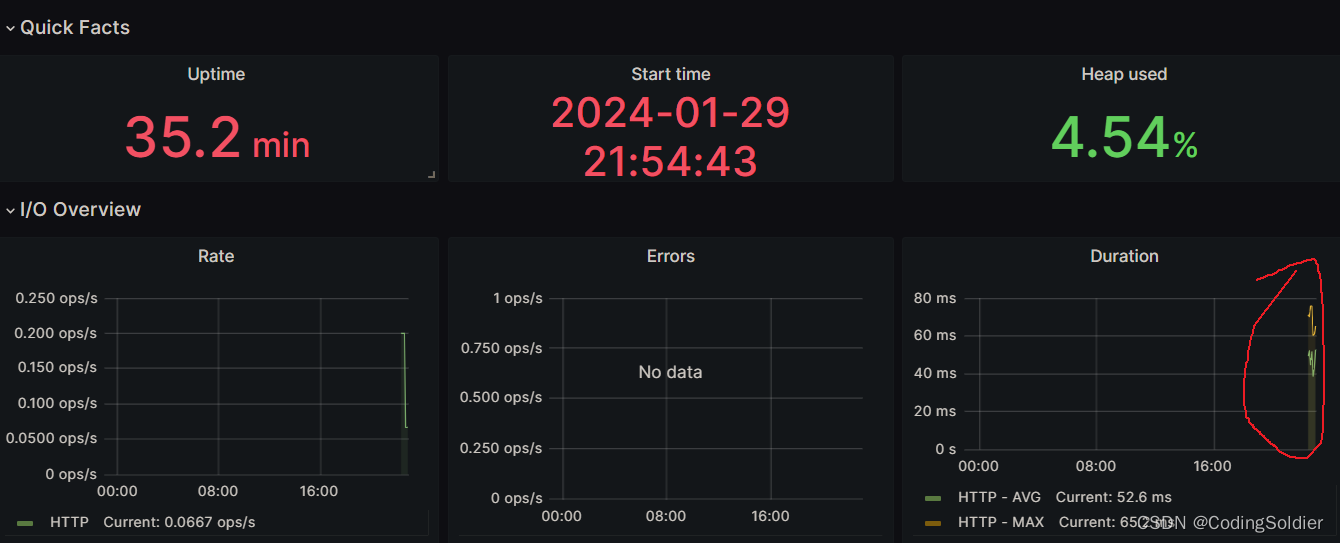
5、再加一个SpringBoot3的监控模板“SpringBoot APM Dashboard”。
其他的SpringBoot监控模板还未支持SpringBoot3。

模板ID是12900
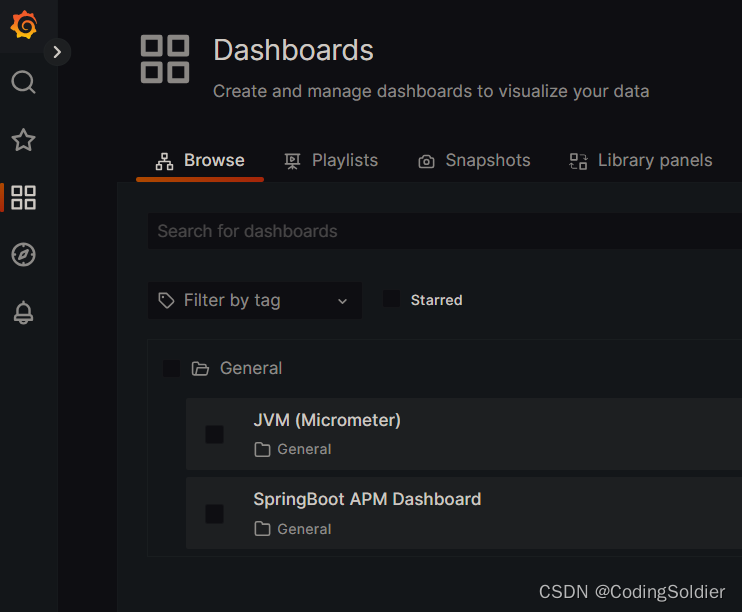
显示效果

可以在 Dashboards -> Browse 中找到前面新增的Dashboards