文章目录
- 1. 创建Kubernetes命名空间
- 2. 添加Prometheus社区helm chart
- 3. 安装prometheus
- 4. 检查Prometheus Pod运行状况
- 5. 检查Prometheus Service部署情况
- 6. 修改服务访问端口类型
- 7. 访问Prometheus数据收集情况
- 8. 访问Grafana
- 9. 设置数据源
- 10. 查看Kubernetes各类性能可视化参数信息
1. 创建Kubernetes命名空间
首先,创建一个 Kubernetes 命名空间,并使用 helm 来部署 stable/monitoring 软件包:
$ kubectl create namespace monitoring
操作过程演示:
[ec2-user@ip-172-31-37-104 ~]$ kubectl create namespace monitoring
namespace/monitoring  created

[ec2-user@ip-172-31-37-104 ~]$ kubectl get ns
NAME              STATUS   AGE
default           Active   153m
kube-node-lease   Active   153m
kube-public       Active   153m
kube-system       Active   153m
monitoring        Active   86m
2. 添加Prometheus社区helm chart
其次,添加 Prometheus 社区helm chart:
$ helm repo add prometheus-community https://prometheus-community.github.io/helm-charts

$ helm repo update

$ helm repo list

$ helm search repo stable/prometheus-operator
$ helm search repo prometheus-operator
操作过程演示:
[ec2-user@ip-172-31-37-104 ~]$ helm repo add prometheus-community https://prometheus-community.github.io/helm-charts
"prometheus-community" already exists with the same configuration, skipping

[ec2-user@ip-172-31-37-104 ~]$ helm repo update
Hang tight while we grab the latest from your chart repositories...
...Successfully got an update from the "grafana" chart repository
...Successfully got an update from the "prometheus-community" chart repository
...Successfully got an update from the "stable" chart repository
Update Complete. ⎈Happy Helming!⎈

[ec2-user@ip-172-31-37-104 ~]$ helm repo list
NAME                    URL
prometheus-community    https://prometheus-community.github.io/helm-charts
grafana                 https://grafana.github.io/helm-charts
stable                  https://charts.helm.sh/stable

[ec2-user@ip-172-31-37-104 ~]$ helm search repo prometheus-community/prometheus-operator
NAME                            CHART VERSION   APP VERSION     DESCRIPTION
stable/prometheus-operator      9.3.2           0.38.1          DEPRECATED Provides easy monitoring definitions...
prometheus_65">3. 安装prometheus
接着,使用helm install安装prometheus:
helm install stable prometheus-community/kube-prometheus-stack --debug
创建过程显示正常,最后会输出如下内容:
NOTES:
kube-prometheus-stack has been installed. Check its status by running:
  kubectl --namespace default get pods -l "release=stable"

Visit https://github.com/prometheus-operator/kube-prometheus for instructions on how to create & configure Alertmanager and Prometheus instances using the Operator.
4. 检查Prometheus Pod运行状况
最后,检查Prometheus Pods的部署情况。
[ec2-user@ip-172-31-37-104 ~]$ kubectl get pods -n monitoring
NAME                                                     READY   STATUS    RESTARTS   AGE
alertmanager-stable-kube-prometheus-sta-alertmanager-0   2/2     Running   0          131m
prometheus-stable-kube-prometheus-sta-prometheus-0       2/2     Running   0          131m
stable-grafana-58b76cd9d7-tgd8r                          3/3     Running   0          131m
stable-kube-prometheus-sta-operator-7699d6bfb8-zx8jn     1/1     Running   0          131m
stable-kube-state-metrics-65f45c47c9-5zmj5               1/1     Running   0          131m
stable-prometheus-node-exporter-2q98d                    1/1     Running   0          126m
stable-prometheus-node-exporter-98cf4                    1/1     Running   0          131m
stable-prometheus-node-exporter-d6jnm                    1/1     Running   0          128m
stable-prometheus-node-exporter-gp5dh                    1/1     Running   0          131m
stable-prometheus-node-exporter-gqqls                    1/1     Running   0          128m
stable-prometheus-node-exporter-sqg6x                    1/1     Running   0          126m
[ec2-user@ip-172-31-37-104 ~]$
5. 检查Prometheus Service部署情况
检查部署完成的服务 kubectl get svc
$ kubectl get svc -n monitoring
检查部署完成的Prometheus Pods可以看到每个节点都运行了
node-exporter且已经运行起 Prometheus和Grafana
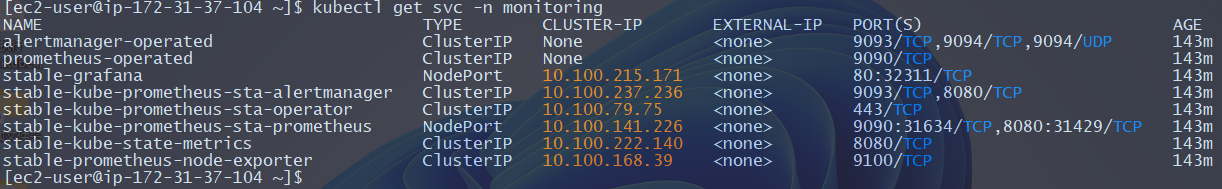
[ec2-user@ip-172-31-37-104 ~]$ kubectl get svc -n monitoring
NAME                                      TYPE        CLUSTER-IP       EXTERNAL-IP   PORT(S)                         AGE
alertmanager-operated                     ClusterIP   None             <none>        9093/TCP,9094/TCP,9094/UDP      79m
prometheus-operated                       ClusterIP   None             <none>        9090/TCP                        79m
stable-grafana                            NodePort    10.100.215.171   <none>        80:32311/TCP                    79m
stable-kube-prometheus-sta-alertmanager   ClusterIP   10.100.237.236   <none>        9093/TCP,8080/TCP               79m
stable-kube-prometheus-sta-operator       ClusterIP   10.100.79.75     <none>        443/TCP                         79m
stable-kube-prometheus-sta-prometheus     NodePort    10.100.141.226   <none>        9090:31634/TCP,8080:31429/TCP   79m
stable-kube-state-metrics                 ClusterIP   10.100.222.140   <none>        8080/TCP                        79m
stable-prometheus-node-exporter           ClusterIP   10.100.168.39    <none>        9100/TCP                        79m
6. 修改服务访问端口类型
🛑情况说明:默认情况下,
prometheus和grafana服务都是使用ClusterIP在集群内部,所以要能够在外部访问,需要使用NodePort
✅操作内容:修改
stable-kube-prometheus-sta-prometheus服务和stable-grafana服务配置文件中的内容,将type从ClusterIP修改为NodePort。
$ kubectl edit svc stable-grafana

$ kubectl edit svc stable-kube-prometheus-sta-prometheus

执行
kubectl get svc -n monitoring命令,查看对应服务访问的外置端口。
注意:
检查对应的主机安全组的端口是否开启。
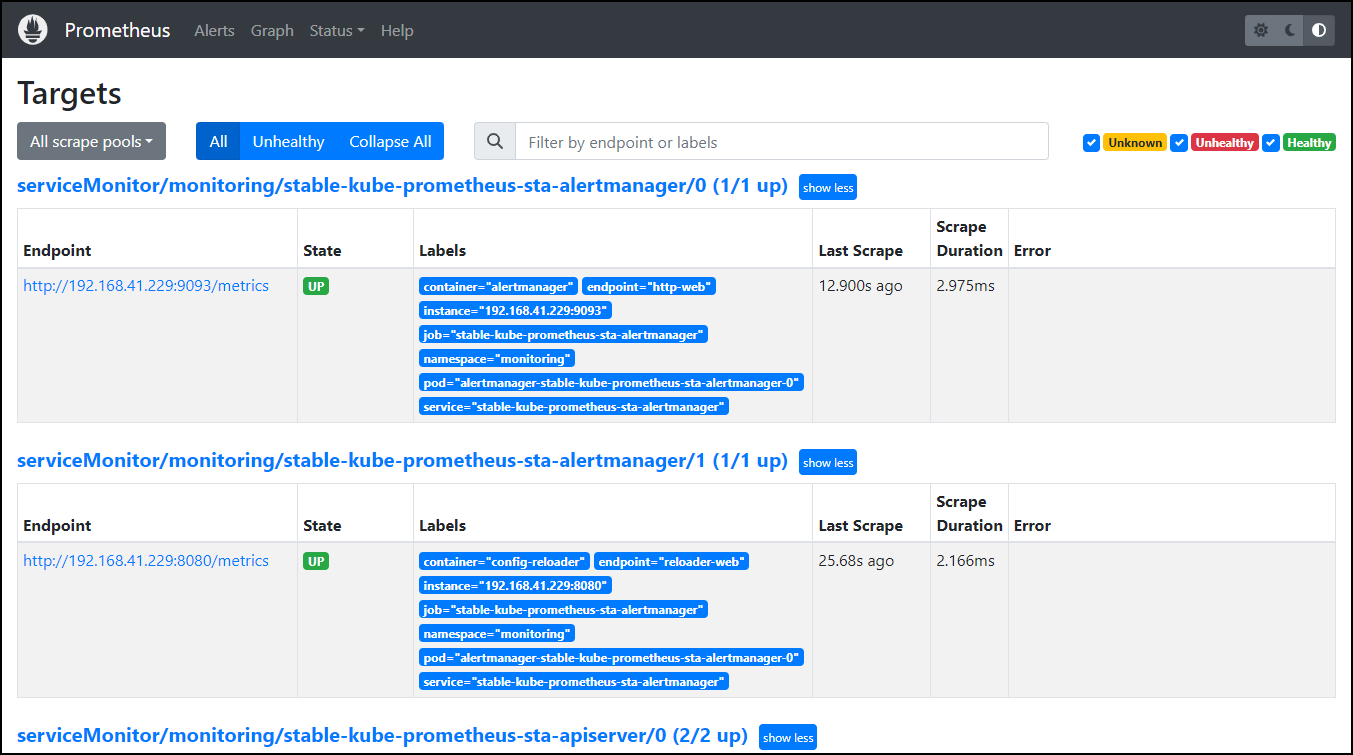
7. 访问Prometheus数据收集情况
访问Prometheus数据收集情况。其中一个集群工作节点的IP地址+prometheus端口。
8. 访问Grafana
访问Grafana。对Amazon EKS中的数据进行数据可观测性查看。其中一个集群工作节点的IP地址+grafana端口。
访问 Grafana 面板,初始账号
admin密码是prom-operator,请立即修改
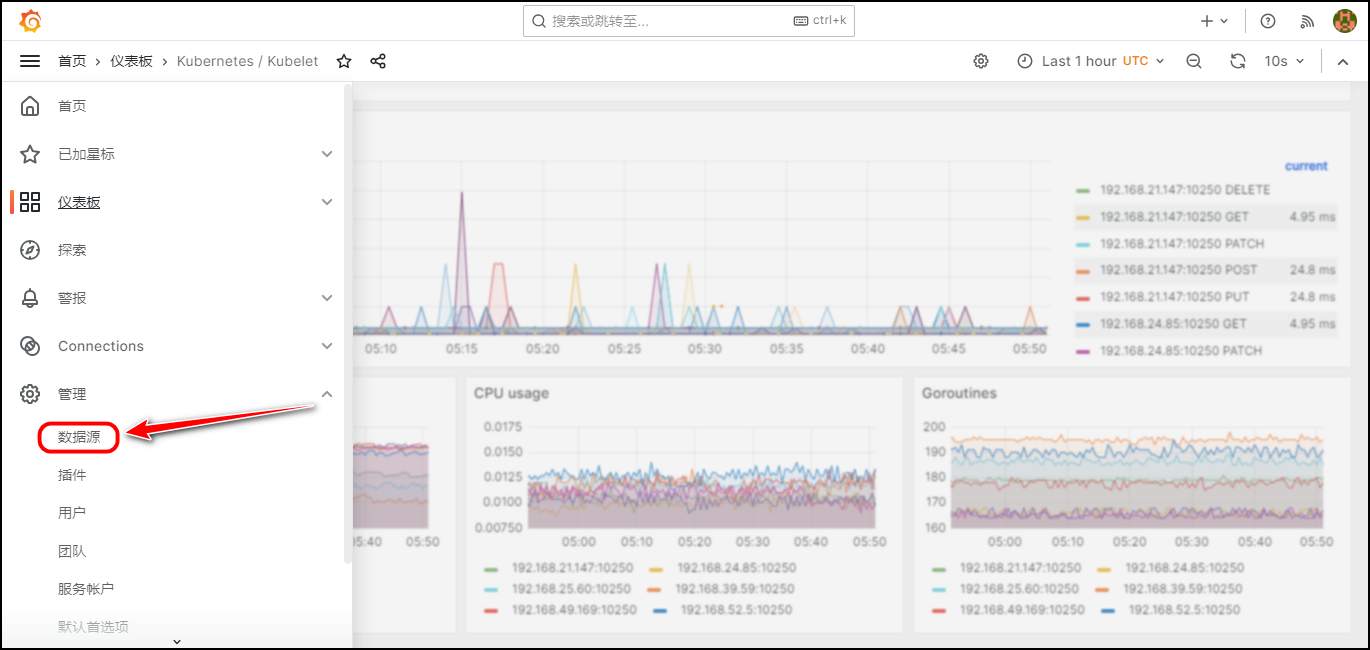
9. 设置数据源
1、设置名称。设置为默认数据源
2、Prometheus server URL:Prometheus的SVC对应的Cluster-IP
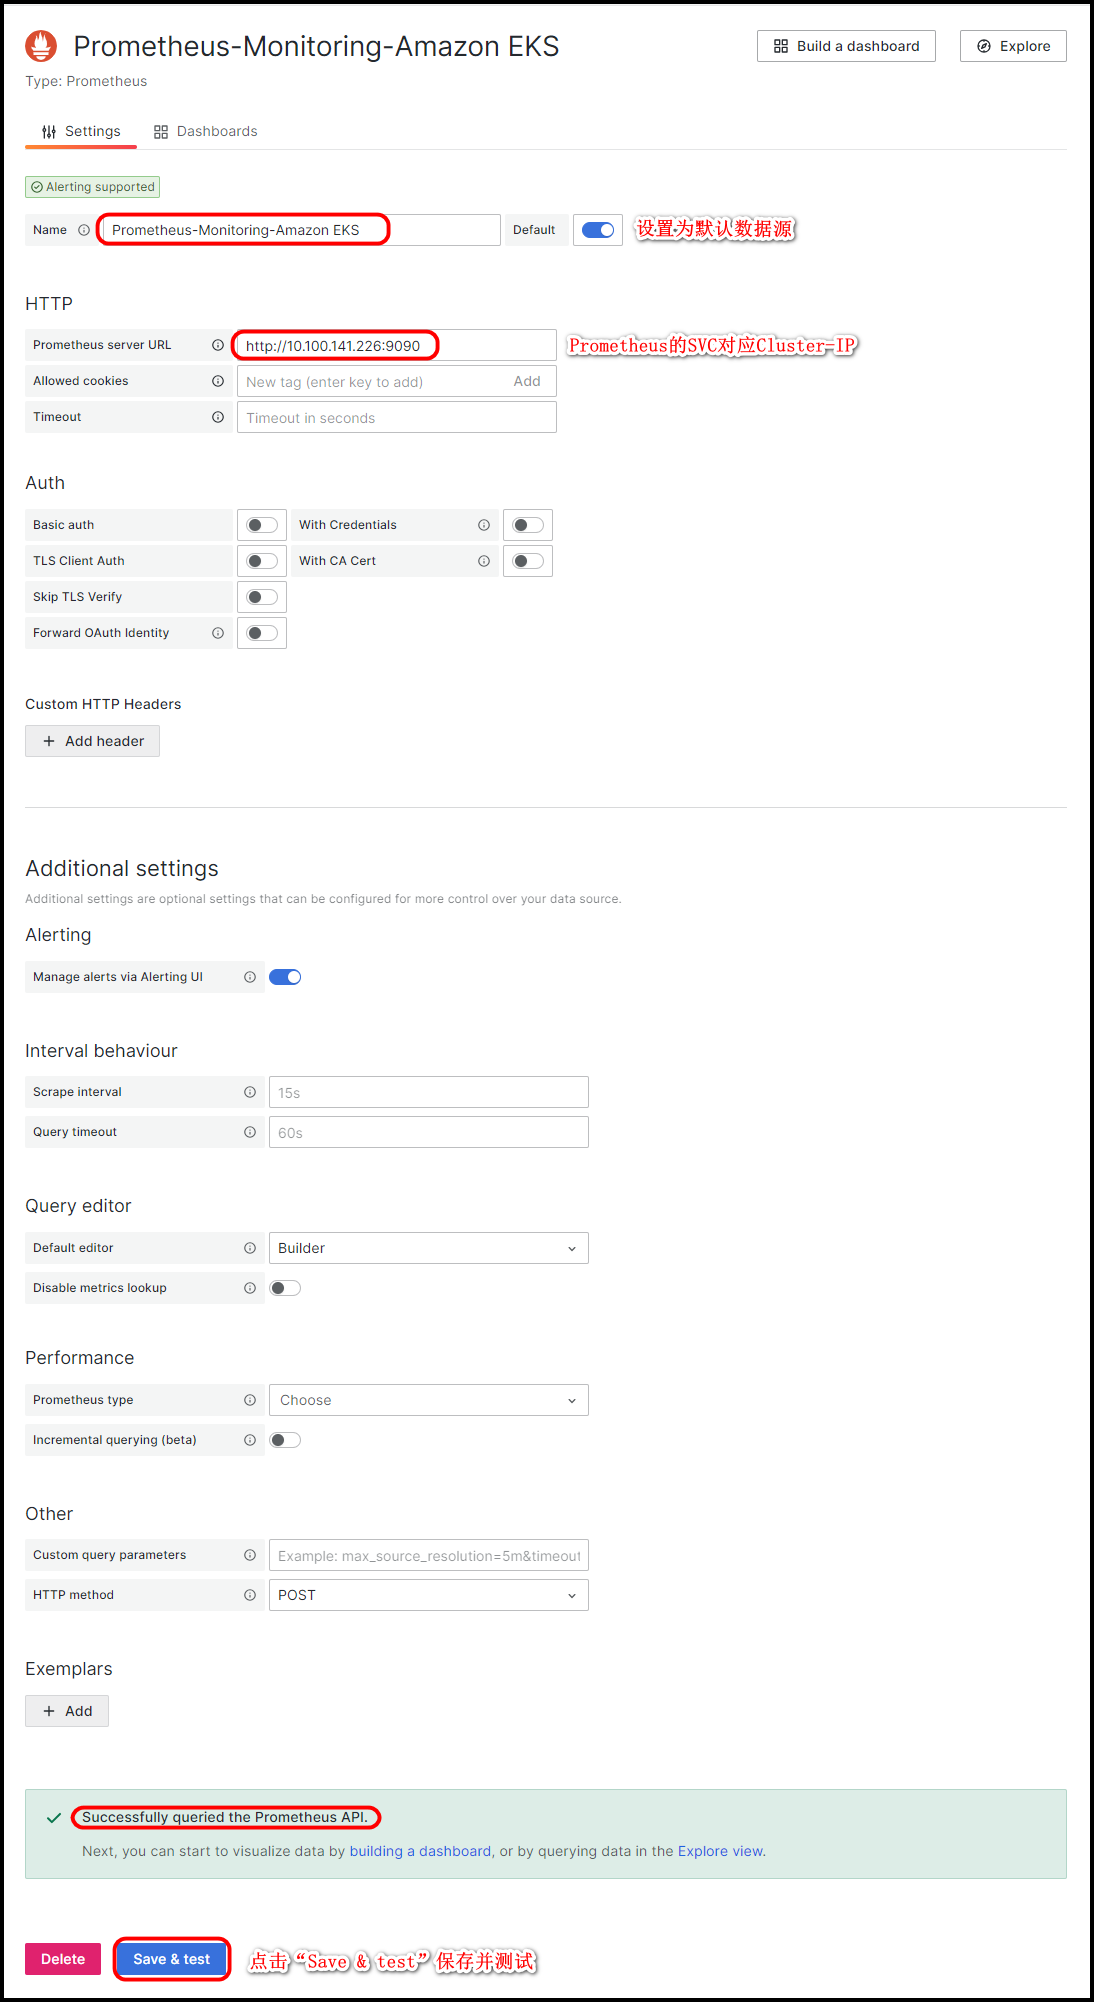
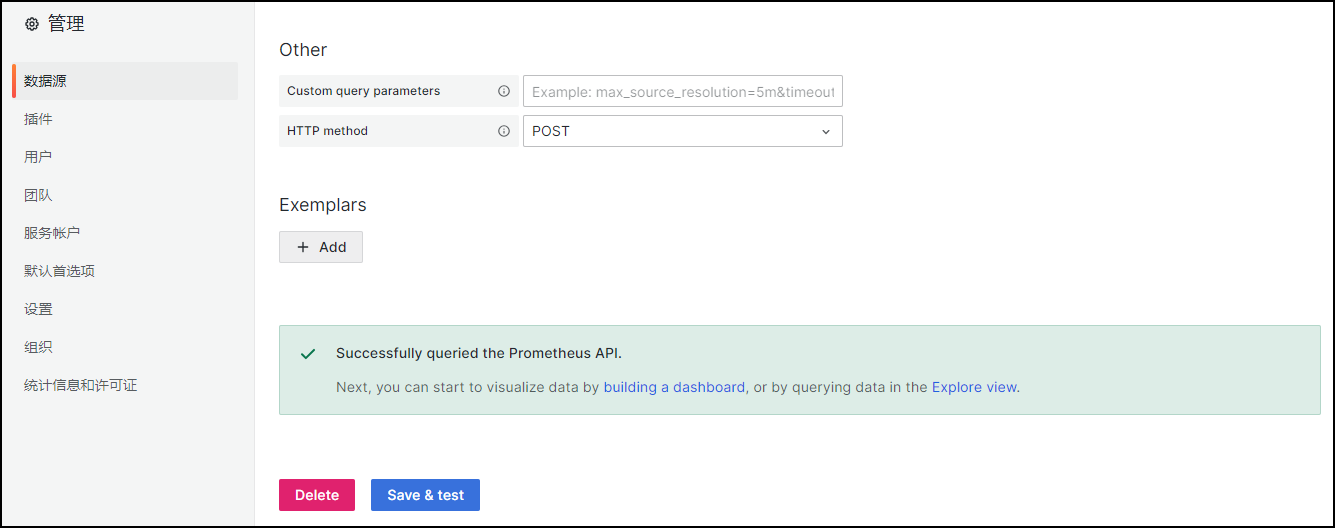
- 点击“Save & test”保存并测试。输出结果如下所示,表示成功。
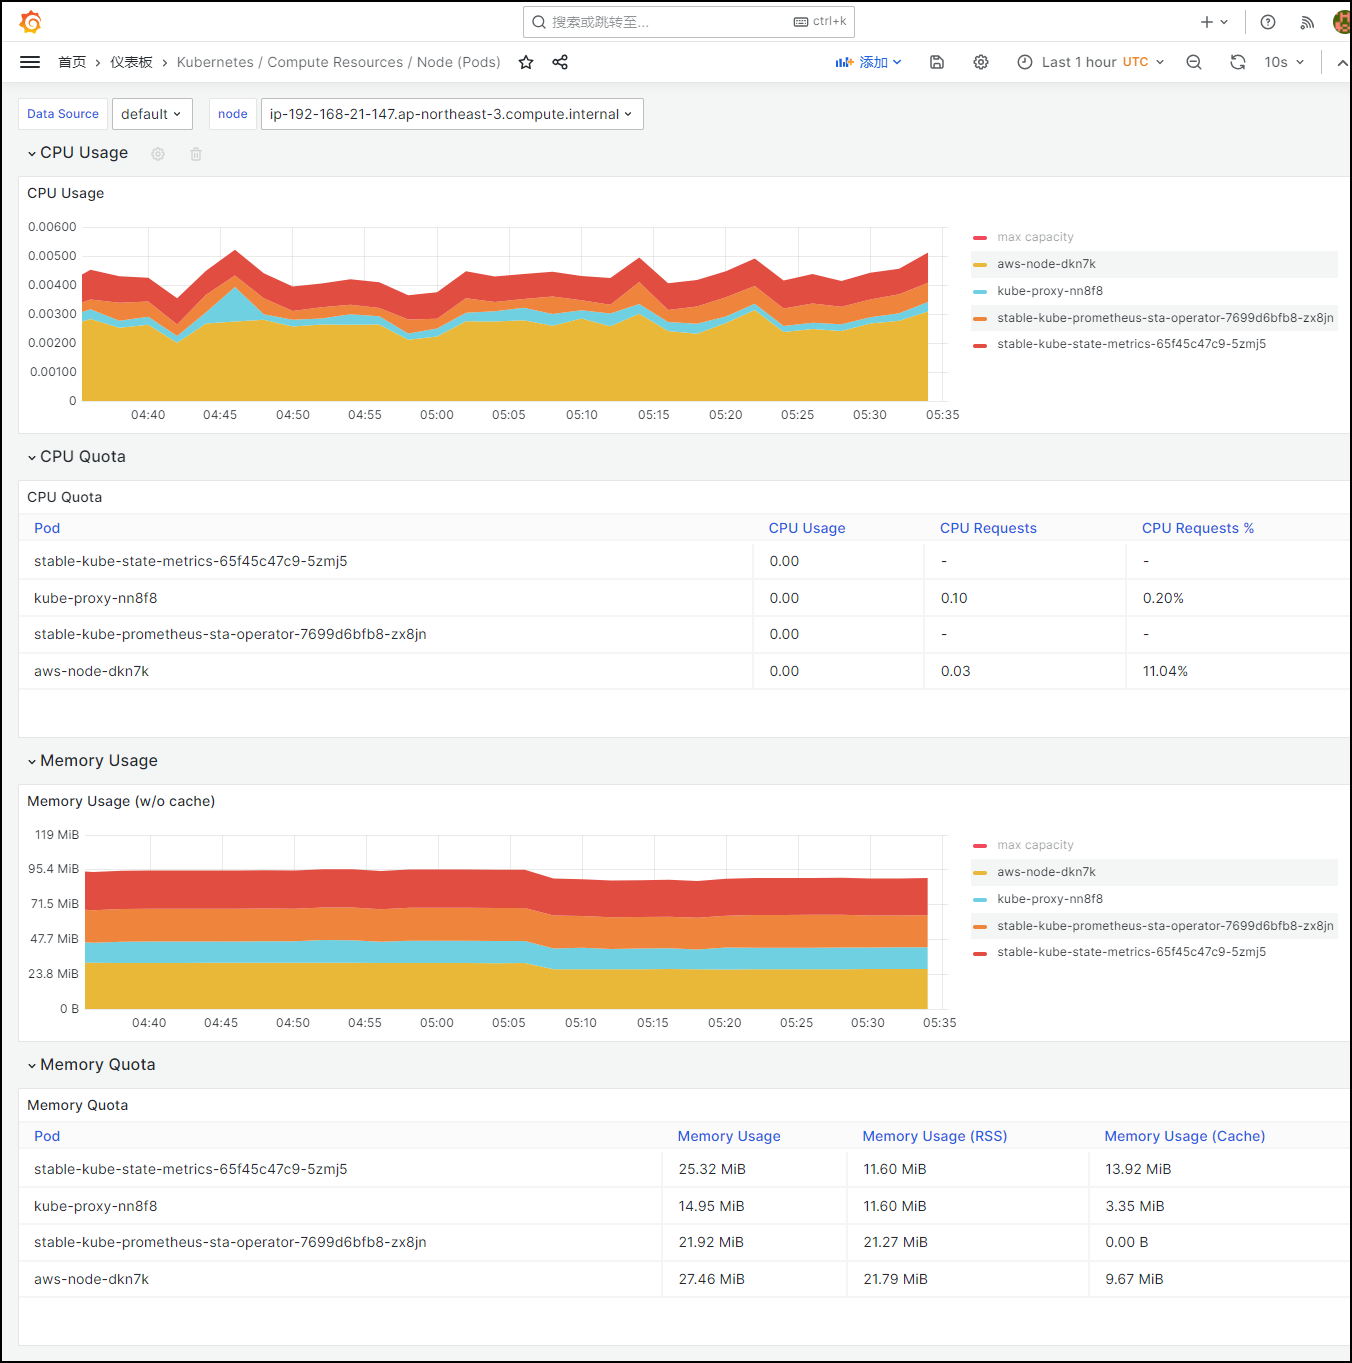
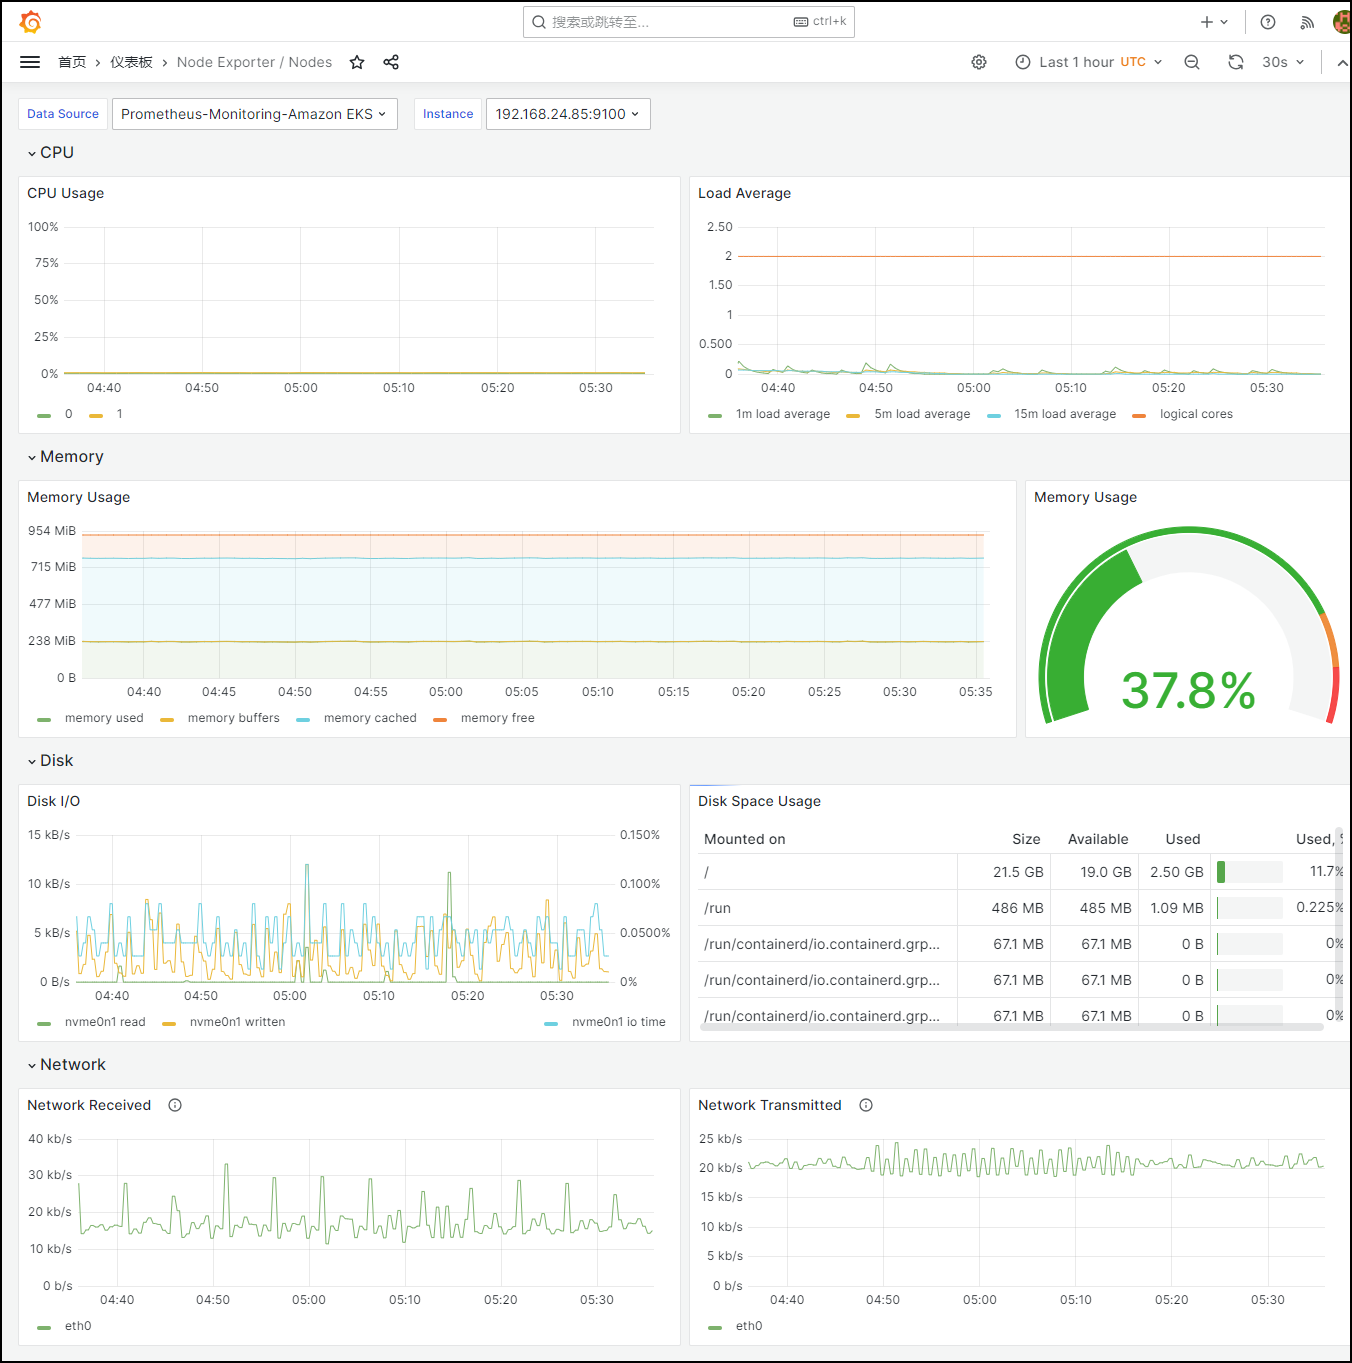
10. 查看Kubernetes各类性能可视化参数信息
- 查看Kubernetes网络工作负载
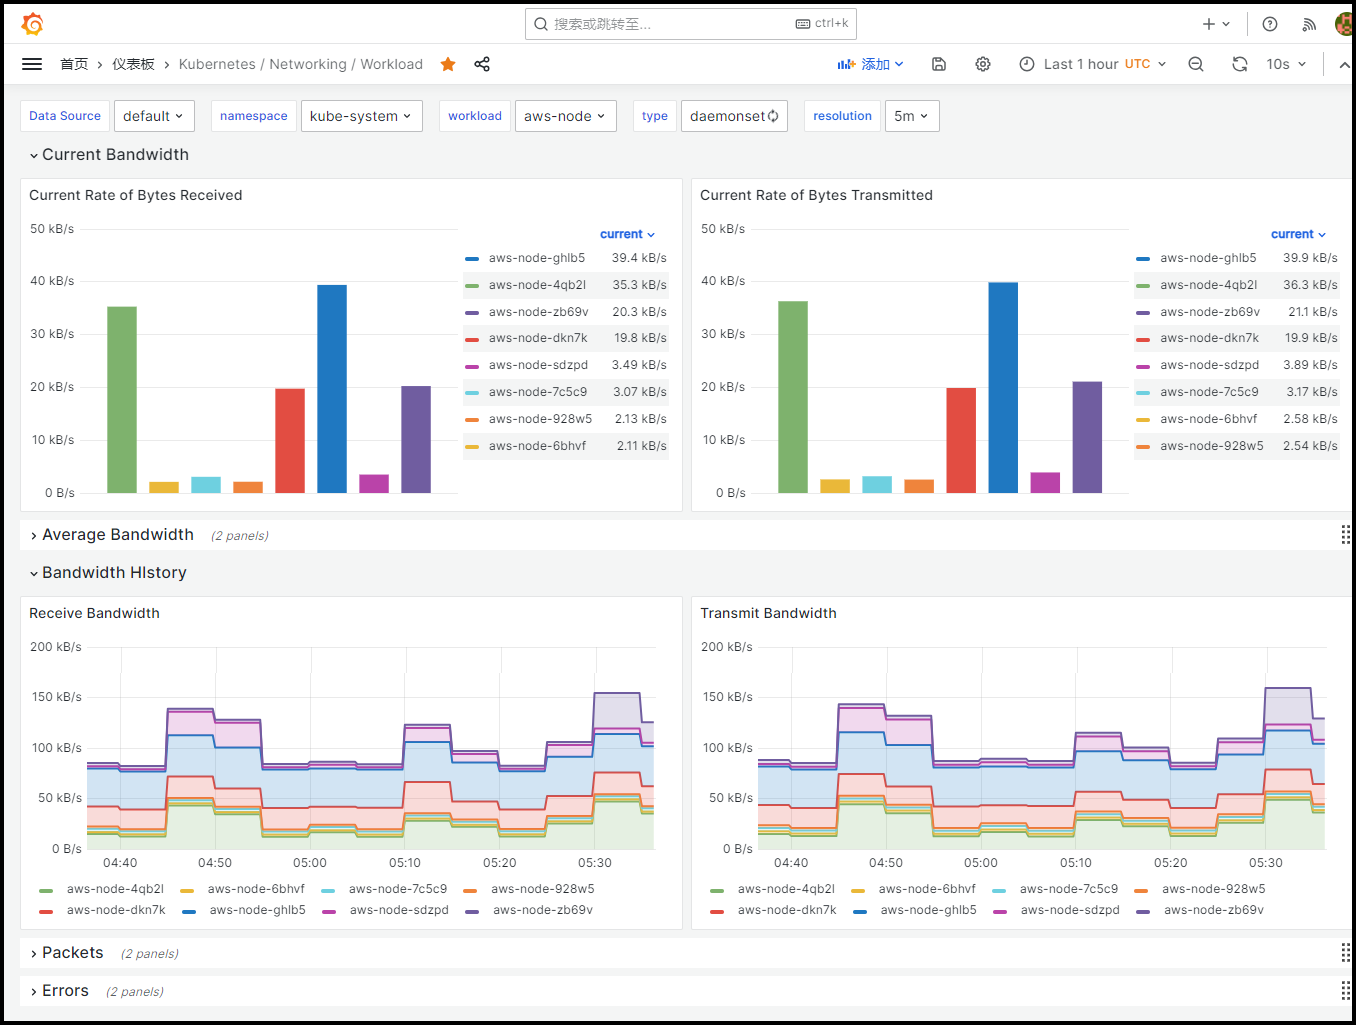
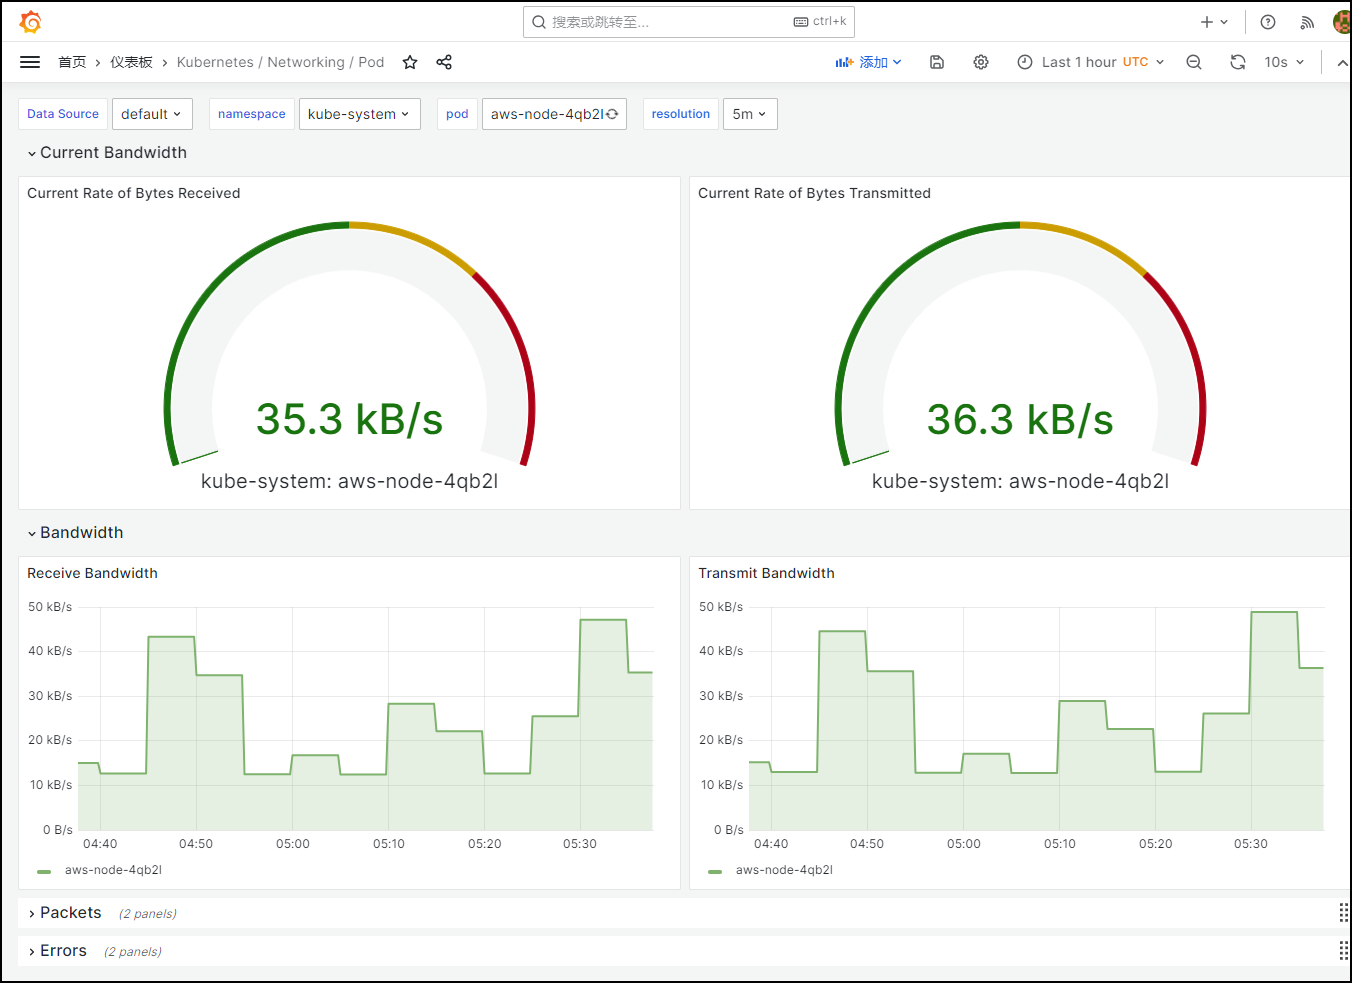
- 查看Kubernetes Pod网络传输情况
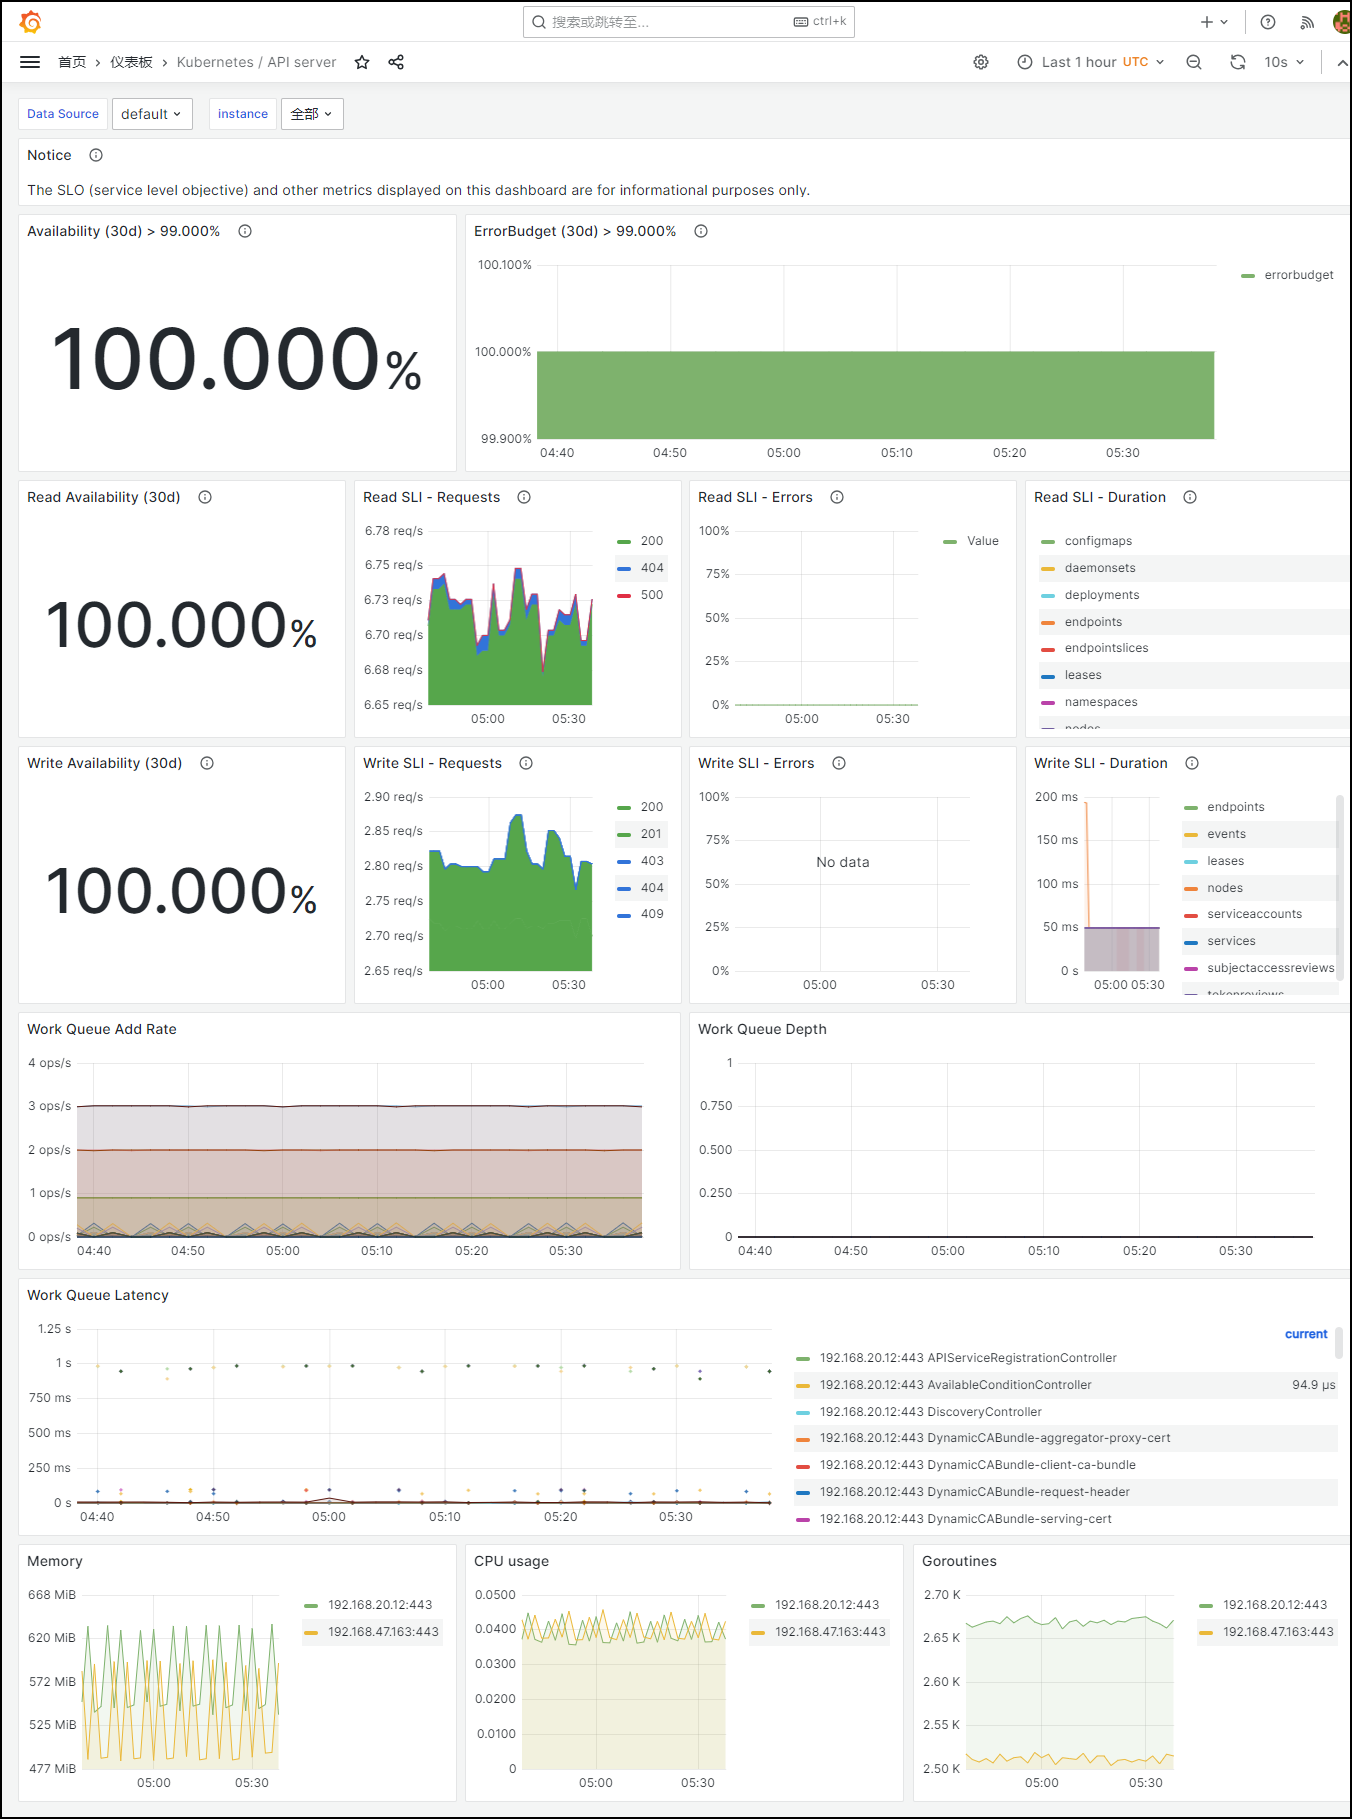
- 查看Kubernetes 服务器接口
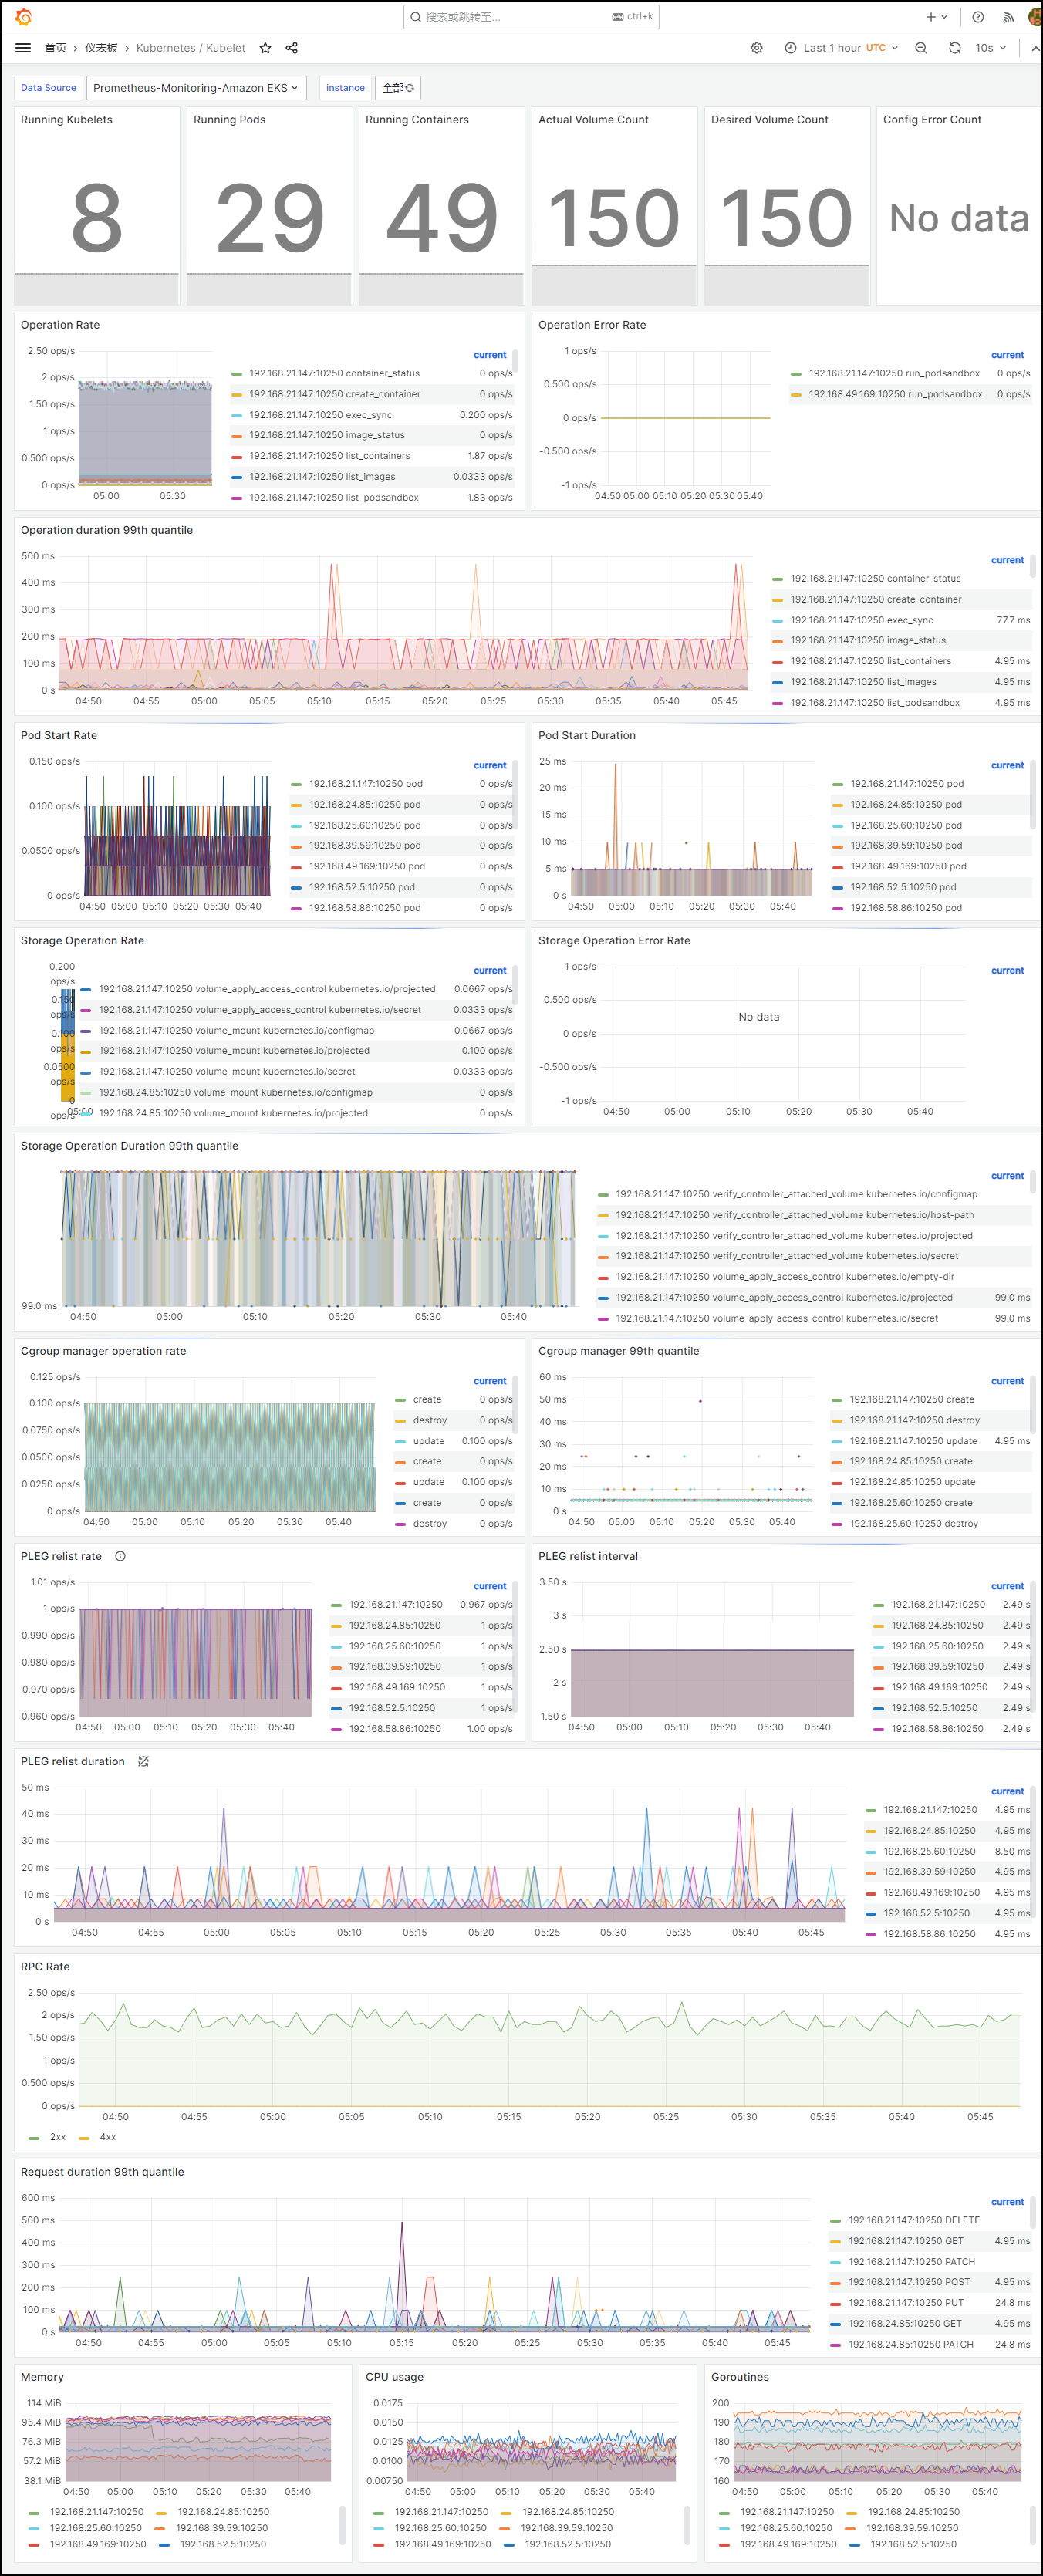
- 查看需要Kubelet命令查询操作的数据
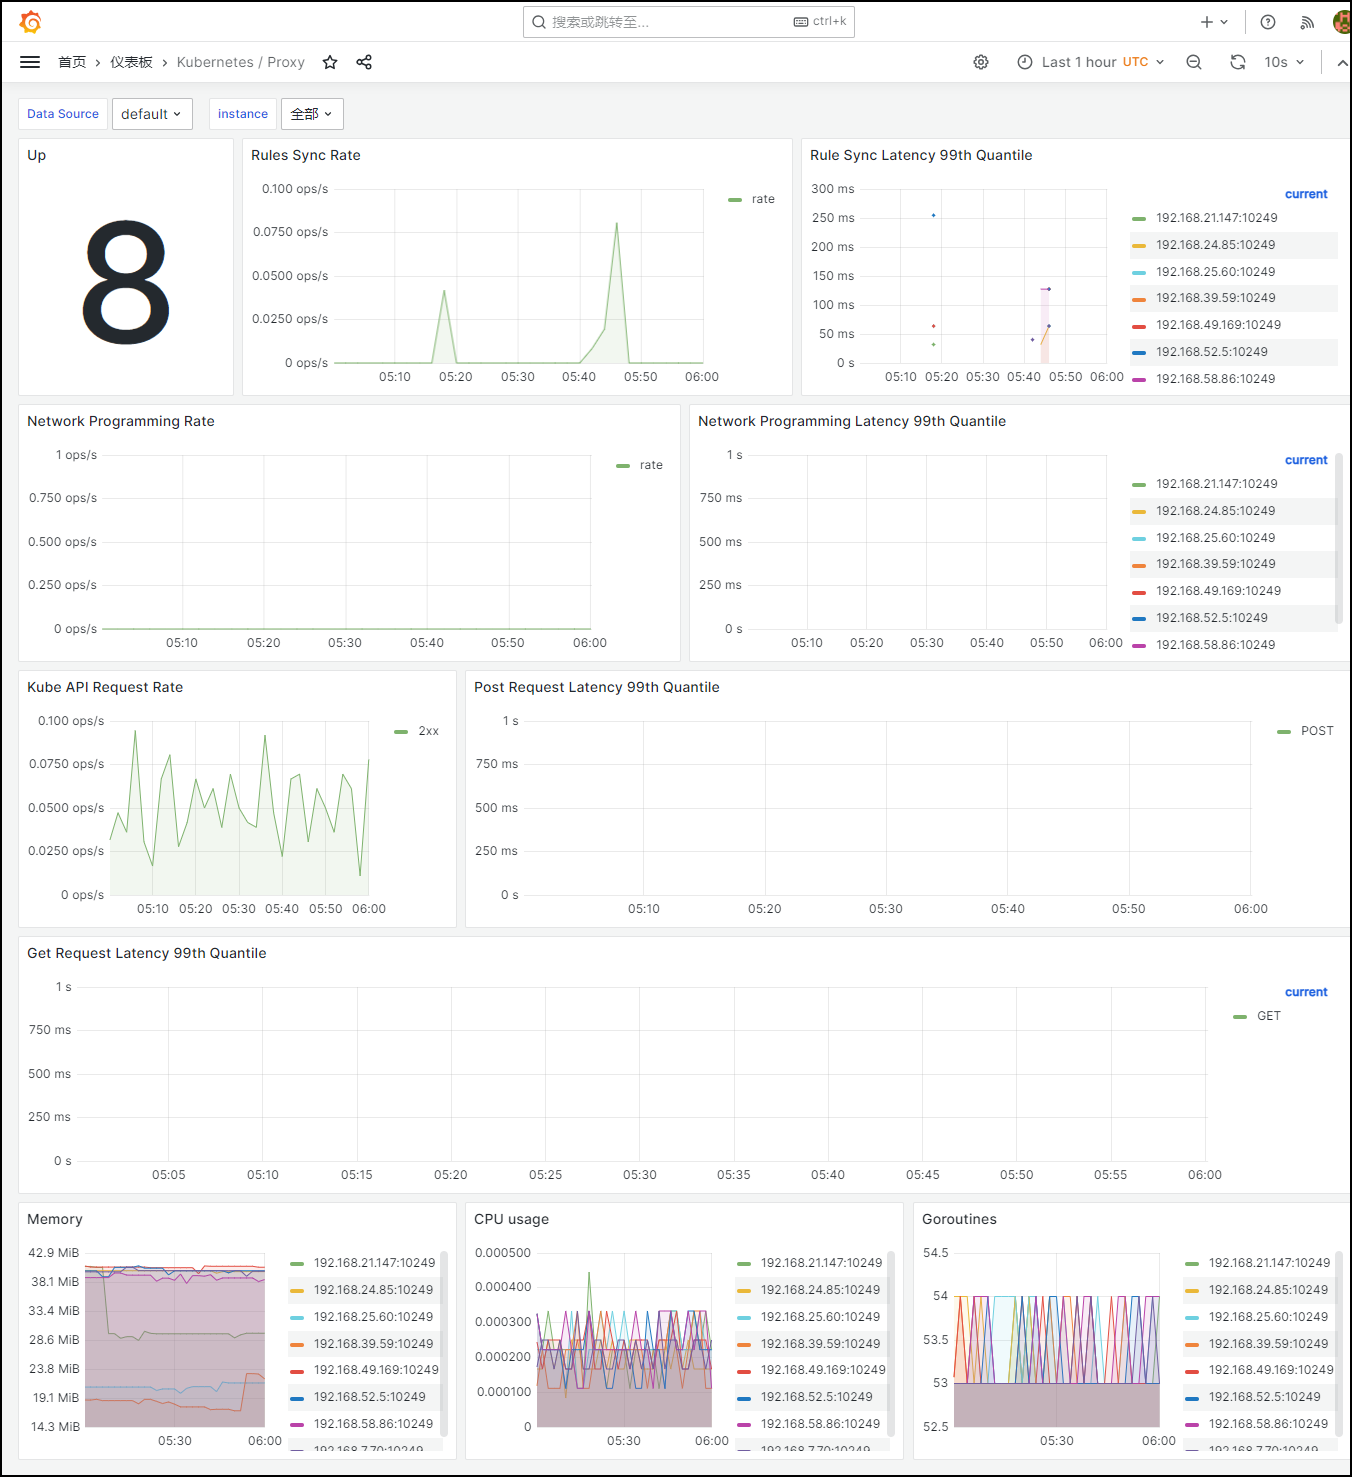
- 查看Kubernetes Proxy
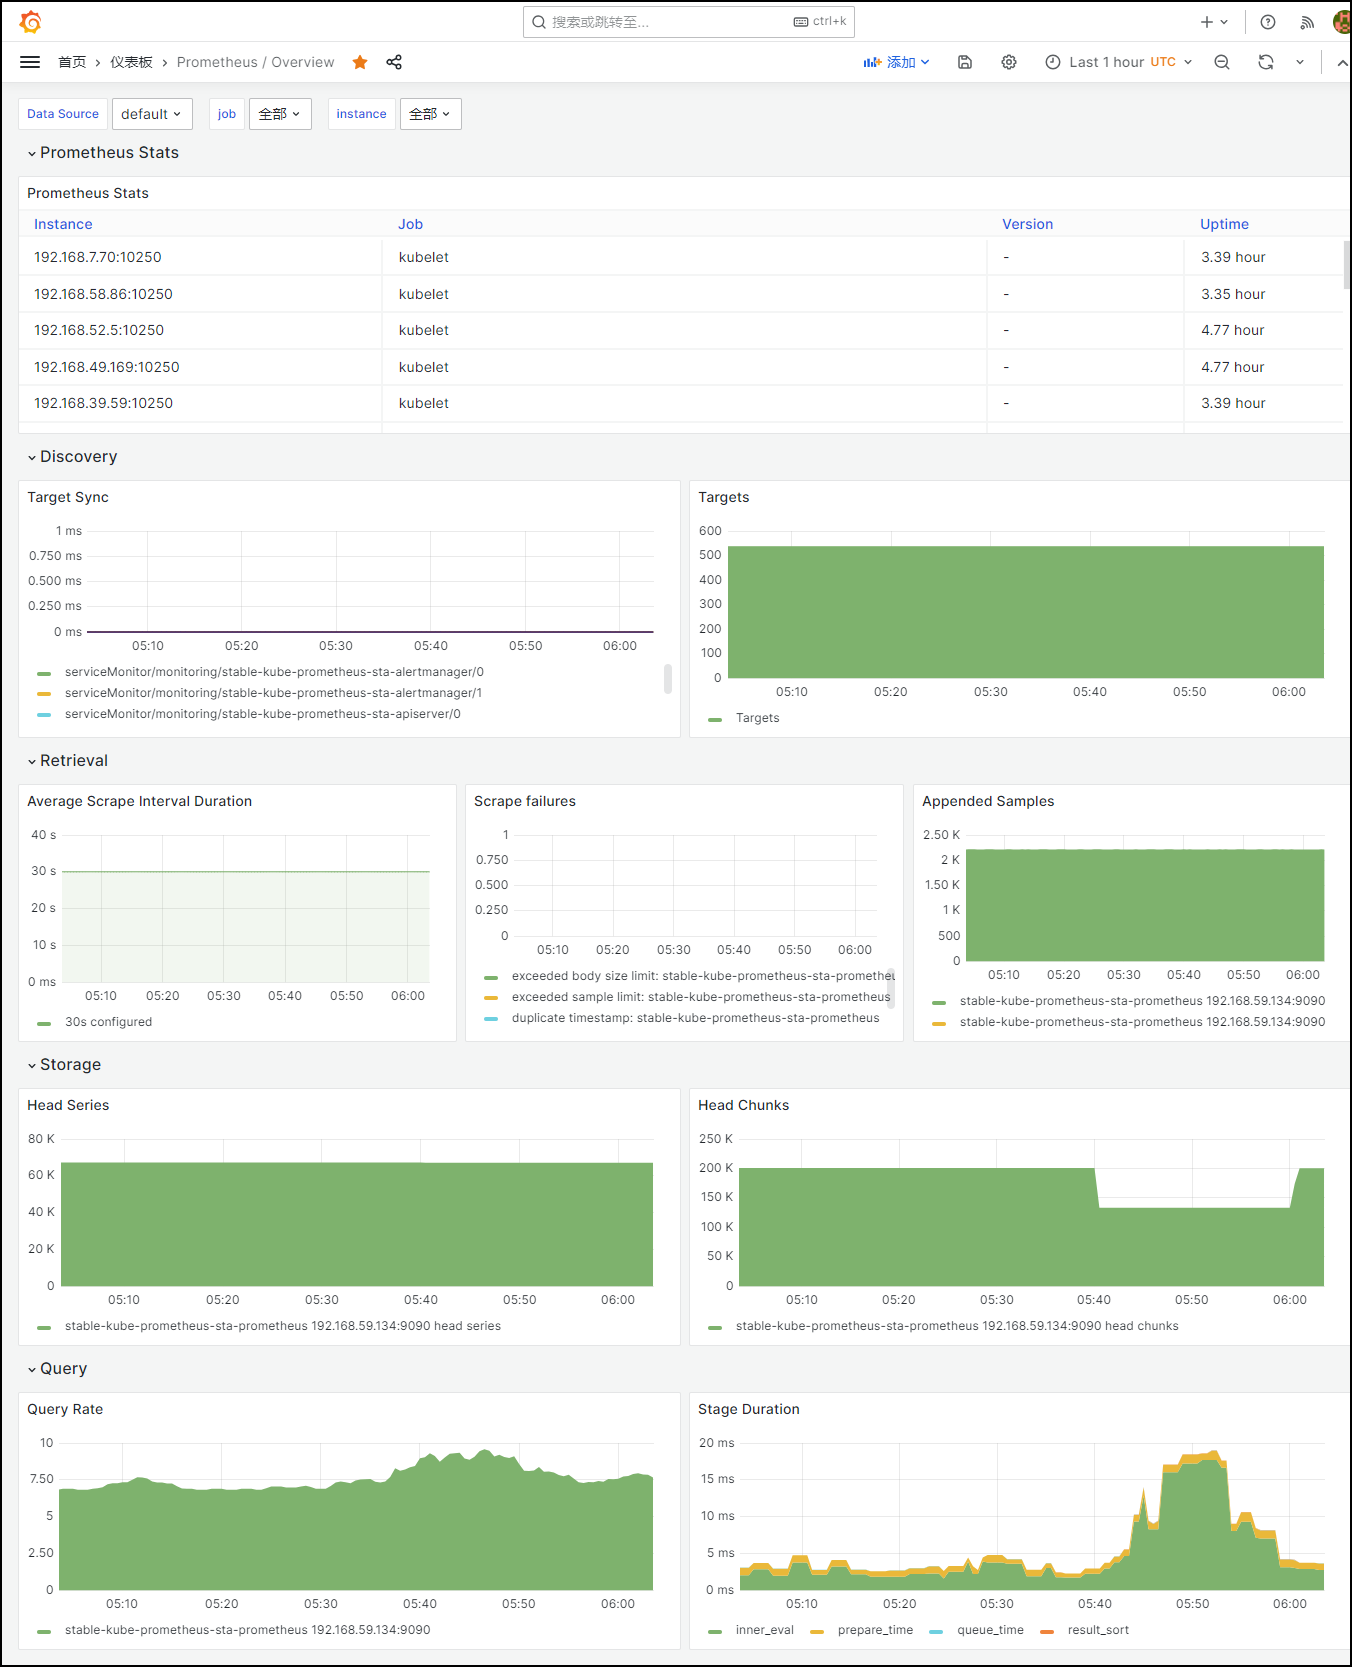
- 全局查看Prometheus
- 查看集群工作节点的系统配置参数信息