prometheus grafana linux服务器监控

news/2024/5/18 22:51:43 标签: 服务器, prometheus, grafana, docker

文章目录

  • 前传
  • node-exporter安装
  • 配置promethues监控node节点
  • grafana操作
  • 查看监控:
  • 外传

前传

prometheus grafana的安装使用:https://nanxiang.blog.csdn.net/article/details/135384541

本文说下监控nginx,prometheus grafana linux 安装配置和监控

Docker 镜像下载地址: https://hub.docker.com
比较好的hub.docker.com///-- https://hub.docker.com/u/bitnami
grafana监控面板:https://grafana.com/grafana/dashboards

node-exporter安装

多台服务器安装node-exporter,用于采集服务器数据

docker pull bitnami/node-exporter:1.7.0

docker run -itd  --name node-exporter  --restart=always   -p 9100:9100  -v /etc/localtime:/etc/localtime -v /home/docker_data/monitor/node-exporter/proc:/host/proc:ro  -v /home/docker_data/monitor/node-exporter/sys:/host/sys:ro -v /home/docker_data/monitor/node-exporter/:/rootfs:ro  bitnami/node-exporter:1.7.0

配置promethues监控node节点

vim prometheus.yml
在Prometheus配置文件按以下内容修改:

scrape_configs:
  # The job name is added as a label `job=<job_name>` to any timeseries scraped from this config.
  - job_name: 'prometheus'

    # metrics_path defaults to '/metrics'
    # scheme defaults to 'http'.

    static_configs:
    - targets: ['localhost:9090']
      labels:
        instance: prometheus

  - job_name: linux-231
    static_configs:
    - targets: ['192.168.1.231:9100']                   #被监控端的IP地址和端口号(有多个被监控端可用 逗号 隔开)
  - job_name: linux-230
    static_configs:
    - targets: ['192.168.1.230:9100']

监控node-explorter ,模版:12884

grafana_45">grafana操作

官网:https://grafana.com/grafana/dashboards
模版下载:https://grafana.com/grafana/dashboards/12884-1-node-exporter-for-prometheus-dashboard-cn-v20200628/

grafana仪表盘中导入12884模块,如果没有数据,可能是版本或者其他原因,尝试升级模块

查看promethues多少job节点
http://192.168.1.231:9090/targets

模版详情:
https://grafana.com/grafana/dashboards/12633-linux/
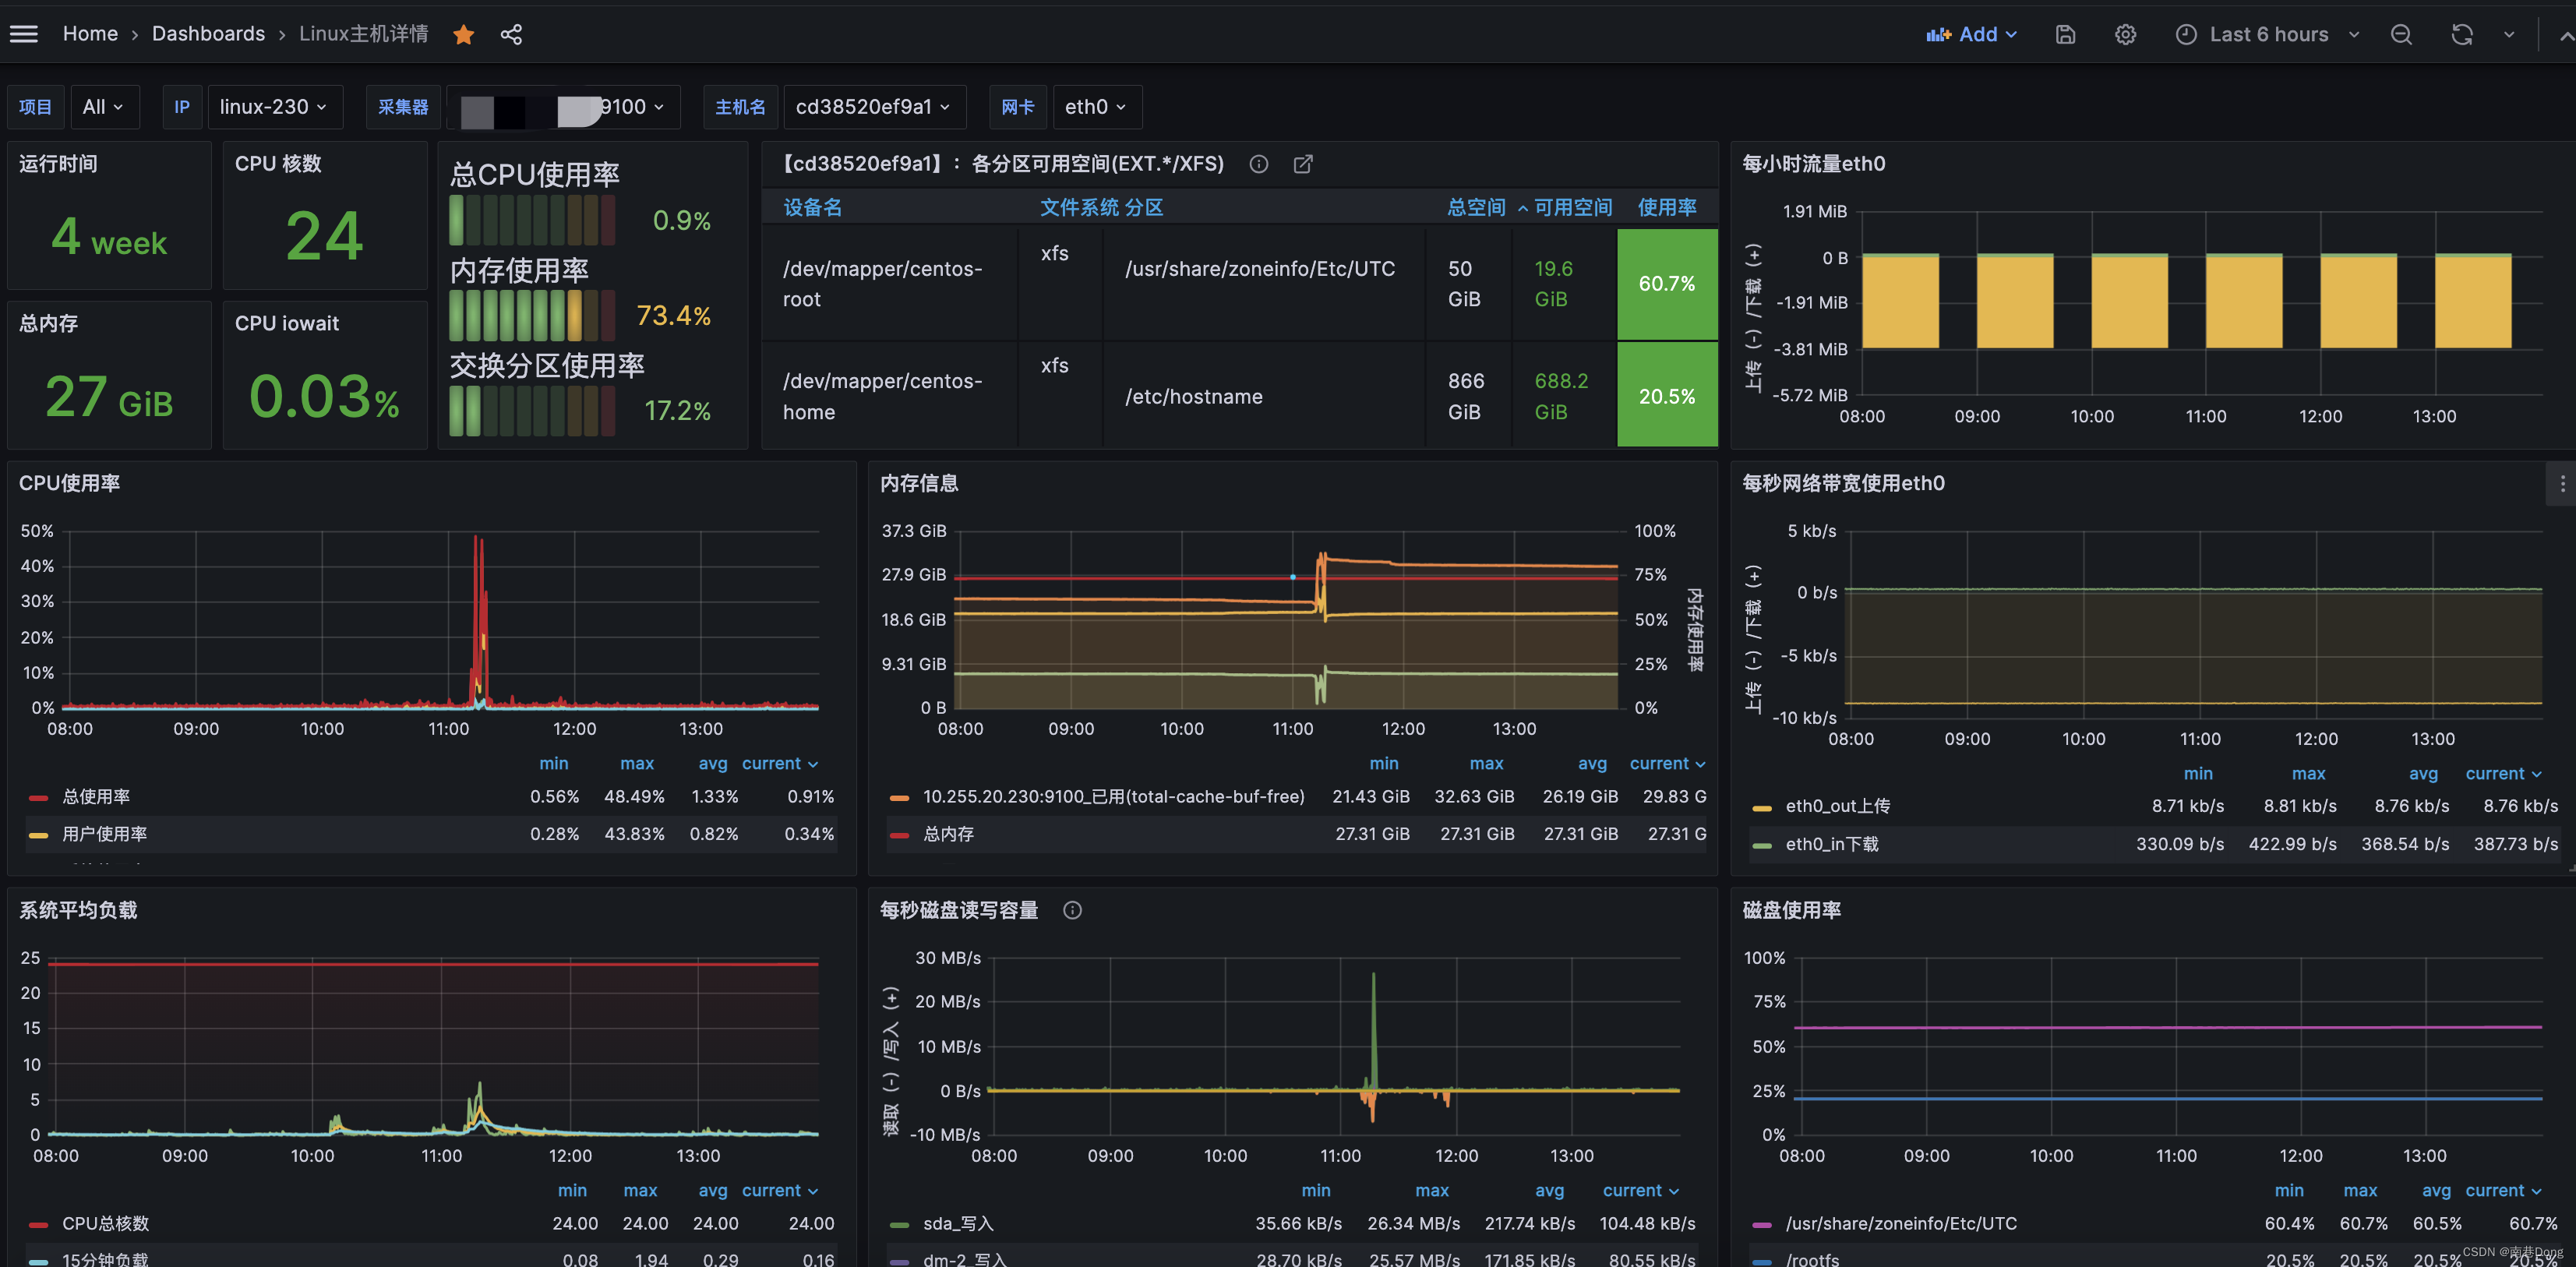
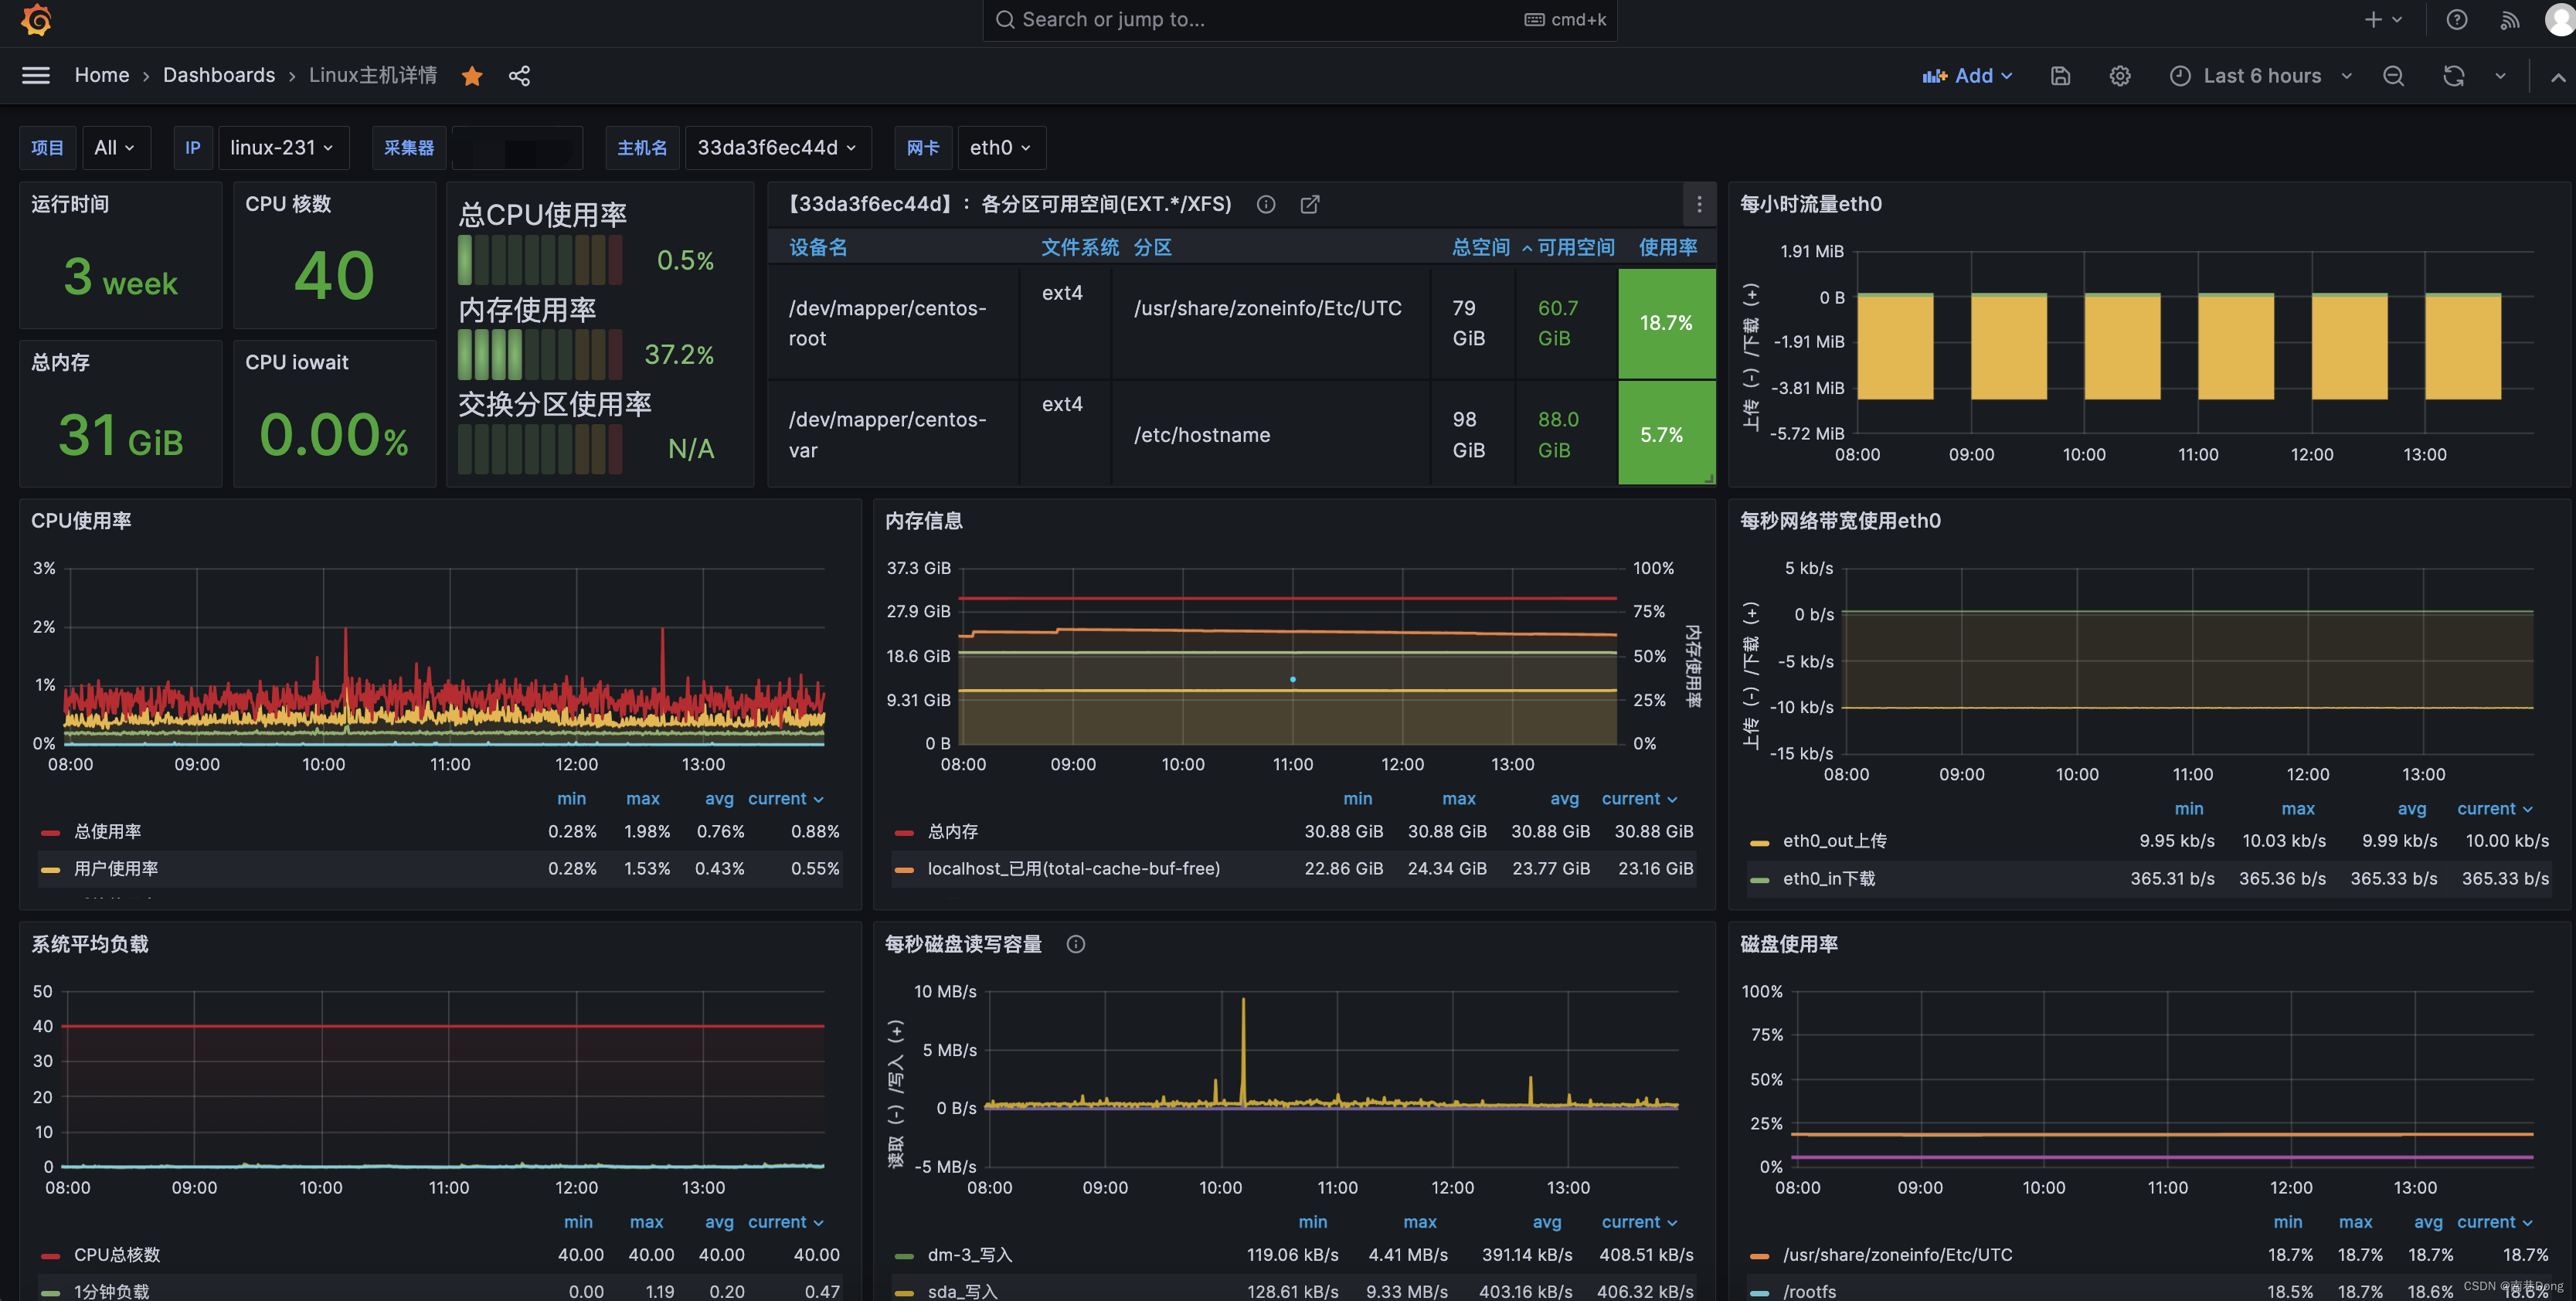
监控linux ,模版:12633/10180

查看监控:

230服务器
在这里插入图片描述
231服务器

在这里插入图片描述

外传

😜 原创不易,如若本文能够帮助到您的同学
🎉 支持我:关注我+点赞👍+收藏⭐️
📝 留言:探讨问题,看到立马回复
💬 格言:己所不欲勿施于人 扬帆起航、游历人生、永不言弃!🔥


http://www.niftyadmin.cn/n/5305941.html

相关文章

基于萤火虫算法优化的Elman神经网络数据预测 - 附代码

基于萤火虫算法优化的Elman神经网络数据预测 - 附代码 文章目录 基于萤火虫算法优化的Elman神经网络数据预测 - 附代码1.Elman 神经网络结构2.Elman 神经用络学习过程3.电力负荷预测概述3.1 模型建立 4.基于萤火虫优化的Elman网络5.测试结果6.参考文献7.Matlab代码 摘要&#x…

【12月比赛合集】4场可报名的「创新应用」、「数据分析」和「程序设计」大奖赛,任君挑选!

CompHub[1] 实时聚合多平台的数据类(Kaggle、天池…)和OJ类(Leetcode、牛客…&#xff09;比赛。本账号会推送最新的比赛消息&#xff0c;欢迎关注&#xff01; 以下信息仅供参考&#xff0c;以比赛官网为准 目录 数据分析赛&#xff08;1场比赛&#xff09;程序设计赛&#…

envoy在arm机器上的编译整理

版本信息&#xff1a; 操作系统:GUN Linux操作系统AARCH64架构。istio-proxy版本&#xff1a;istio-proxy1.15.2 编译环境搭建&#xff1a; 设置代理&#xff0c;确保可以访问Google等外网&#xff0c;这里envoy的第一次编译需要从外网下载依赖库。// 备注&#xff1a;这里一定…

输电线路分布式故障诊断装置的应用-深圳鼎信

输电线路分布式故障诊断装置是一种利用分布式行波法实现故障定位的设备&#xff0c;它的应用场景、类型和功能特点如下&#xff1a; 一、应用场景 分布式故障定位装置适用于各种复杂环境的高压输电线路&#xff0c;例如三跨线路&#xff08;跨越铁路、一级及以上公路和重要输…

第三章 前端发起HTTP请求

1. XMLHttpRequest API 回顾与使用案例 XMLHttpRequest (XHR) 是一个较早的、由浏览器提供的API&#xff0c;用于在后台&#xff08;异步&#xff09;与服务器交换数据。它允许网页从服务器请求新的数据并在不重新加载整个网页的情况下更新部分网页内容。 // 创建一个新的XML…

element ui图片上传组件封装+校验黑白照片

项目需求是在上传照片的时候&#xff0c;不能上传黑白照片。如果上传的黑白照片需要提示。所以就封装的一个组件&#xff0c;校验照片颜色也是我在网上找到的&#xff0c;但是原文链接找不见了。所以自己改了改封装的一个小功能。 // components/ImageUpload/index.vue <tem…

docker容器添加新的端口映射

通常在运行容器时&#xff0c;我们都会通过参数 -p来指定宿主机和容器端口的映射&#xff0c;例如 docker run -it -d --restart always --name [指定容器名] -p 8899:8080 [指定镜像名]上述命令将容器内的8080端口映射到宿主机的8899端口。 参数说明 -d 表示后台运行容器 -t…

Windows 使用 nmap软件测试 UDP 端口

下载windows版nmap &#xff0c;下载后双机默认安装。 Download the Free Nmap Security Scanner for Linux/Mac/Windows 打开CMD &#xff0c; 输入 cd C:\Program Files (x86)\Nmap C:\Program Files (x86)\Nmap>ncat -z -v -u ntp.aliyun.com 123 Ncat: Version 7.80 ( …