文章目录
- 前传
- prometheus exporter容器
- 监控nginx
- prometheus中添加nginx-exporter
- 配置 grafana
- 外传
前传
prometheus grafana的安装使用:https://nanxiang.blog.csdn.net/article/details/135384541
本文说下监控nginx,prometheus grafana nginx 安装配置和使用
Docker 镜像下载地址: https://hub.docker.com
比较好的hub.docker.com///-- https://hub.docker.com/u/bitnami
grafana监控面板:https://grafana.com/grafana/dashboards
prometheus_exporter_10">prometheus exporter容器
在docker中下载nginx/nginx-prometheus-exporter镜像,并使用该镜像去运行容器
docker pull nginx/nginx-prometheus-exporter

docker run -itd -p 9113:9113 --name nginx-exporter  --restart=always -v /etc/localtime:/etc/localtime  nginx/nginx-prometheus-exporter -nginx.scrape-uri http://192.168.1.230/stub_status
192.168.1.230 被监控的nginx服务器的地址
nginx_19">监控nginx
nginxstub_status_20">nginx需要加载stub_status监控
[root@test230 ~]# nginx -V
nginx version: nginx/1.20.1
built by gcc 4.8.5 20150623 (Red Hat 4.8.5-44) (GCC)
built with OpenSSL 1.1.1g FIPS  21 Apr 2020
TLS SNI support enabled
configure arguments: --prefix=/usr/share/nginx --sbin-path=/usr/sbin/nginx --modules-path=/usr/lib64/nginx/modules --conf-path=/etc/nginx/nginx.conf --error-log-path=/var/log/nginx/error.log --http-log-path=/var/log/nginx/access.log --http-client-body-temp-path=/var/lib/nginx/tmp/client_body --http-proxy-temp-path=/var/lib/nginx/tmp/proxy --http-fastcgi-temp-path=/var/lib/nginx/tmp/fastcgi --http-uwsgi-temp-path=/var/lib/nginx/tmp/uwsgi --http-scgi-temp-path=/var/lib/nginx/tmp/scgi --pid-path=/run/nginx.pid --lock-path=/run/lock/subsys/nginx --user=nginx --group=nginx --with-compat --with-debug --with-file-aio --with-google_perftools_module --with-http_addition_module --with-http_auth_request_module --with-http_dav_module --with-http_degradation_module --with-http_flv_module --with-http_gunzip_module --with-http_gzip_static_module --with-http_image_filter_module=dynamic --with-http_mp4_module --with-http_perl_module=dynamic --with-http_random_index_module --with-http_realip_module --with-http_secure_link_module --with-http_slice_module --with-http_ssl_module --with-http_stub_status_module --with-http_sub_module --with-http_v2_module --with-http_xslt_module=dynamic --with-mail=dynamic --with-mail_ssl_module --with-pcre --with-pcre-jit --with-stream=dynamic --with-stream_ssl_module --with-stream_ssl_preread_module --with-threads --with-cc-opt='-O2 -g -pipe -Wall -Wp,-D_FORTIFY_SOURCE=2 -fexceptions -fstack-protector-strong --param=ssp-buffer-size=4 -grecord-gcc-switches -specs=/usr/lib/rpm/redhat/redhat-hardened-cc1 -m64 -mtune=generic' --with-ld-opt='-Wl,-z,relro -specs=/usr/lib/rpm/redhat/redhat-hardened-ld -Wl,-E'
nginx_29">查看有没有,如果有,去配置下nginx
   location /stub_status {
                stub_status on;
                access_log off;
                #allow 127.0.0.1; # 允许本地访问
                #deny all; # 禁止其他IP访问
        }
nginx_40">重要,需要重启nginx
[root@test230 ~]# nginx -t
nginx: the configuration file /etc/nginx/nginx.conf syntax is ok
nginx: configuration file /etc/nginx/nginx.conf test is successful
[root@test230 ~]# nginx -s stop
[root@test230 ~]# systemctl start nginx
只是nginx -s reload是不生效的,一定要重启
测试监控是否成功
查看nginx是否已经开启监控stub
    [root@test230 opt]# curl http://127.0.0.1/stub_status
    Active connections: 6
    server accepts handled requests
     9702 9702 165810
    Reading: 0 Writing: 1 Waiting: 5
在浏览器中输入http://192.168.1.230:9113,如果显示出测量数据就表示成功.
需要注意的是输入的IP地址为nginx/nginx-prometheus-exporter容器所配置的IP地址。
prometheusnginxexporter_68">prometheus中添加nginx-exporter
- job_name: nginx
static_configs: - targets: [‘1192.168.1.230:9113’]
#192.168.1.230:9113与第三步测试的地址一至
配置 grafana
需要对应应的nginx/nginx-prometheus-exporter支持的仪表盘(dasdbord)
在grafana仪表盘中导入11280模块
或者自行去找合适的监控dasdbord
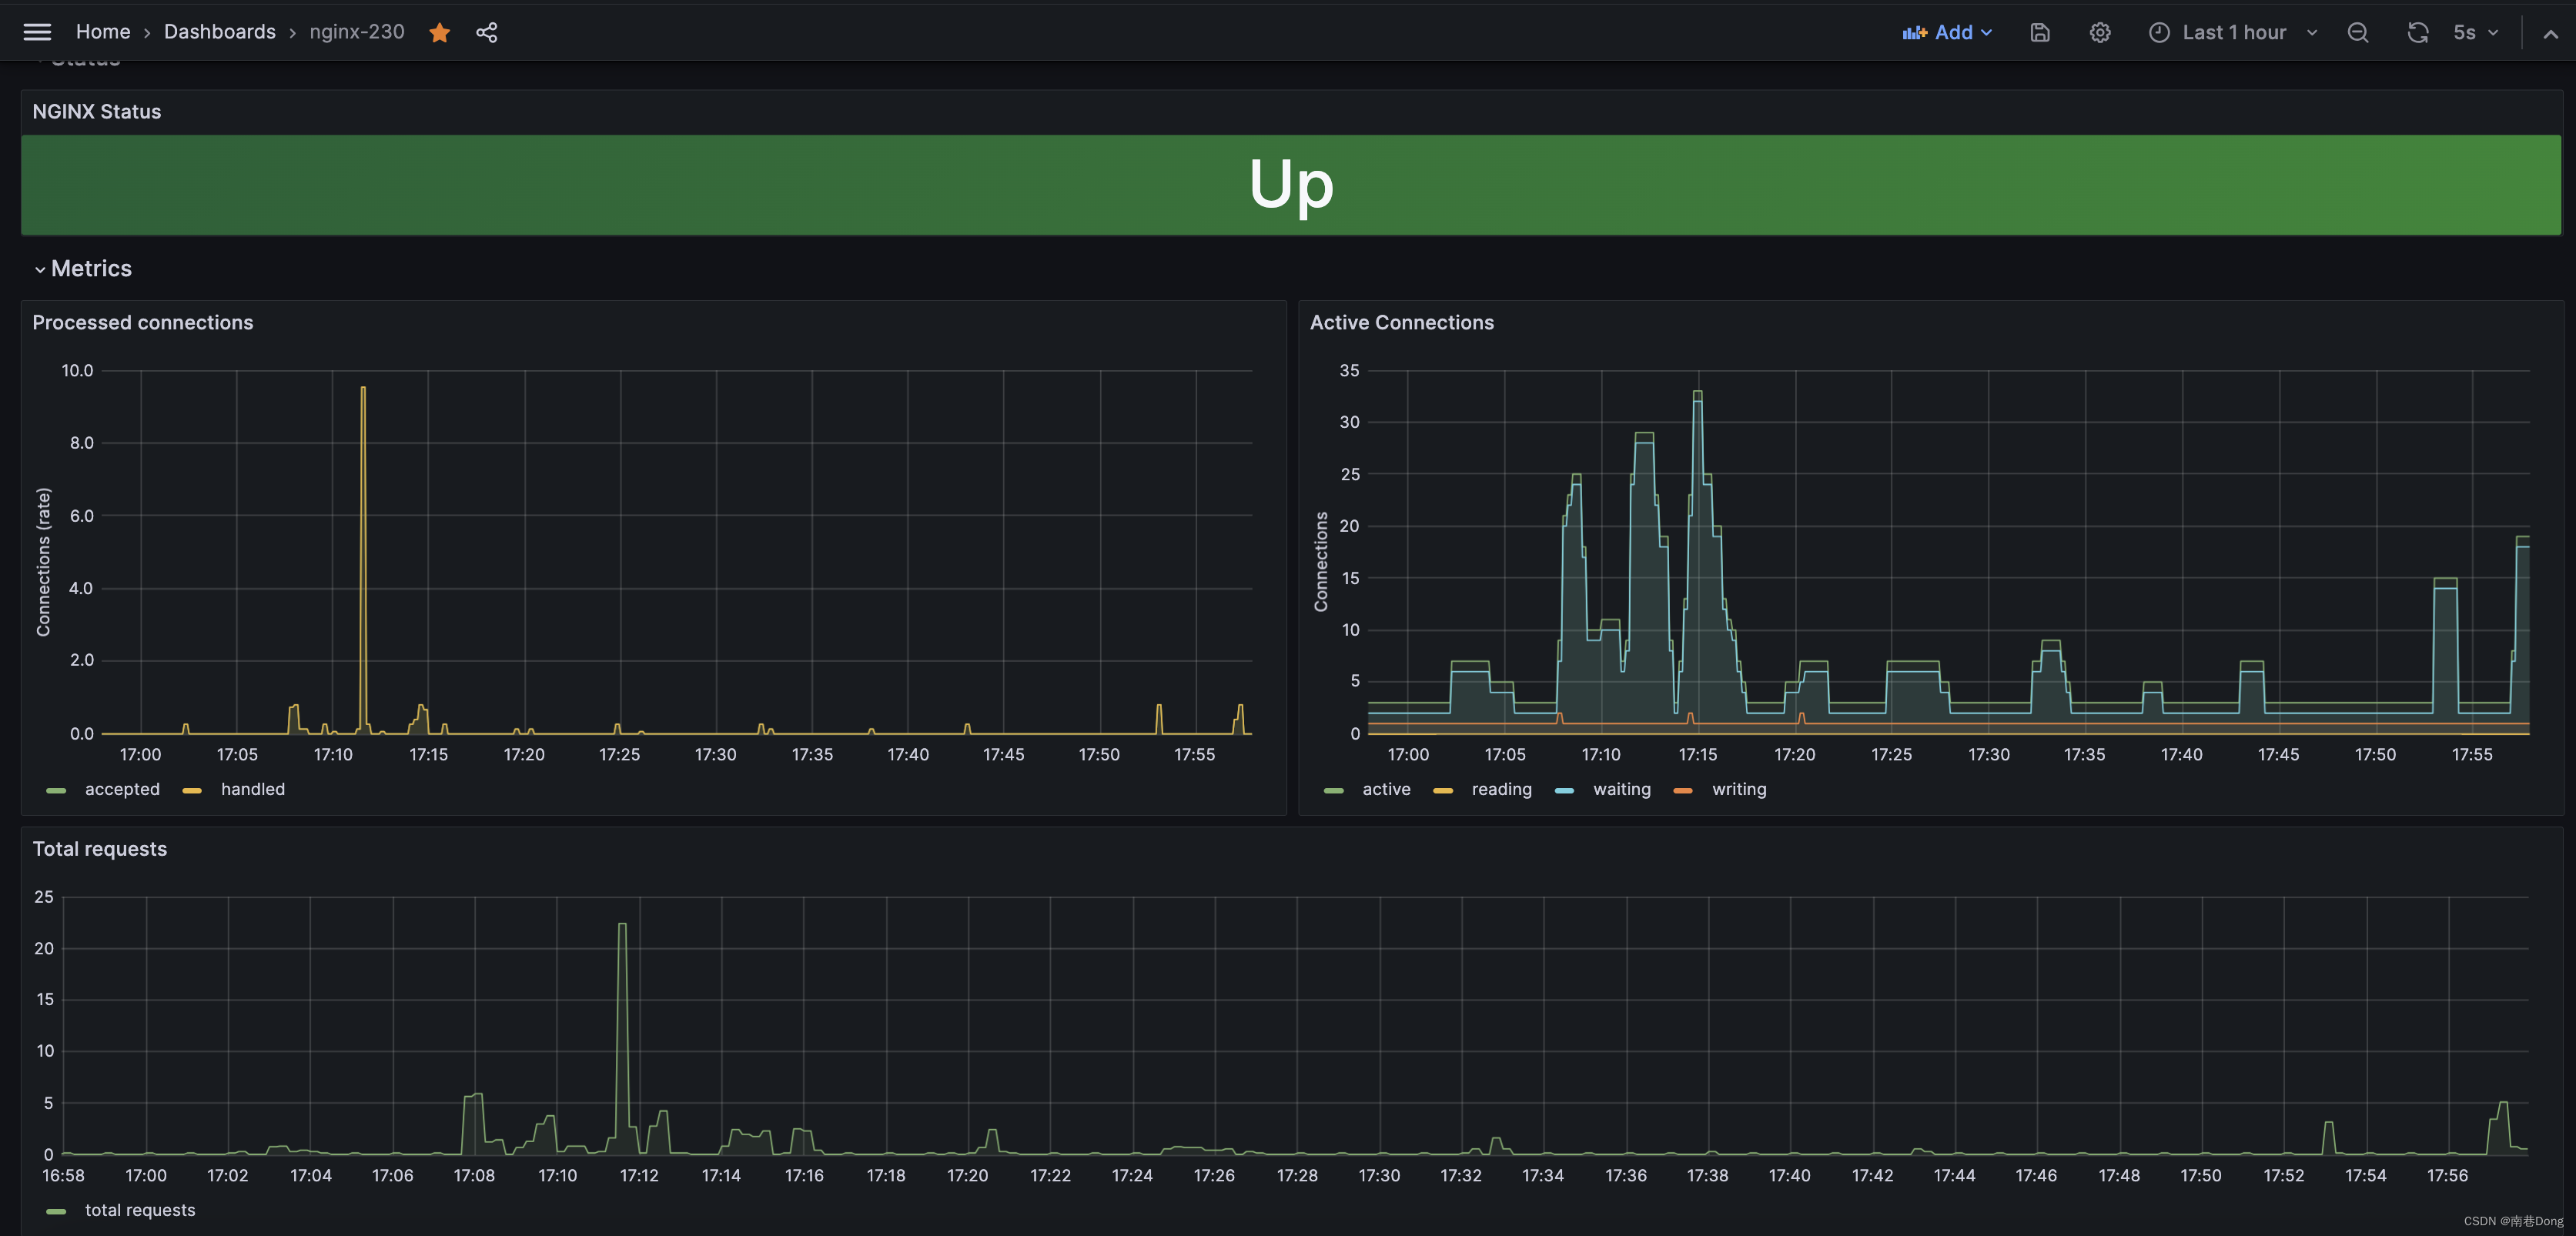
这个只是简单的监控,具体负责请自行分析吧。。
外传
😜 原创不易,如若本文能够帮助到您的同学
🎉 支持我:关注我+点赞👍+收藏⭐️
📝 留言:探讨问题,看到立马回复
💬 格言:己所不欲勿施于人 扬帆起航、游历人生、永不言弃!🔥