文章目录
- 1. 系统信息参数说明
- 2. Docker安装
- 3. minikube安装
- 4. kubectl安装
- 5. Helm安装
- 6. 启动Kubernetes集群v1.28.3
- 7. 使用helm安装Prometheus
- 8. 使用helm安装Grafana
- 9. Grafana的Dashboard设定
- 10. 设定Prometheus数据源
- 11. 导入Kubernetes Dashboard
- 12. 实验过程中的常见问题
- 13. 参考链接
1. 系统信息参数说明
[root@minikube ~]# uname -a
Linux minikube 5.14.0-284.11.1.el9_2.x86_64 #1 SMP PREEMPT_DYNAMIC Tue May 9 17:09:15 UTC 2023 x86_64 x86_64 x86_64 GNU/Linux

[root@minikube ~]# hostnamectl
 Static hostname: minikube
       Icon name: computer-vm
         Chassis: vm 🖴
      Machine ID: 8f112fe303914f1e8e27c6b68d205117
         Boot ID: 75046d09558f47d9a823fff033cb1fe1
  Virtualization: vmware
Operating System: Rocky Linux 9.2 (Blue Onyx)
     CPE OS Name: cpe:/o:rocky:rocky:9::baseos
          Kernel: Linux 5.14.0-284.11.1.el9_2.x86_64
    Architecture: x86-64
 Hardware Vendor: VMware, Inc.
  Hardware Model: VMware Virtual Platform
Firmware Version: 6.00

[root@minikube ~]# free -g
               total        used        free      shared  buff/cache   available
Mem:               7           2           1           0           4           5
Swap:              0           0           0
[root@minikube ~]# lscpu
2. Docker安装
# 移除旧的docker
[root@minikube ~]# sudo yum remove docker \
                  docker-client \
                  docker-client-latest \
                  docker-common \
                  docker-latest \
                  docker-latest-logrotate \
                  docker-logrotate \
                  docker-engine

# 安装第三方依赖库
[root@minikube ~]# sudo yum install -y yum-utils

# 添加Docker-ce仓库
[root@minikube ~]# sudo yum-config-manager --add-repo https://download.docker.com/linux/centos/docker-ce.repo

# 安装docker相关安装包
[root@minikube ~]# sudo yum install docker-ce docker-ce-cli containerd.io docker-buildx-plugin docker-compose-plugin

# 启动docker服务
[root@minikube ~]# sudo systemctl start docker
3. minikube安装
[root@minikube ~]# curl -LO https://storage.googleapis.com/minikube/releases/latest/minikube-latest.x86_64.rpm

[root@minikube ~]# sudo rpm -Uvh minikube-latest.x86_64.rpm
4. kubectl安装
[root@minikube ~]# yum install -y kubectl
5. Helm安装
[root@minikube ~]# curl -fsSL -o get_helm.sh https://raw.githubusercontent.com/helm/helm/master/scripts/get-helm-3

[root@minikube ~]# chmod 700 get_helm.sh

[root@minikube ~]# ./get_helm.sh
6. 启动Kubernetes集群v1.28.3
[root@minikube ~]# minikube start --kubernetes-version=v1.28.3 --memory=6g
😄  Rocky 9.2 上的 minikube v1.32.0
❗  当提供 --force 参数时,minikube 将跳过各种验证,这可能会导致意外行为
✨  自动选择 docker 驱动。其他选项:none, ssh
🛑  The "docker" driver should not be used with root privileges. If you wish to continue as root, use --force.
💡  如果您在VM中运行 minikube,请考虑使用 --driver=none:
📘    https://minikube.sigs.k8s.io/docs/reference/drivers/none/
📌  使用具有 root 权限的 Docker 驱动程序
👍  正在集群 minikube 中启动控制平面节点 minikube
🚜  正在拉取基础镜像 ...
💾  正在下载 Kubernetes v1.28.3 的预加载文件...
    > preloaded-images-k8s-v18-v1...:  403.35 MiB / 403.35 MiB  100.00% 1.60 Mi
    > gcr.io/k8s-minikube/kicbase...:  453.90 MiB / 453.90 MiB  100.00% 1.70 Mi
🔥  Creating docker container (CPUs=2, Memory=2200MB) ...
🐳  正在 Docker 24.0.7 中准备 Kubernetes v1.28.3…
    ▪ 正在生成证书和密钥...
    ▪ 正在启动控制平面...
    ▪ 配置 RBAC 规则 ...
🔗  配置 bridge CNI (Container Networking Interface) ...
🔎  正在验证 Kubernetes 组件...
    ▪ 正在使用镜像 gcr.io/k8s-minikube/storage-provisioner:v5
🌟  启用插件: storage-provisioner, default-storageclass
🏄  完成!kubectl 现在已配置,默认使用"minikube"集群和"default"命名空间

# 查看集群状态
[root@minikube ~]# minikube status
minikube
type: Control Plane
host: Running
kubelet: Running
apiserver: Running
kubeconfig: Configured
7. 使用helm安装Prometheus
[root@minikube ~]# kubectl create ns monitoring
namespace/monitoring created

[root@minikube ~]# helm repo add prometheus-community https://prometheus-community.github.io/helm-charts
"prometheus-community" has been added to your repositories

[root@minikube ~]# helm repo list
NAME                    URL
prometheus-community    https://prometheus-community.github.io/helm-charts

[root@minikube ~]# helm search repo prometheus-community

[root@minikube ~]# helm install prometheus prometheus-community/prometheus

[root@minikube ~]# kubectl expose service prometheus-server --type=NodePort --target-port=9090 --name=prometheus-server-np
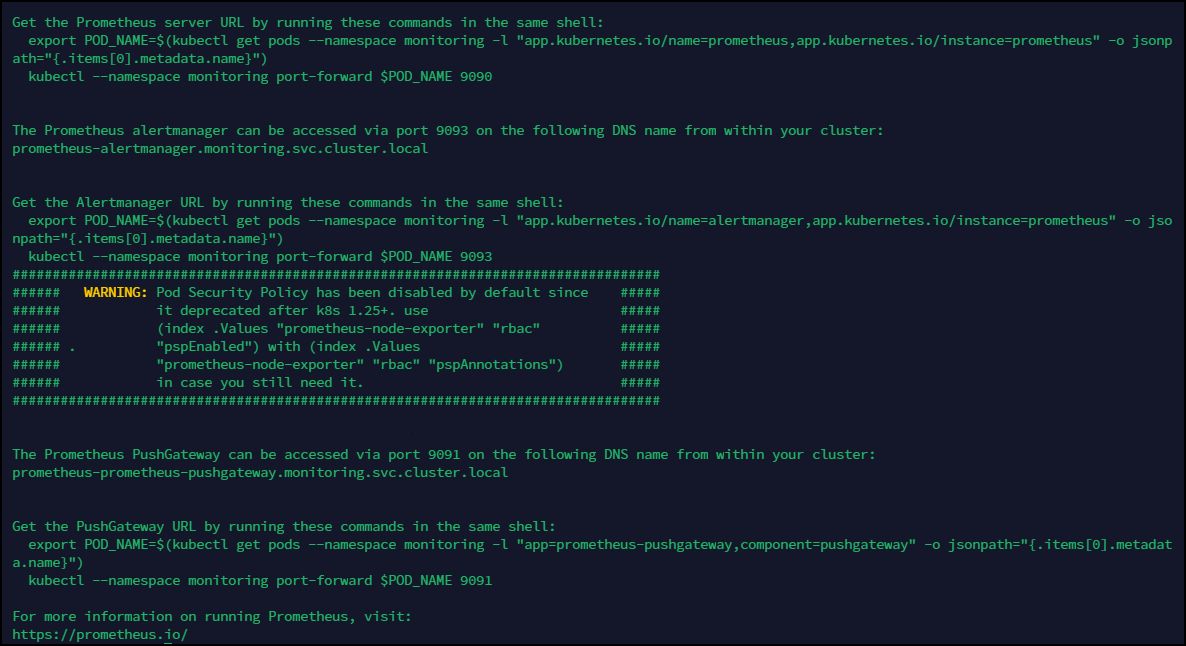
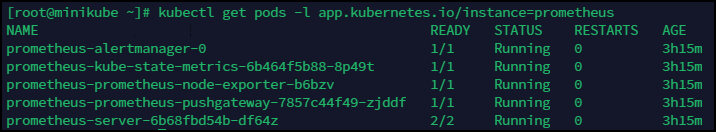
通过运行以下命令来检查状态
[root@minikube ~]# kubectl get pods -l app.kubernetes.io/instance=prometheus
NAME                                                 READY   STATUS    RESTARTS   AGE
prometheus-alertmanager-0                            1/1     Running   0          3h15m
prometheus-kube-state-metrics-6b464f5b88-8p49t       1/1     Running   0          3h15m
prometheus-prometheus-node-exporter-b6bzv            1/1     Running   0          3h15m
prometheus-prometheus-pushgateway-7857c44f49-zjddf   1/1     Running   0          3h15m
prometheus-server-6b68fbd54b-df64z                   2/2     Running   0          3h15m
由于使用的是 Minikube,第二个命令prometheus-server使用NodePort. 这样,当 Pod 准备就绪时,就可以轻松访问 Prometheus Web 界面:
minikube service prometheus-server-np

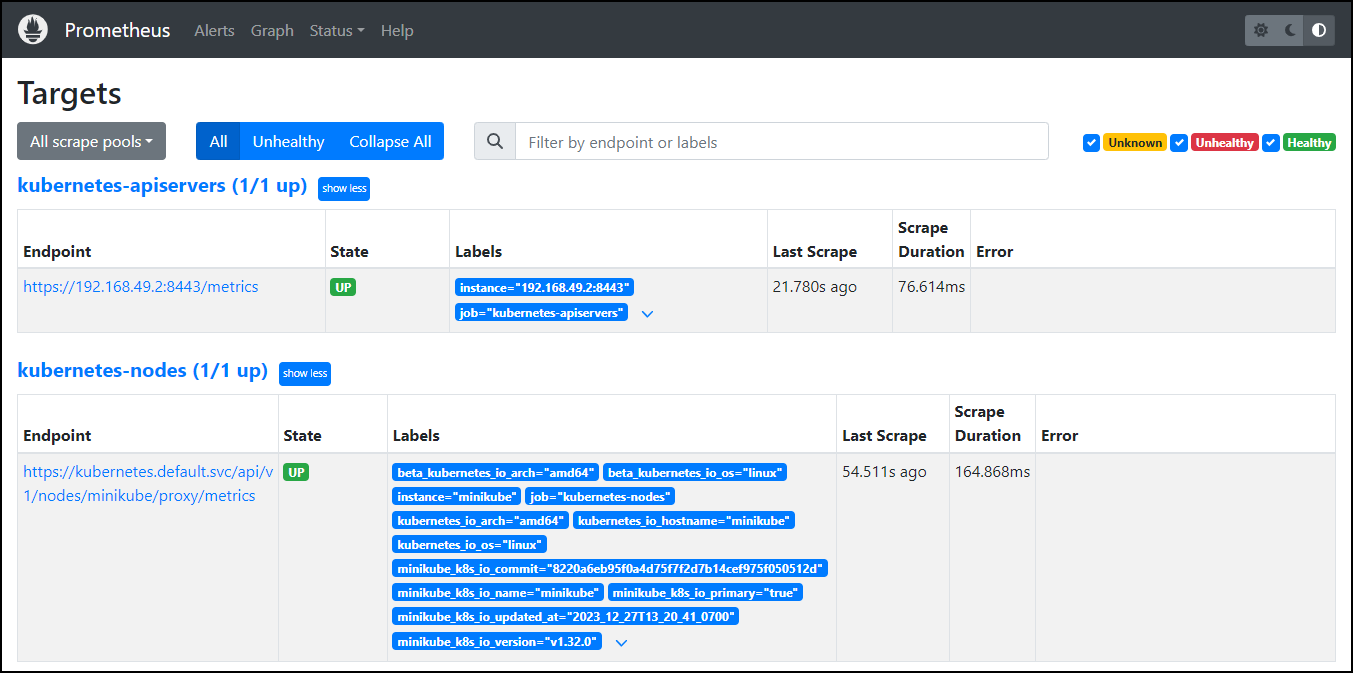
[root@minikube ~]# kubectl port-forward svc/prometheus-server-np 30944:80 --address='0.0.0.0'
Forwarding from 0.0.0.0:30944 -> 9090
http://192.168.20.20:30944/targets
8. 使用helm安装Grafana
# 将存储库添加到 helm 配置中
[root@minikube ~]# helm repo add grafana https://grafana.github.io/helm-charts
"grafana" has been added to your repositories

[root@minikube ~]# helm repo list
NAME                    URL
prometheus-community    https://prometheus-community.github.io/helm-charts
grafana                 https://grafana.github.io/helm-charts

[root@minikube ~]# helm search repo grafana

# 使用提供的图表安装 Grafana
[root@minikube ~]# helm install grafana grafana/grafana
[root@minikube ~]# kubectl expose service grafana --type=NodePort --target-port=3000 --name=grafana-np
由于使用的是 Minikube,为了轻松访问 Grafana 的 Web 界面,将该服务公开为NodePort。
注意: Grafana 默认受密码保护,为了检索admin用户密码,我们可以运行以下命令:
kubectl get secret --namespace default grafana -o jsonpath="{.data.admin-password}" | base64 --decode ; echo
wYISKh0bkkLuQm0TOEOUoVx4M1AW6q70JlOBABS0
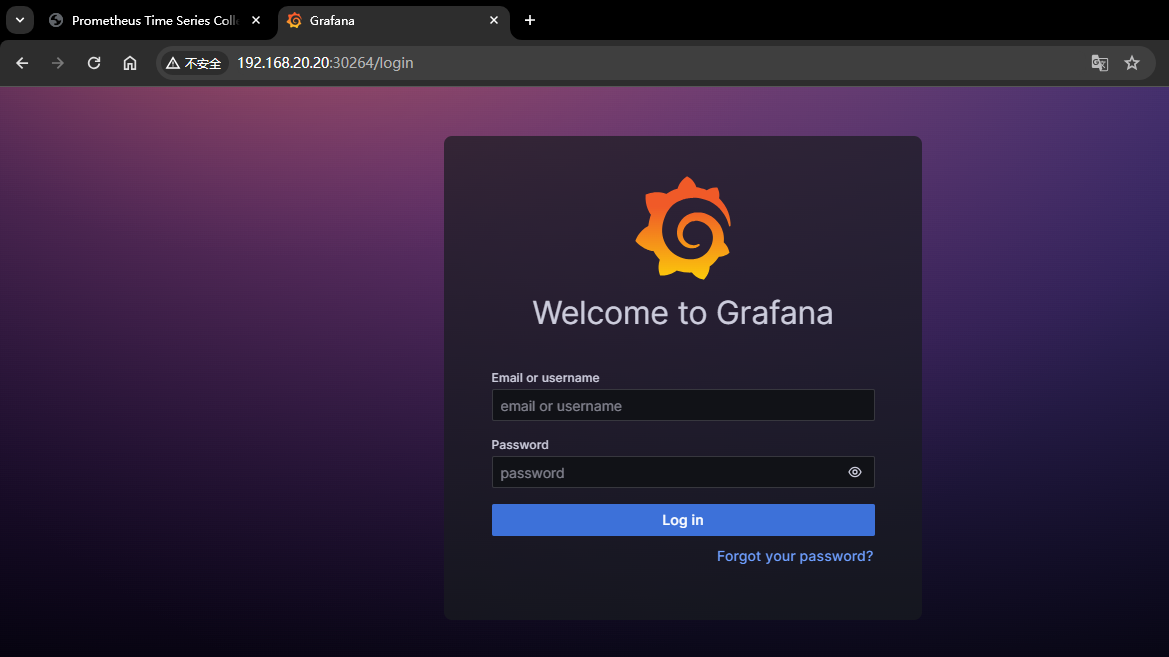
现在可以使用检索到的用户和密码加载 Grafana Web 界面
[root@minikube ~]# kubectl port-forward svc/grafana-np 30264:80 --address='0.0.0.0'
Forwarding from 0.0.0.0:30264 -> 3000
9. Grafana的Dashboard设定
root@minikube ~]# kubectl get secret --namespace monitoring grafana -o jsonpath="{.data.admin-password}" | base64 --decode ; echo
uJEkCoHDGjfkUdvOP8i3djaIvPOggK2tMZcdPKWa


[root@minikube ~]# export POD_NAME=$(kubectl get pods --namespace monitoring -l "app.kubernetes.io/name=grafana,app.kubernetes.io/instance=grafana" -o jsonpath="{.items[0].metadata.name}")

[root@minikube ~]# kubectl --namespace monitoring port-forward $POD_NAME 3000
Forwarding from 127.0.0.1:3000 -> 3000
Forwarding from [::1]:3000 -> 3000
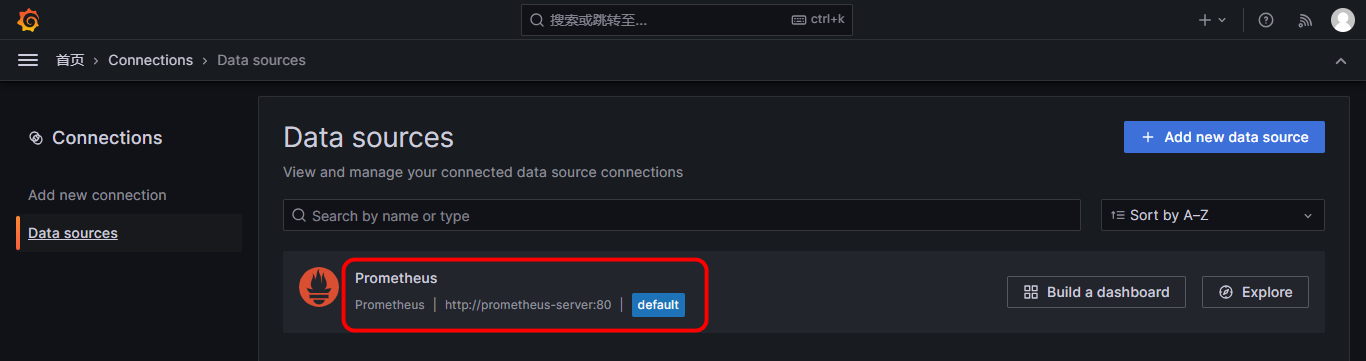
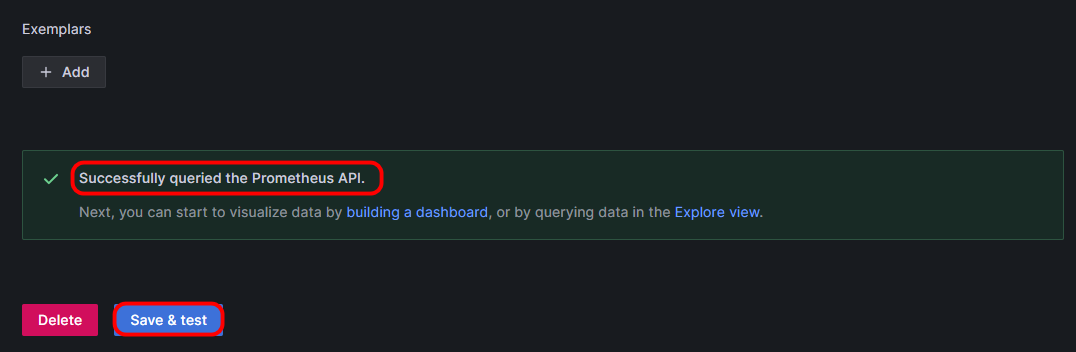
10. 设定Prometheus数据源
11. 导入Kubernetes Dashboard

12. 实验过程中的常见问题
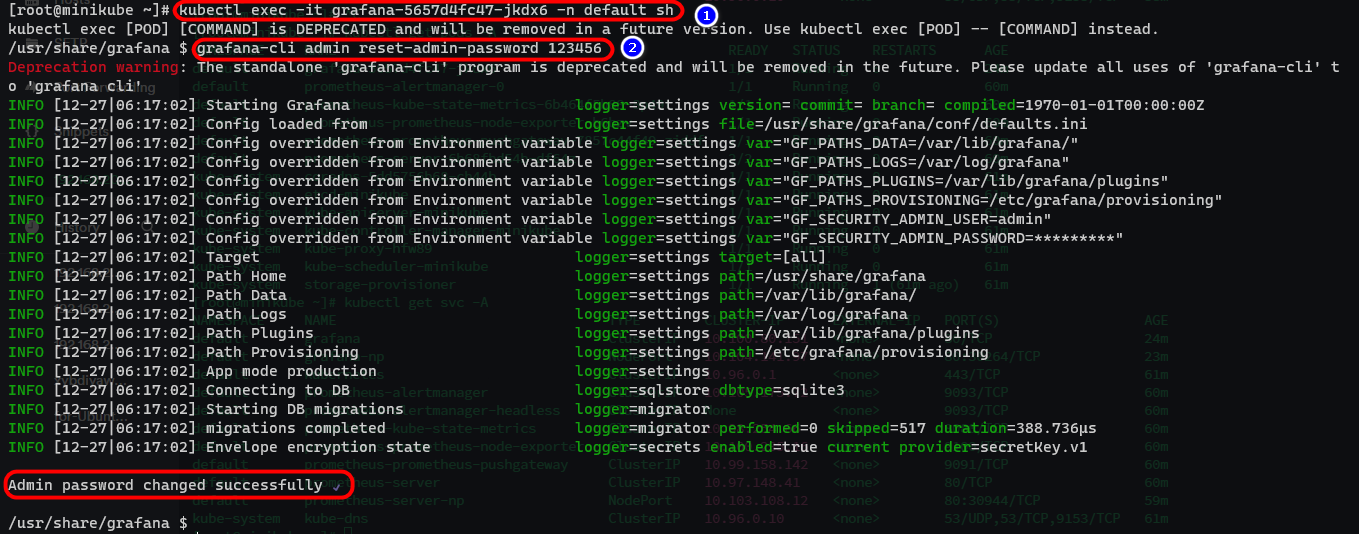
Grafana 忘记登陆密码 重置密码
[root@minikube ~]# kubectl get pods -A

[root@minikube ~]# kubectl exec -it grafana-5657d4fc47-jkdx6 -n default sh

/usr/share/grafana $ grafana-cli admin reset-admin-password 123456

Admin password changed successfully ✔
13. 参考链接
1️⃣https://blog.marcnuri.com/prometheus-grafana-setup-minikube
2️⃣Local MacのMinikubeでPrometheusとGrafana
3️⃣Minikube 安装和简单使用 - 江湖小小白 - 博客园 (cnblogs.com)
4️⃣grafana 忘记登陆密码 重置密码
5️⃣https://github.com/prometheus-operator/kube-prometheus#compatibility
6️⃣https://yuya-hirooka.hatenablog.com/entry/2021/03/30/202342
7️⃣minikube start | minikube