prometheus_0">一、安装prometheus
1.1 安装
prometheus官网下载地址
sudo -i
mkdir -p /opt/prometheus
#移动解压后的文件名到/opt/,并改名prometheus
mv prometheus-2.45 /opt/prometheus/
#创建一个专门的prometheus用户: -M 不创建家目录, -s 不让登录
useradd -M -s /usr/sbin/nologin prometheus

##更改prometheus用户的文件夹权限:
chown prometheus:prometheus -R /opt/prometheus
1.2 修改配置
global:
  scrape_interval: 30s # Set the scrape interval to every 15 seconds. Default is every 1 minute.
  evaluation_interval: 30s # Evaluate rules every 15 seconds. The default is every 1 minute.

# 其他全局配置...

scrape_configs:
  # Prometheus 自身的监控配置
  - job_name: "prometheus"
    static_configs:
      - targets: ["localhost:9070"]

  - job_name: 'node_widgets'
    scheme: https  # 使用 HTTPS
    tls_config:
      insecure_skip_verify: true  # 忽略证书验证
    static_configs:
      - targets: ['xxxxx.xxx.com:443']  # 替换为您的服务器 B 地址和端口
    metrics_path: '/prometheus/metrics'  # Node Exporter 的路径
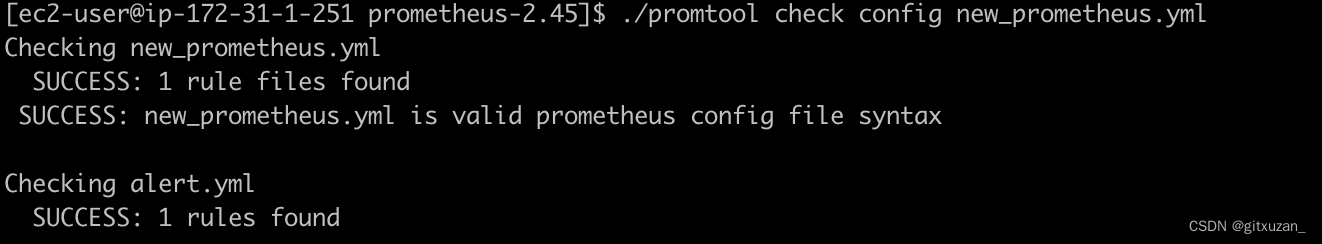
如果修改了配置可以验证配置
./promtool check config new_prometheus.yml
热更新
curl -X POST http://localhost:9070/-/reload
1.3 配置自启动
vim /etc/systemd/system/prometheus.service
写入数据
[Unit]
Description=Prometheus Server
After=network-online.target
[Service]
Type=simple
User=prometheus
Group=prometheus
Restart=on-failure
WorkingDirectory=/opt/prometheus/prometheus-2.45
ExecStart=/opt/prometheus/prometheus-2.45/prometheus --web.listen-address ":9070" --config.file /opt/prometheus/prometheus-2.45/new_prometheus.yml --storage.tsdb.path /opt/prometheus/prometheus-2.45/data --storage.tsdb.retention.time=20d --web.enable-lifecycle
[Install]
WantedBy=multi-user.target
开机自启动
sudo systemctl daemon-reload
sudo systemctl enable prometheus
sudo systemctl restart prometheus
sudo systemctl status prometheus
二、安装node_exporter
2.1 官网下载地址 prometheus.io/download/" rel="nofollow">https://prometheus.io/download/
2.2 开机自启动
添加
sudo vim /etc/systemd/system/node_exproter.service
[Unit]
Description=node_exporter
Documentation=https://prometheus.io/
After=network.target
[Service]
User=ubuntu
Group=ubuntu
ExecStart=/opt/prometheus/node_exproter-1.7.0/node_exporter --web.listen-address=":9101"
Restart=on-failure
[Install]
WantedBy=multi-user.target
sudo systemctl daemon-reload
sudo systemctl enable node_exproter
sudo systemctl restart node_exproter
sudo systemctl status node_exproter
grafana_104">三、安装grafana
3.1 官网下载地址 grafana.com/grafana/download?edition=oss&platform=linux" rel="nofollow">https://grafana.com/grafana/download?edition=oss&platform=linux
3.2 添加开机启动
添加service
sudo vim /etc/systemd/system/grafana.service
[Unit]
Description=Grafana server
Documentation=http://docs.grafana.org
[Service]
Type=simple
User=prometheus
Group=prometheus
Restart=on-failure
ExecStart=/opt/prometheus/grafana-v10.2.2/bin/grafana-server \
  --config=/opt/prometheus/grafana-v10.2.2/conf/grafana.ini \
  --homepath=/opt/prometheus/grafana-v10.2.2 \
  --http-port=3000
[Install]
WantedBy=multi-user.target
grafanainit__132">3.2 修改 grafana.init 邮箱配置
[smtp]
enabled = true
host = smtp.gmail.com:587
user = xuzan@lippu.ltd
# If the password contains # or ; you have to wrap it with triple quotes. Ex """#password;"""
password = 授权码
cert_file =
key_file =
skip_verify = true
from_address = xuzan@lippu.ltd
from_name = Grafana
ehlo_identity =
startTLS_policy =
sudo systemctl daemon-reload
sudo systemctl enable grafana
sudo systemctl restart grafana
sudo systemctl status grafana
四、alertmanager 安装
4.1 安装官网地址 prometheus.io/download/" rel="nofollow">https://prometheus.io/download/
4.2 新增启动项
编辑
sudo vim /etc/systemd/system/alertmanager.service
[Unit]
Description=Alert Manager
Wants=network-online.target
After=network-online.target

[Service]
Type=simple
User=prometheus
Group=prometheus
ExecStart=/opt/prometheus/alertmanager-0.26.0/alertmanager \
  --config.file=/opt/prometheus/alertmanager-0.26.0/alertmanager.yml \
  --storage.path=/opt/prometheus/alertmanager-0.26.0/data \
  --web.listen-address=:9071 \
  --cluster.listen-address=:9072

Restart=always

[Install]
WantedBy=multi-user.target
sudo systemctl daemon-reload
sudo systemctl enable alertmanager
sudo systemctl restart alertmanager
sudo systemctl status alertmanager -l
prometheus__new_prometheusyml_197">4.3 使用了prometheus 需要修改 new_prometheus.yml
新增
# Alertmanager configuration
alerting:
  alertmanagers:
    - static_configs:
        - targets:
            - alertmanager:9071

# Load rules once and periodically evaluate them according to the global 'evaluation_interval'.
rule_files:
  - "alert.yml"
在项目更目录下新增 新增alert.yml
groups:
- name: Prometheus alert
  rules:
  # 对任何实例超过30s无法联系的情况发出警报
  - alert: 服务告警
    expr: up == 0
    for: 30s
    labels:
      severity: critical
    annotations:
      instance: "{{ $labels.instance }}"
      description: "{{ $labels.job }} 服务已关闭"
具体告警规则:

alert: 这是告警的名称,在这个例子中命名为 "服务告警"。
expr: 这是触发告警的表达式。在这个例子中,表达式 up == 0 检查 up 指标是否等于 0。up 指标是 Prometheus 用来表示目标实例可达性的标准指标,其中 0 表示不可达,1 表示可达。
for: 这个条件指定了在触发告警之前必须满足告警条件的持续时间。在这里设置为 30s,意味着只有当 up 指标持续为 0 超过 30 秒时,才会触发告警。
labels: 这部分定义了附加到告警上的标签。在这个例子中,它设置了一个严重性标签(severity: critical),表示这是一个严重的告警。
annotations:
这部分提供了关于告警的更多信息,通常用于在告警通知中显示。在这个例子中,它包括两个注解:
instance: "{{ $labels.instance }}":这将显示触发告警的实例。
description: "{{ $labels.job }} 服务已关闭":这提供了一个描述性的消息,指出哪个服务(job)已经关闭。
4.4 验证配置
./promtool check config new_prometheus.yml
重新热加载配置
curl -X POST http://localhost:9070/-/reload
grafana__255">五、grafana 添加数据源
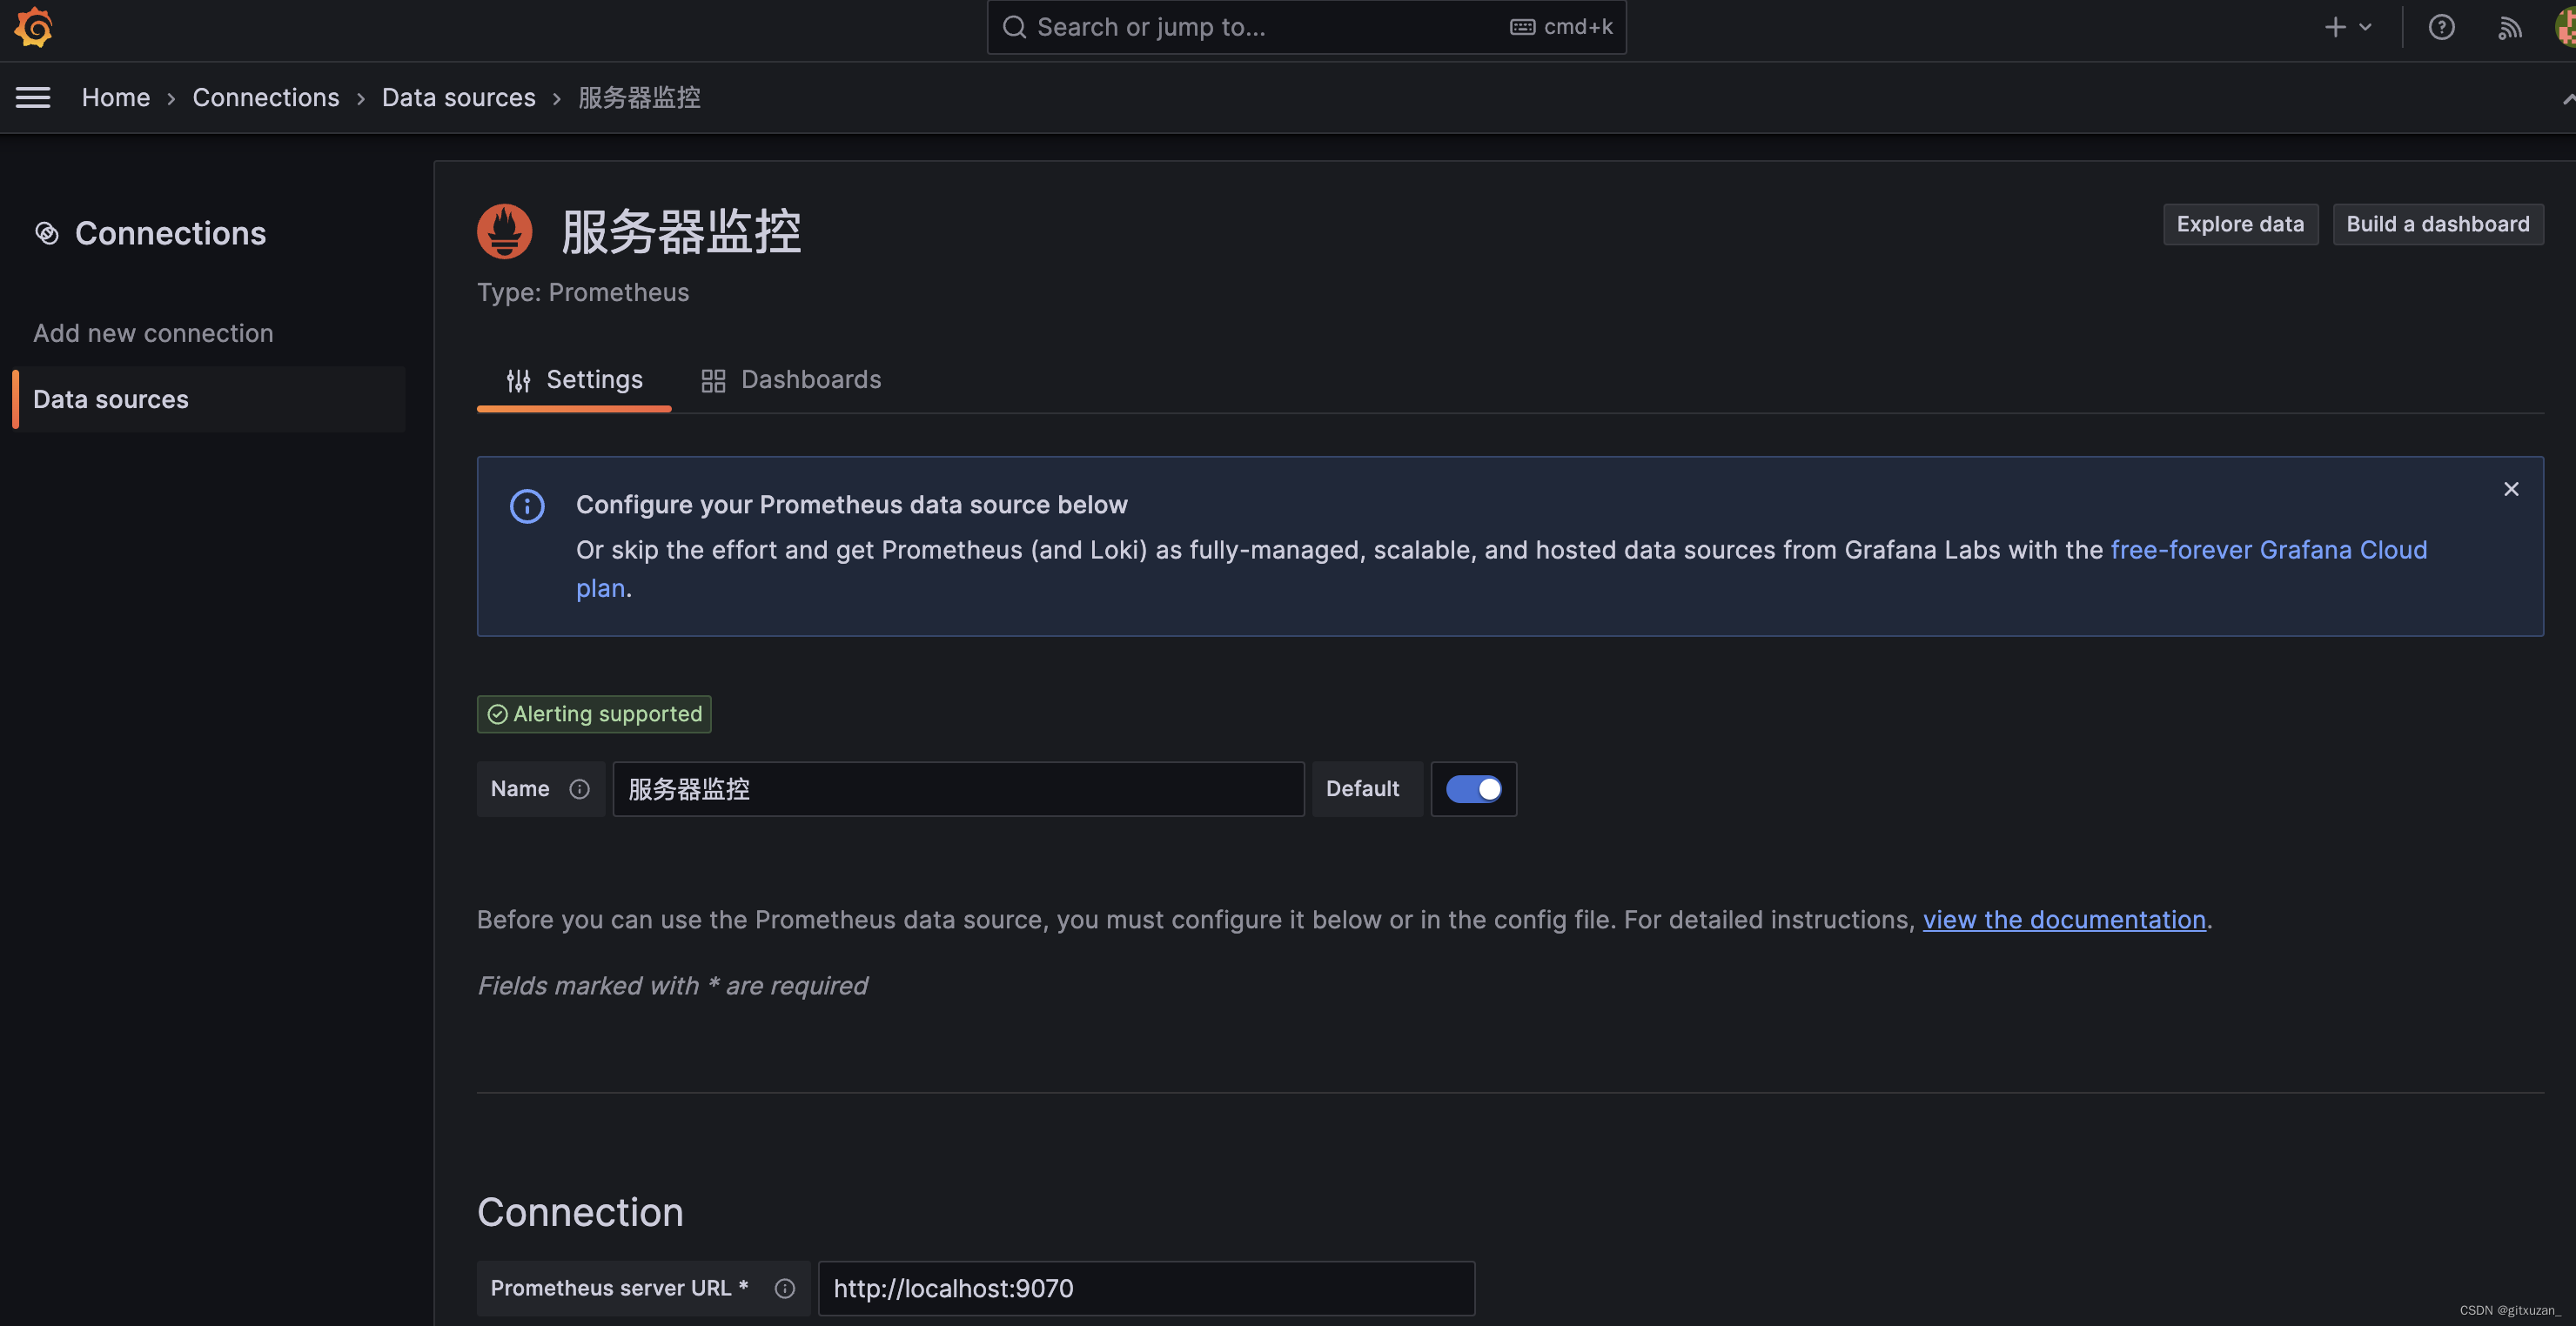
5.1 添加数据来源
这里填写prometheus 的数据源地址,因为grafana 和 prometheus 放到一台服务器上了,所以我填写的是localhost
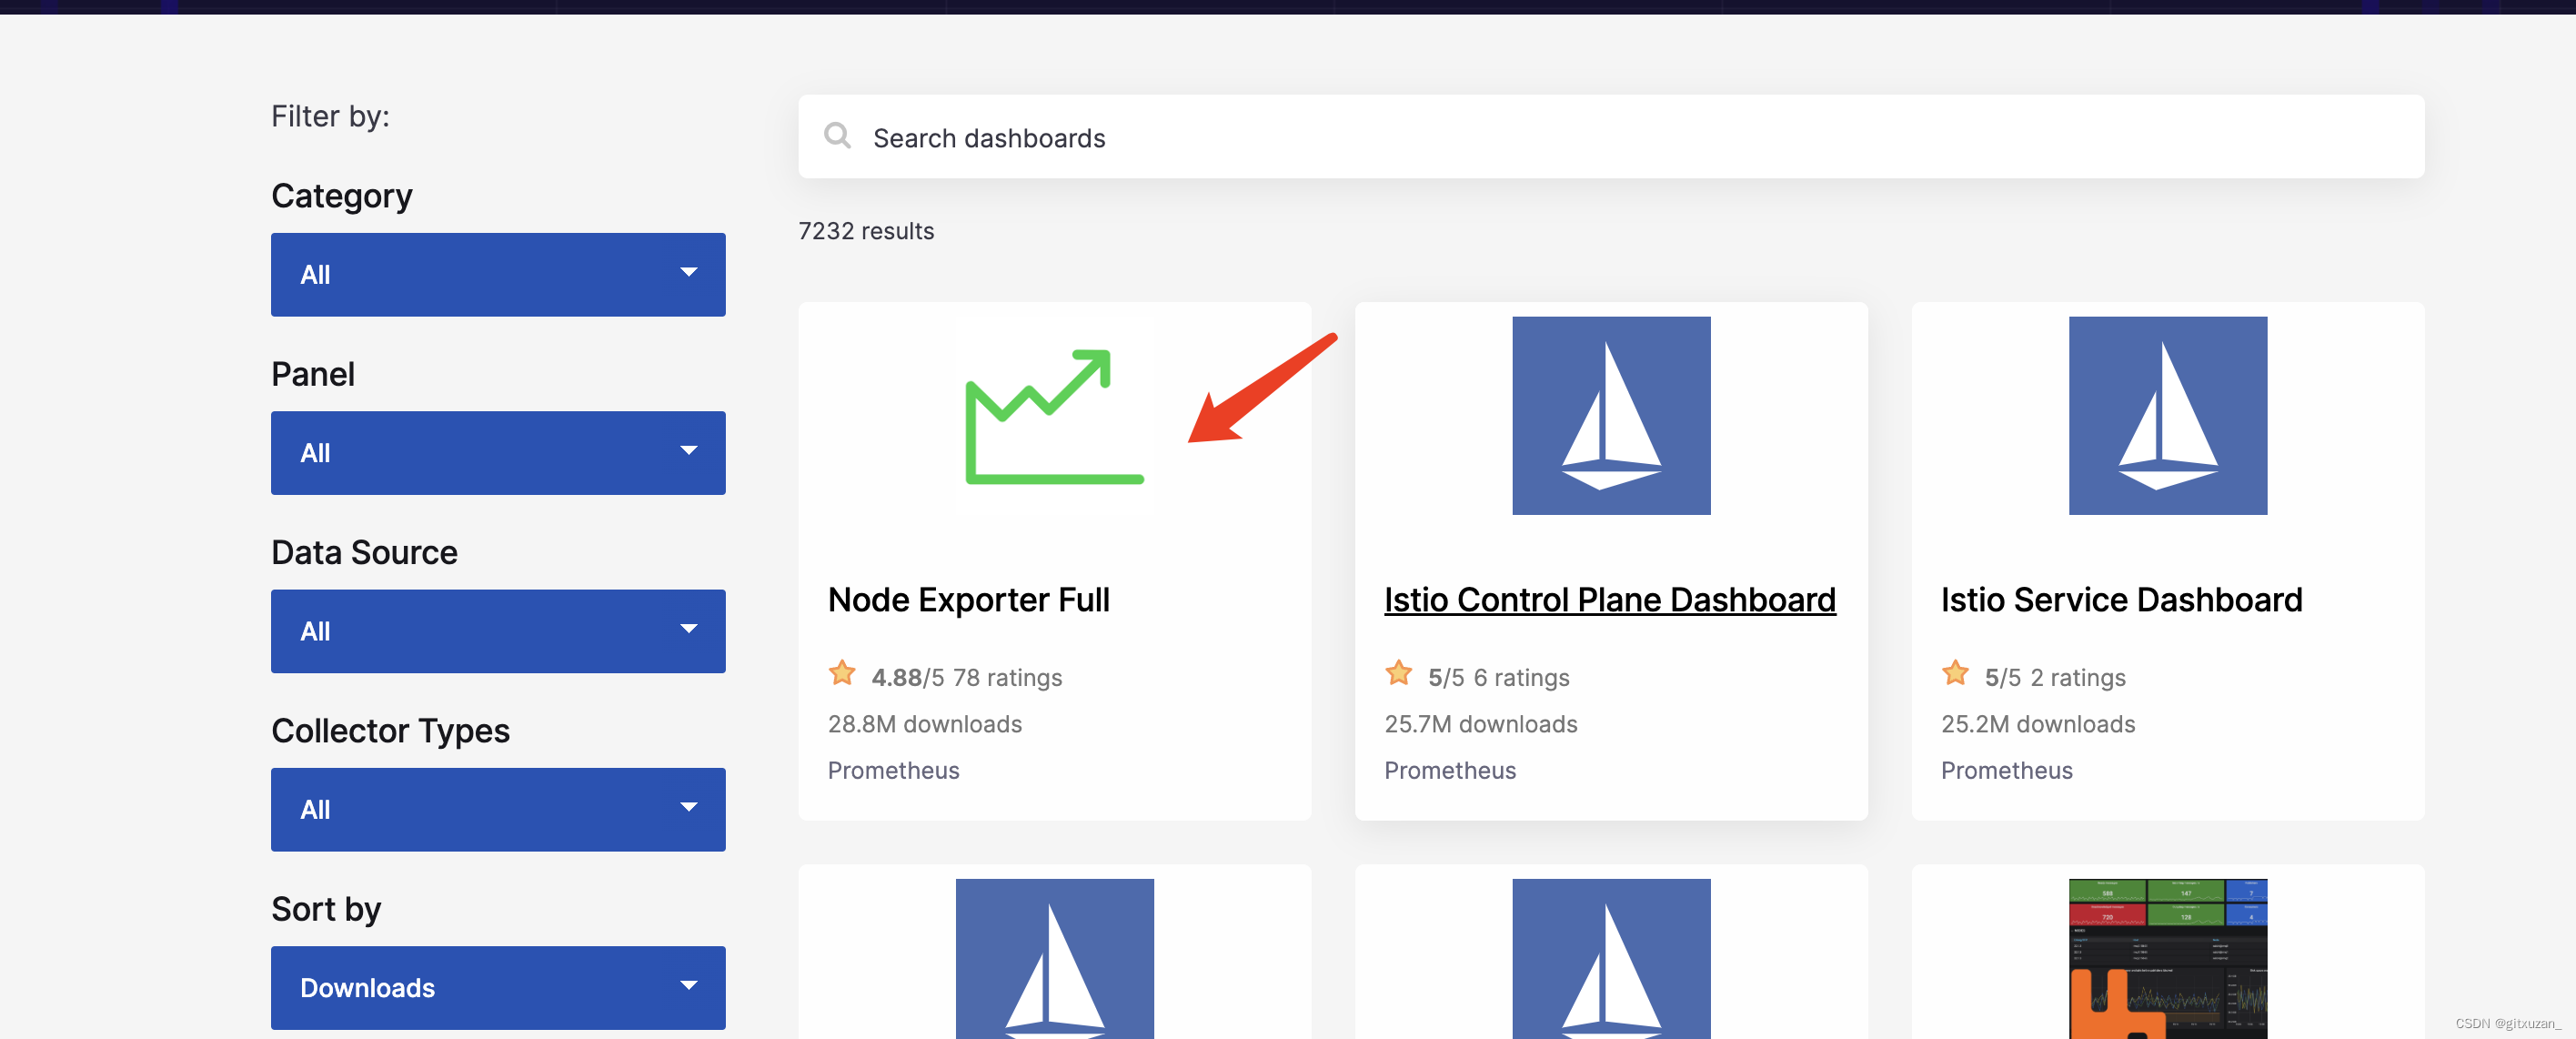
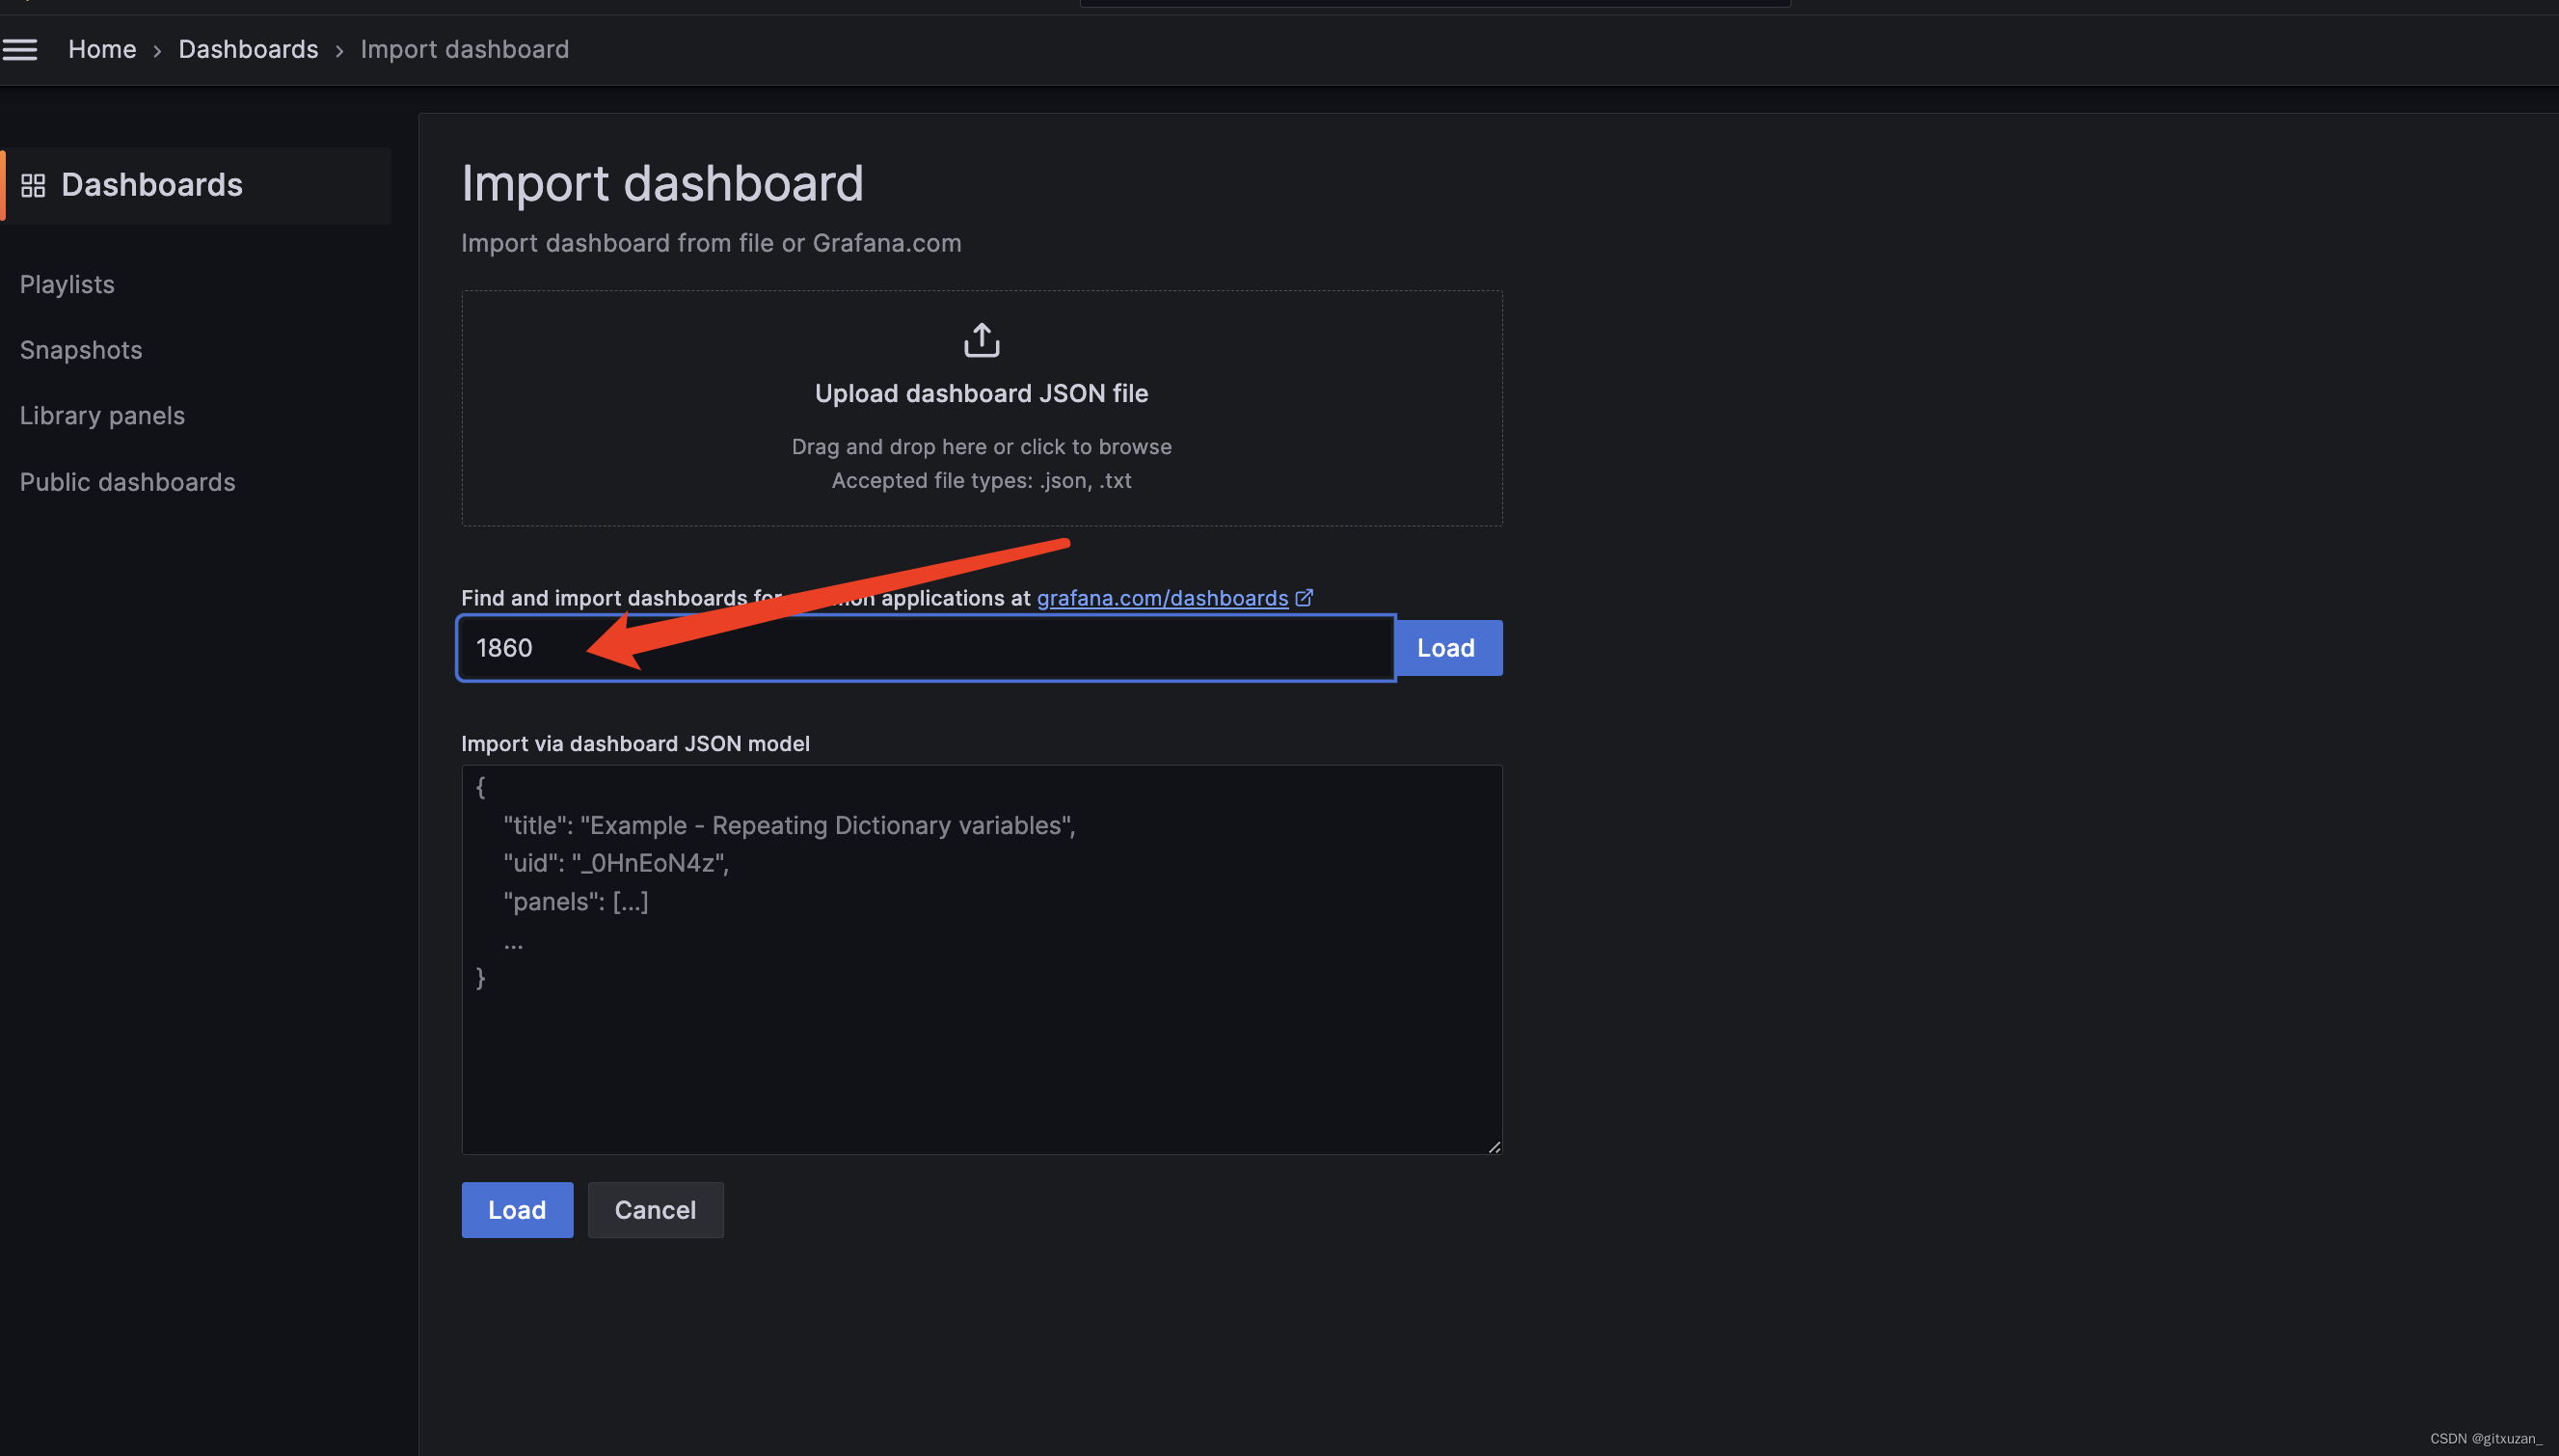
5.2 添加dashboards,添加地址: grafana.com/grafana/dashboards/" rel="nofollow">https://grafana.com/grafana/dashboards/
选择一个dashborads
copy dashborads 的ID
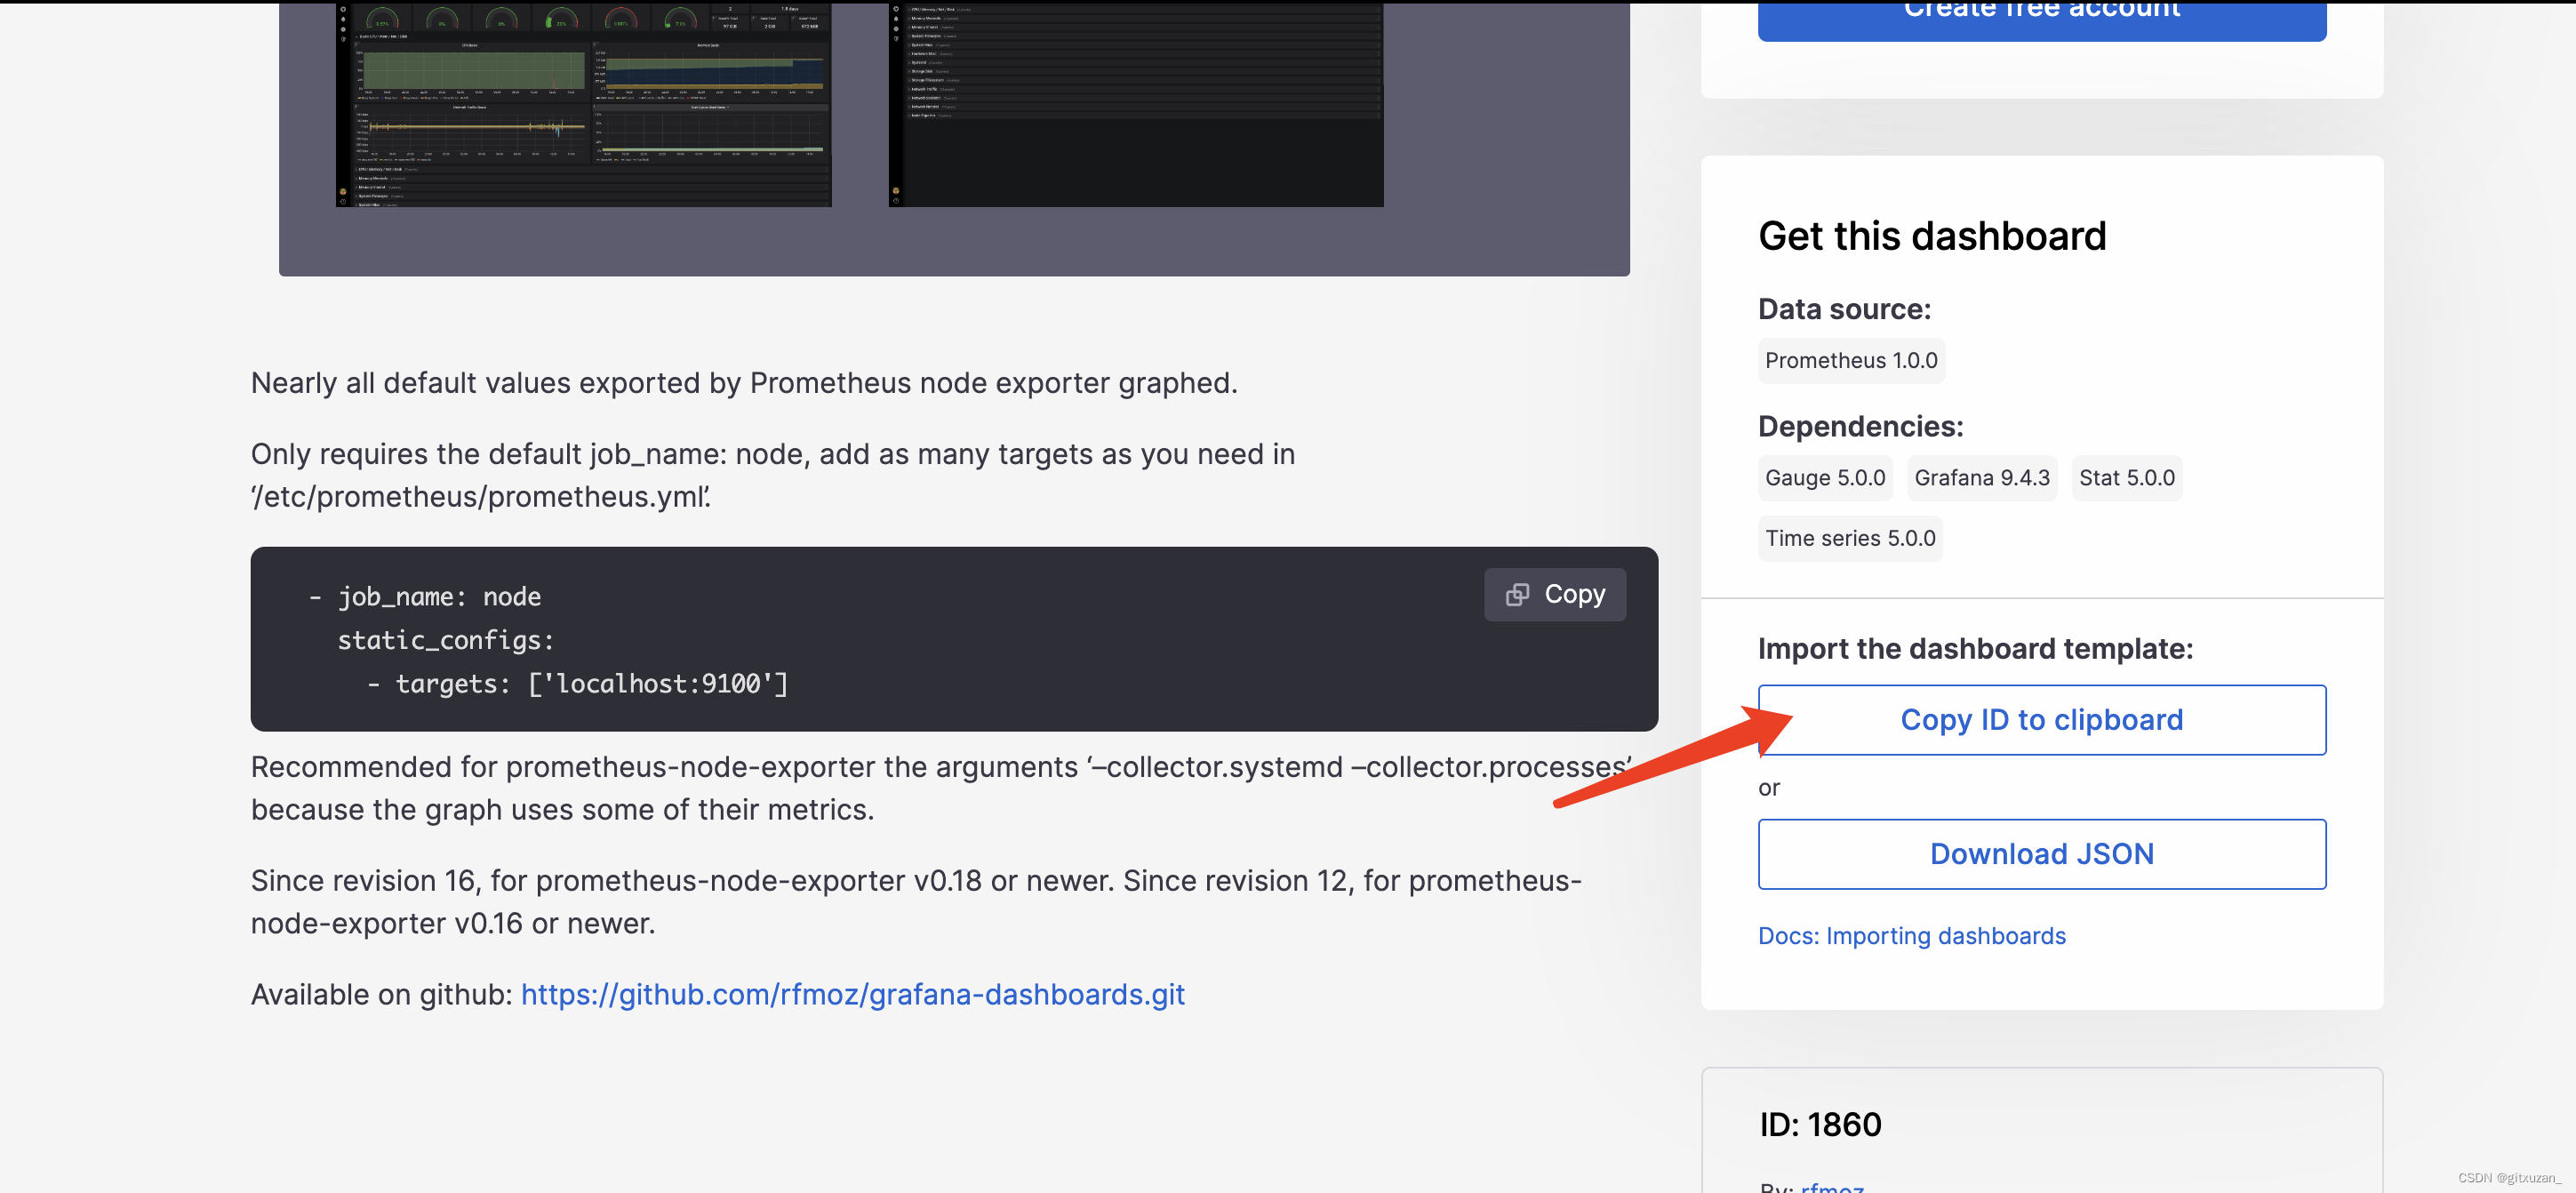
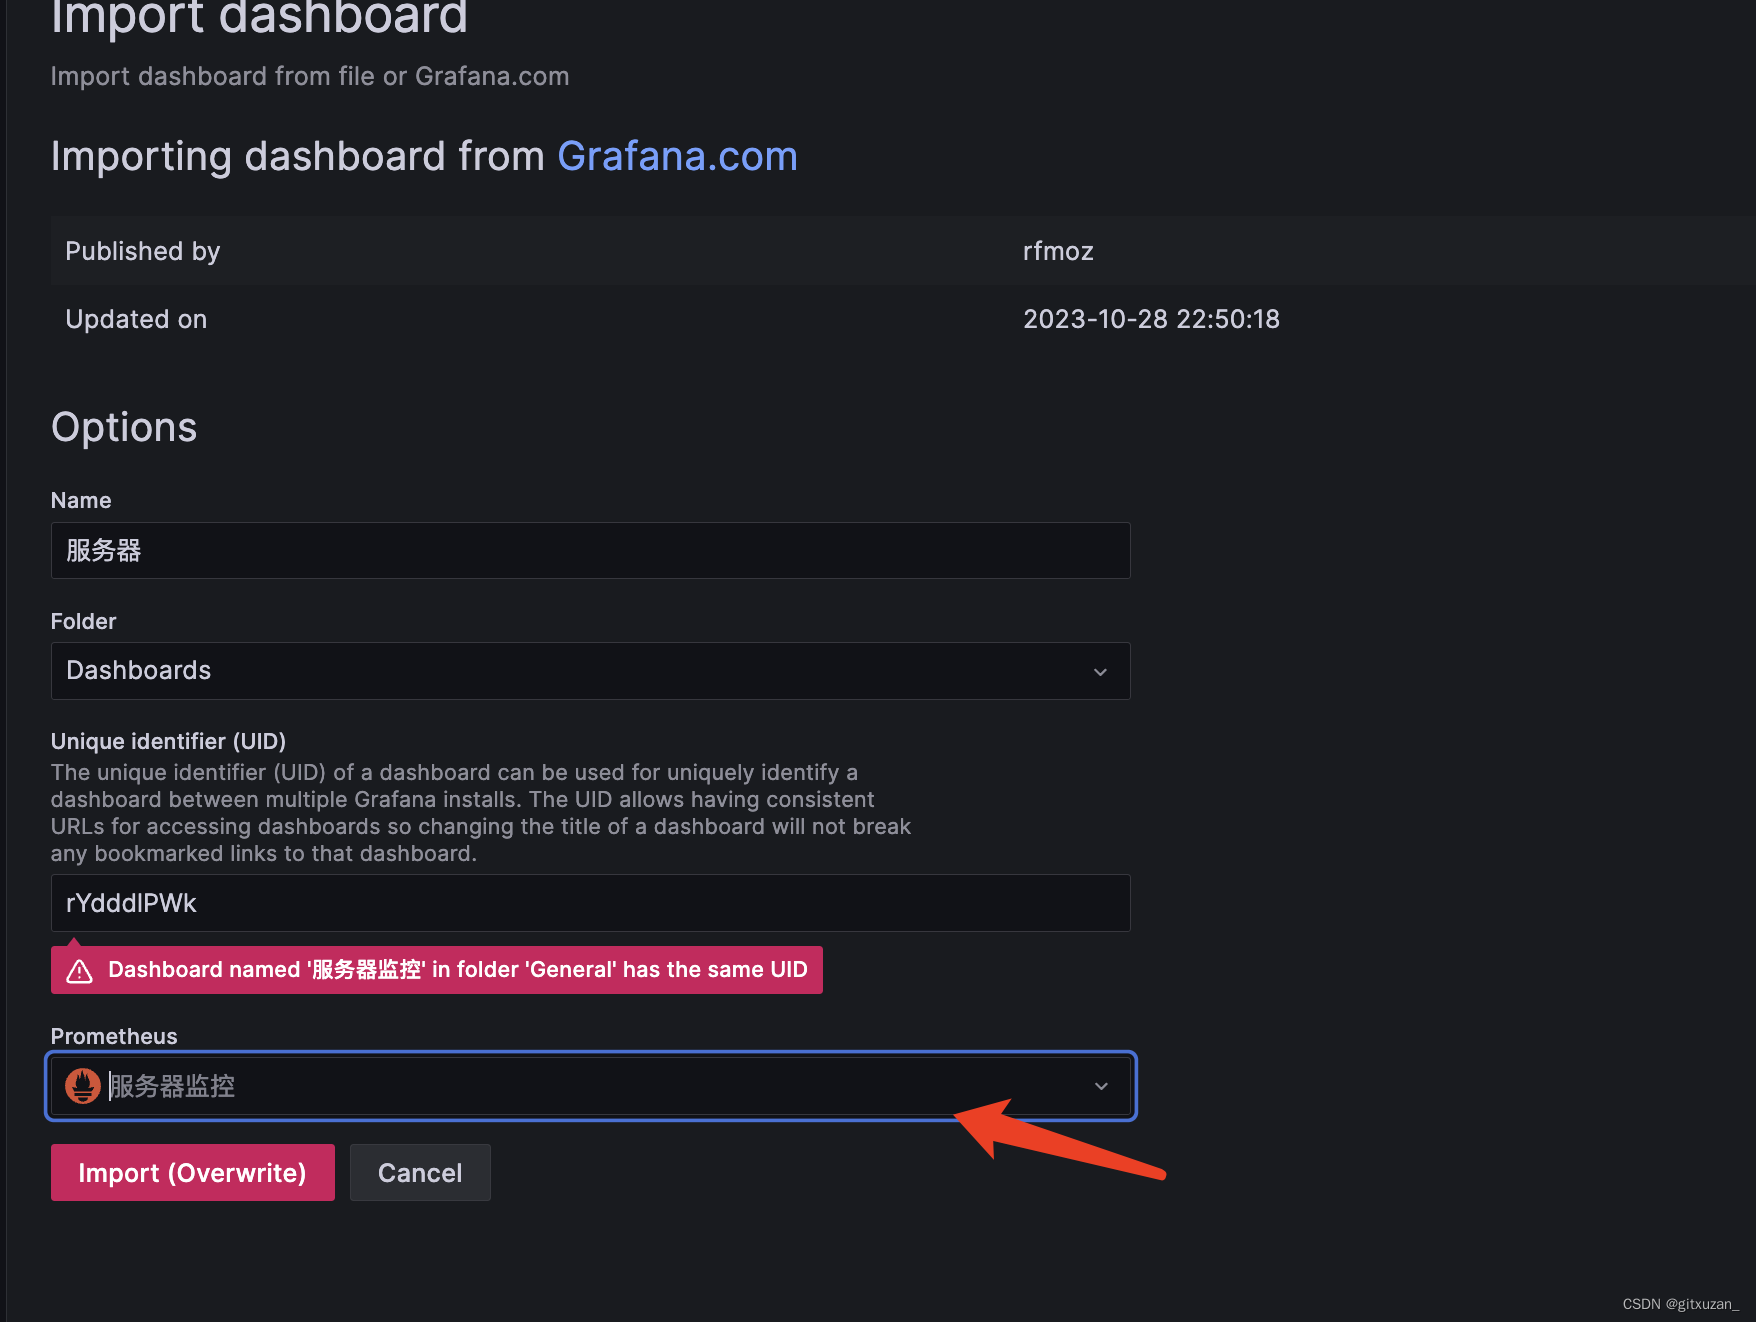
在grafana 界面导入dashborad ,可以通过ID导入
最后选择刚刚的数据源
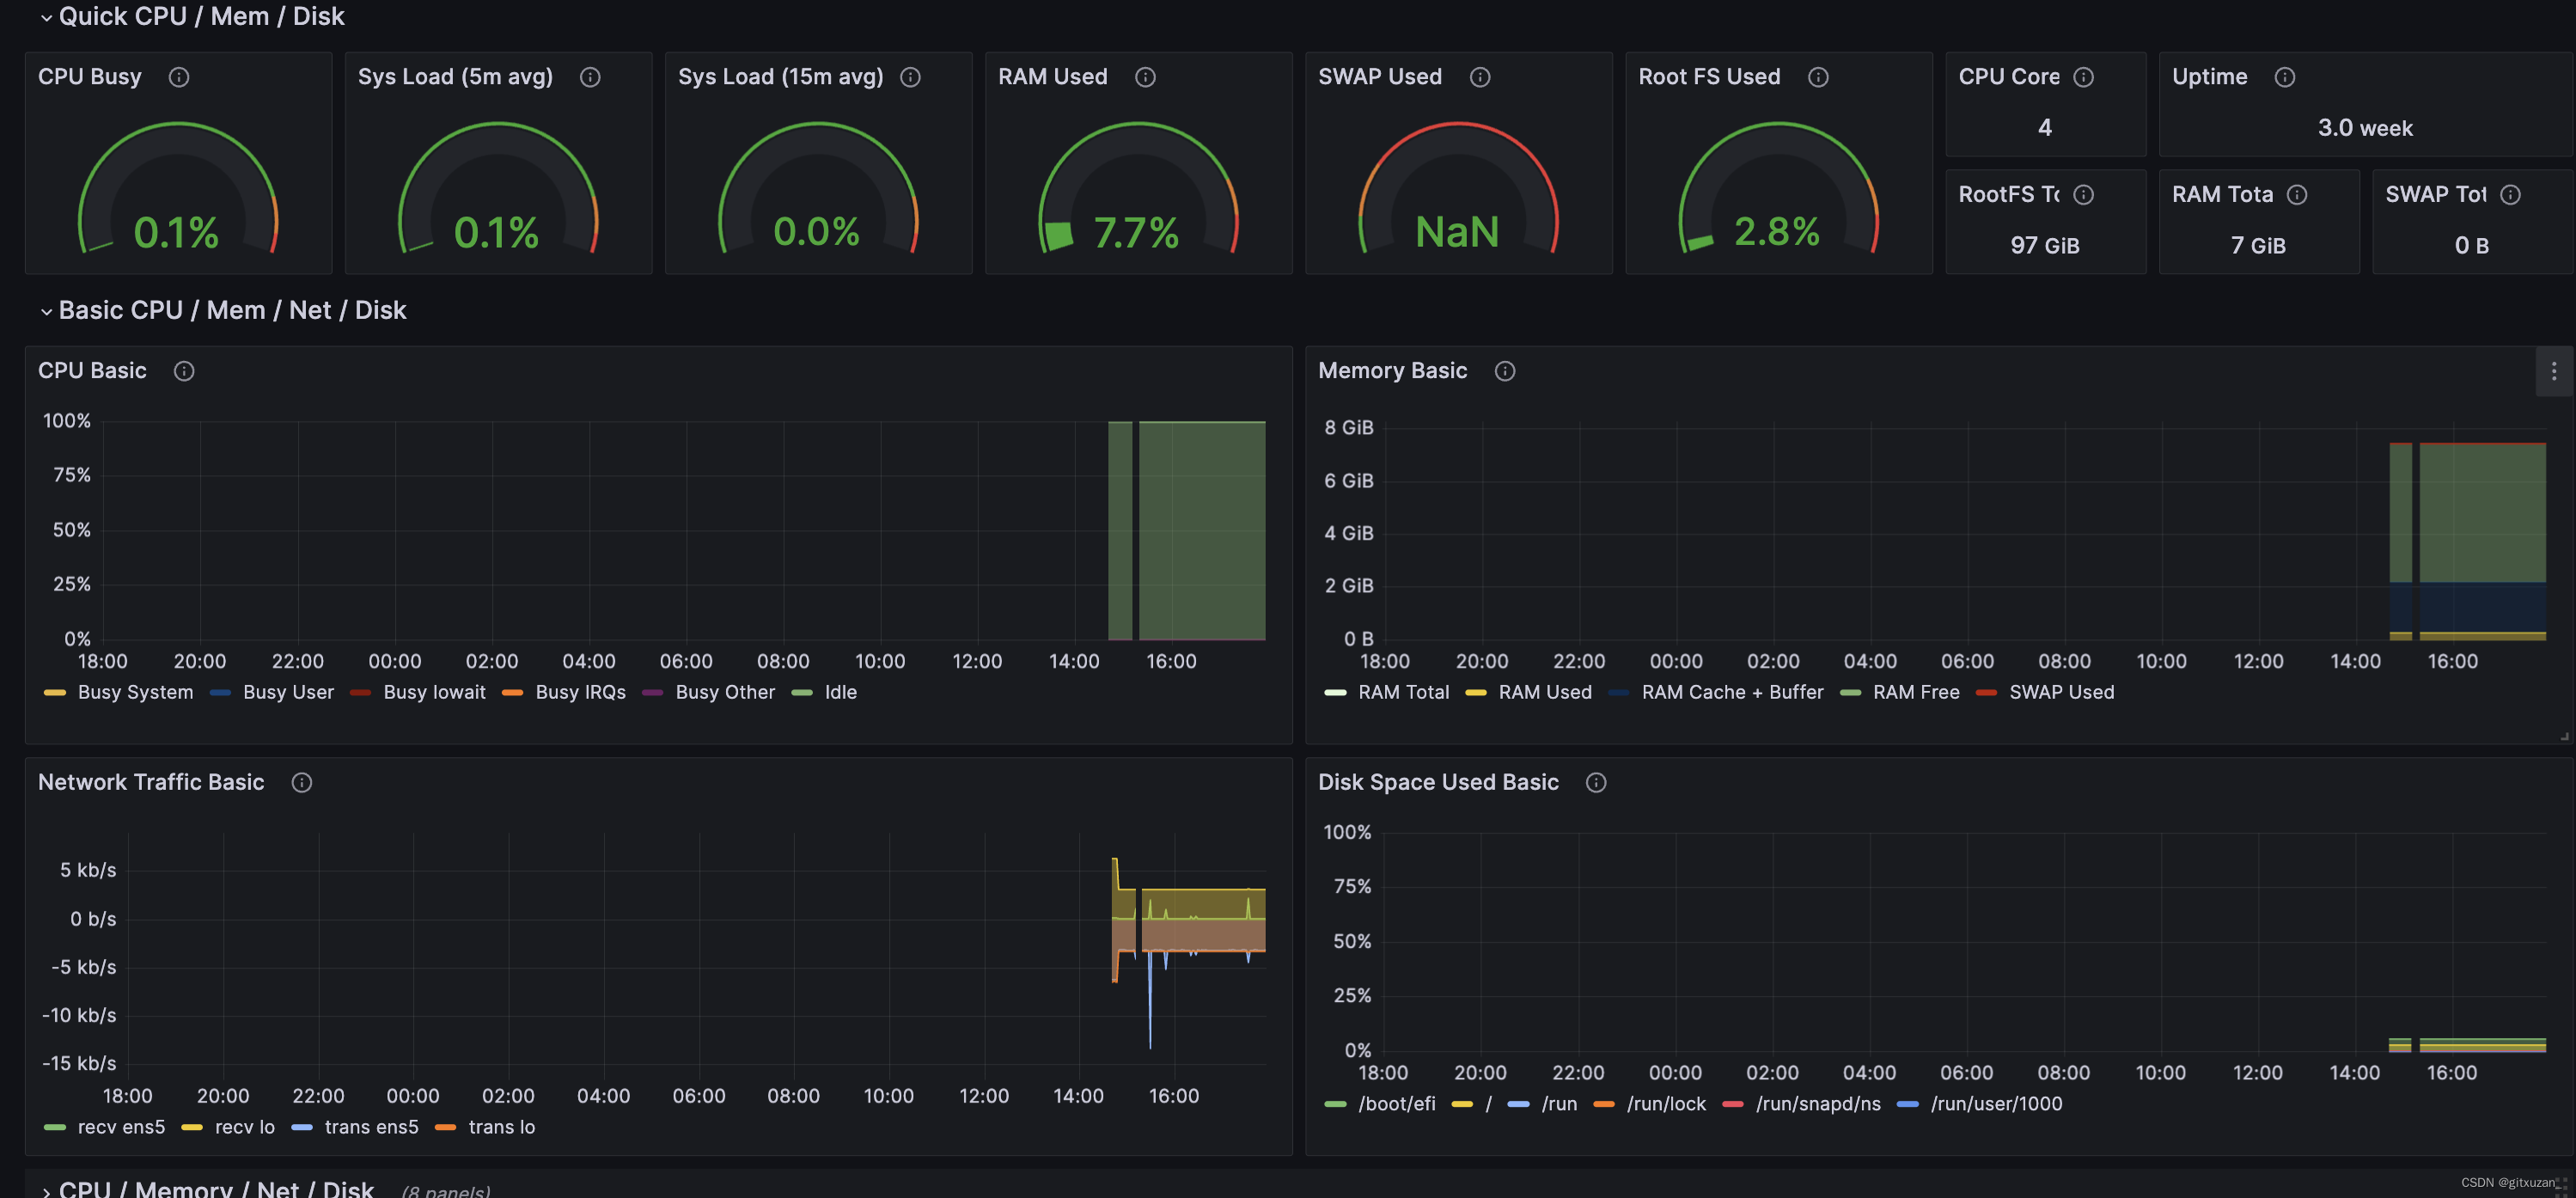
最终显示
六、配置gmail告警
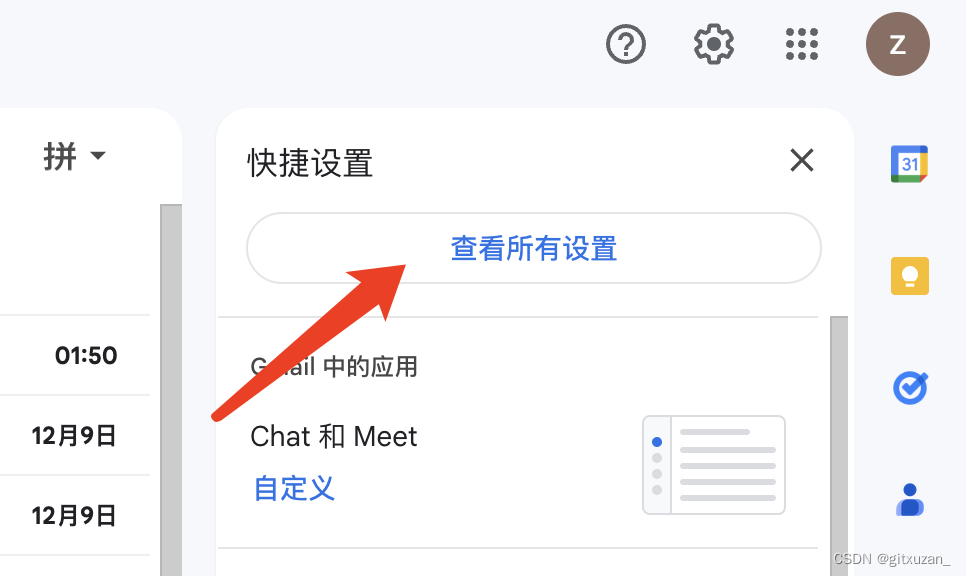
6.1 打开gmail 配置

点击查看所有配置
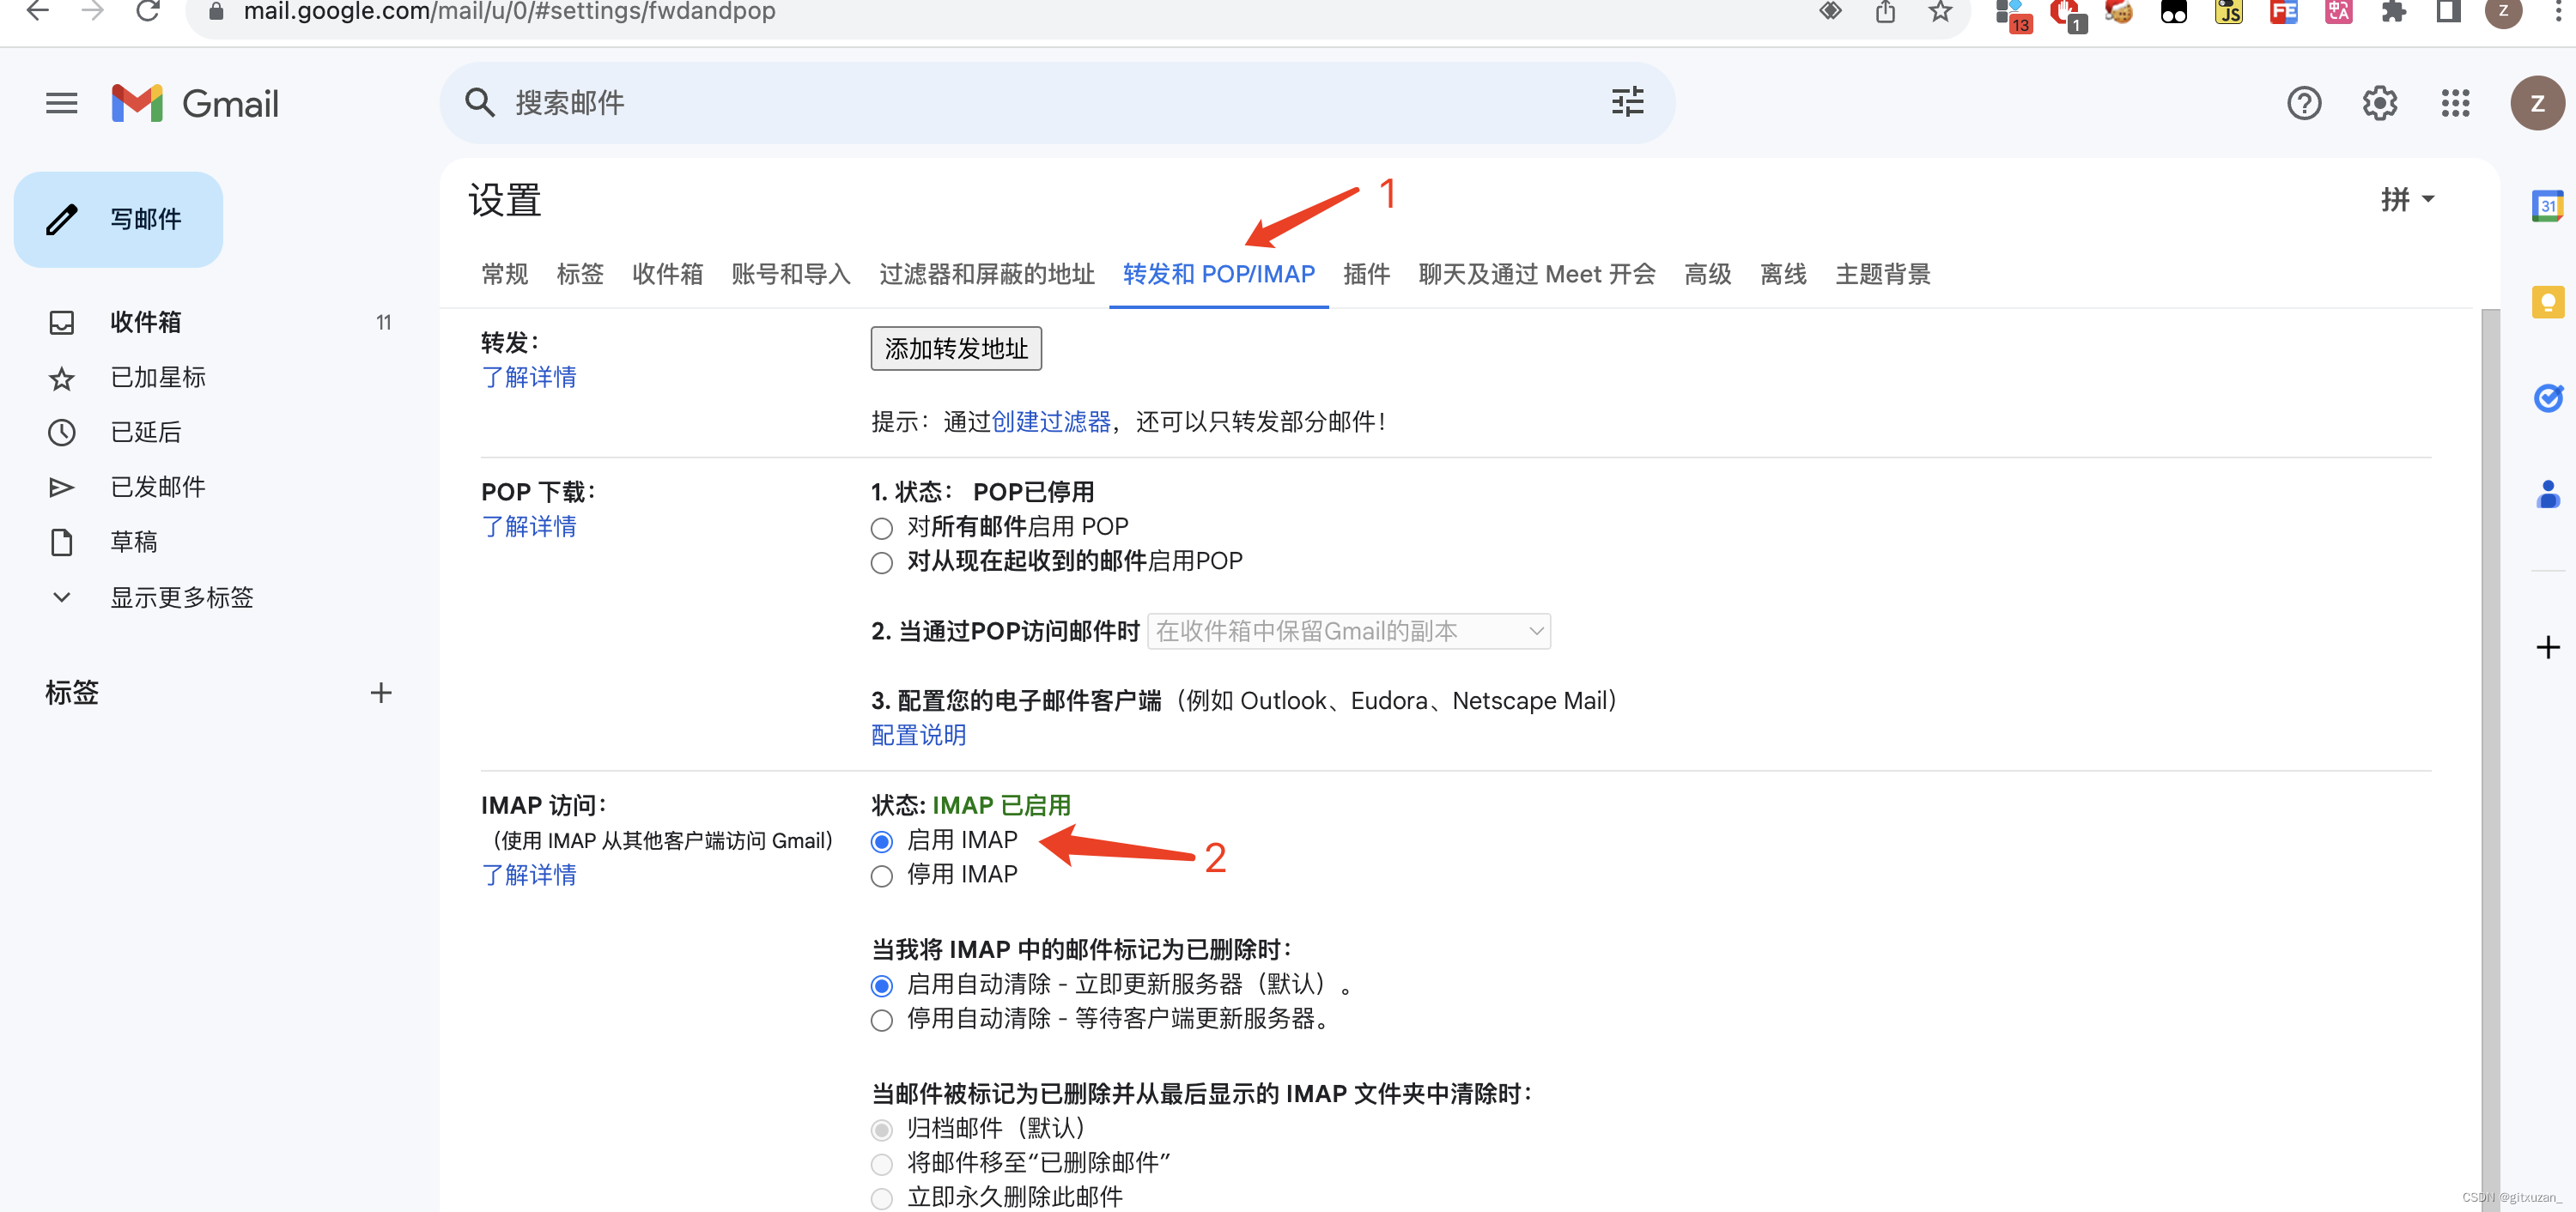
最后保存
6.2 还需要打开二次验证生成授权码
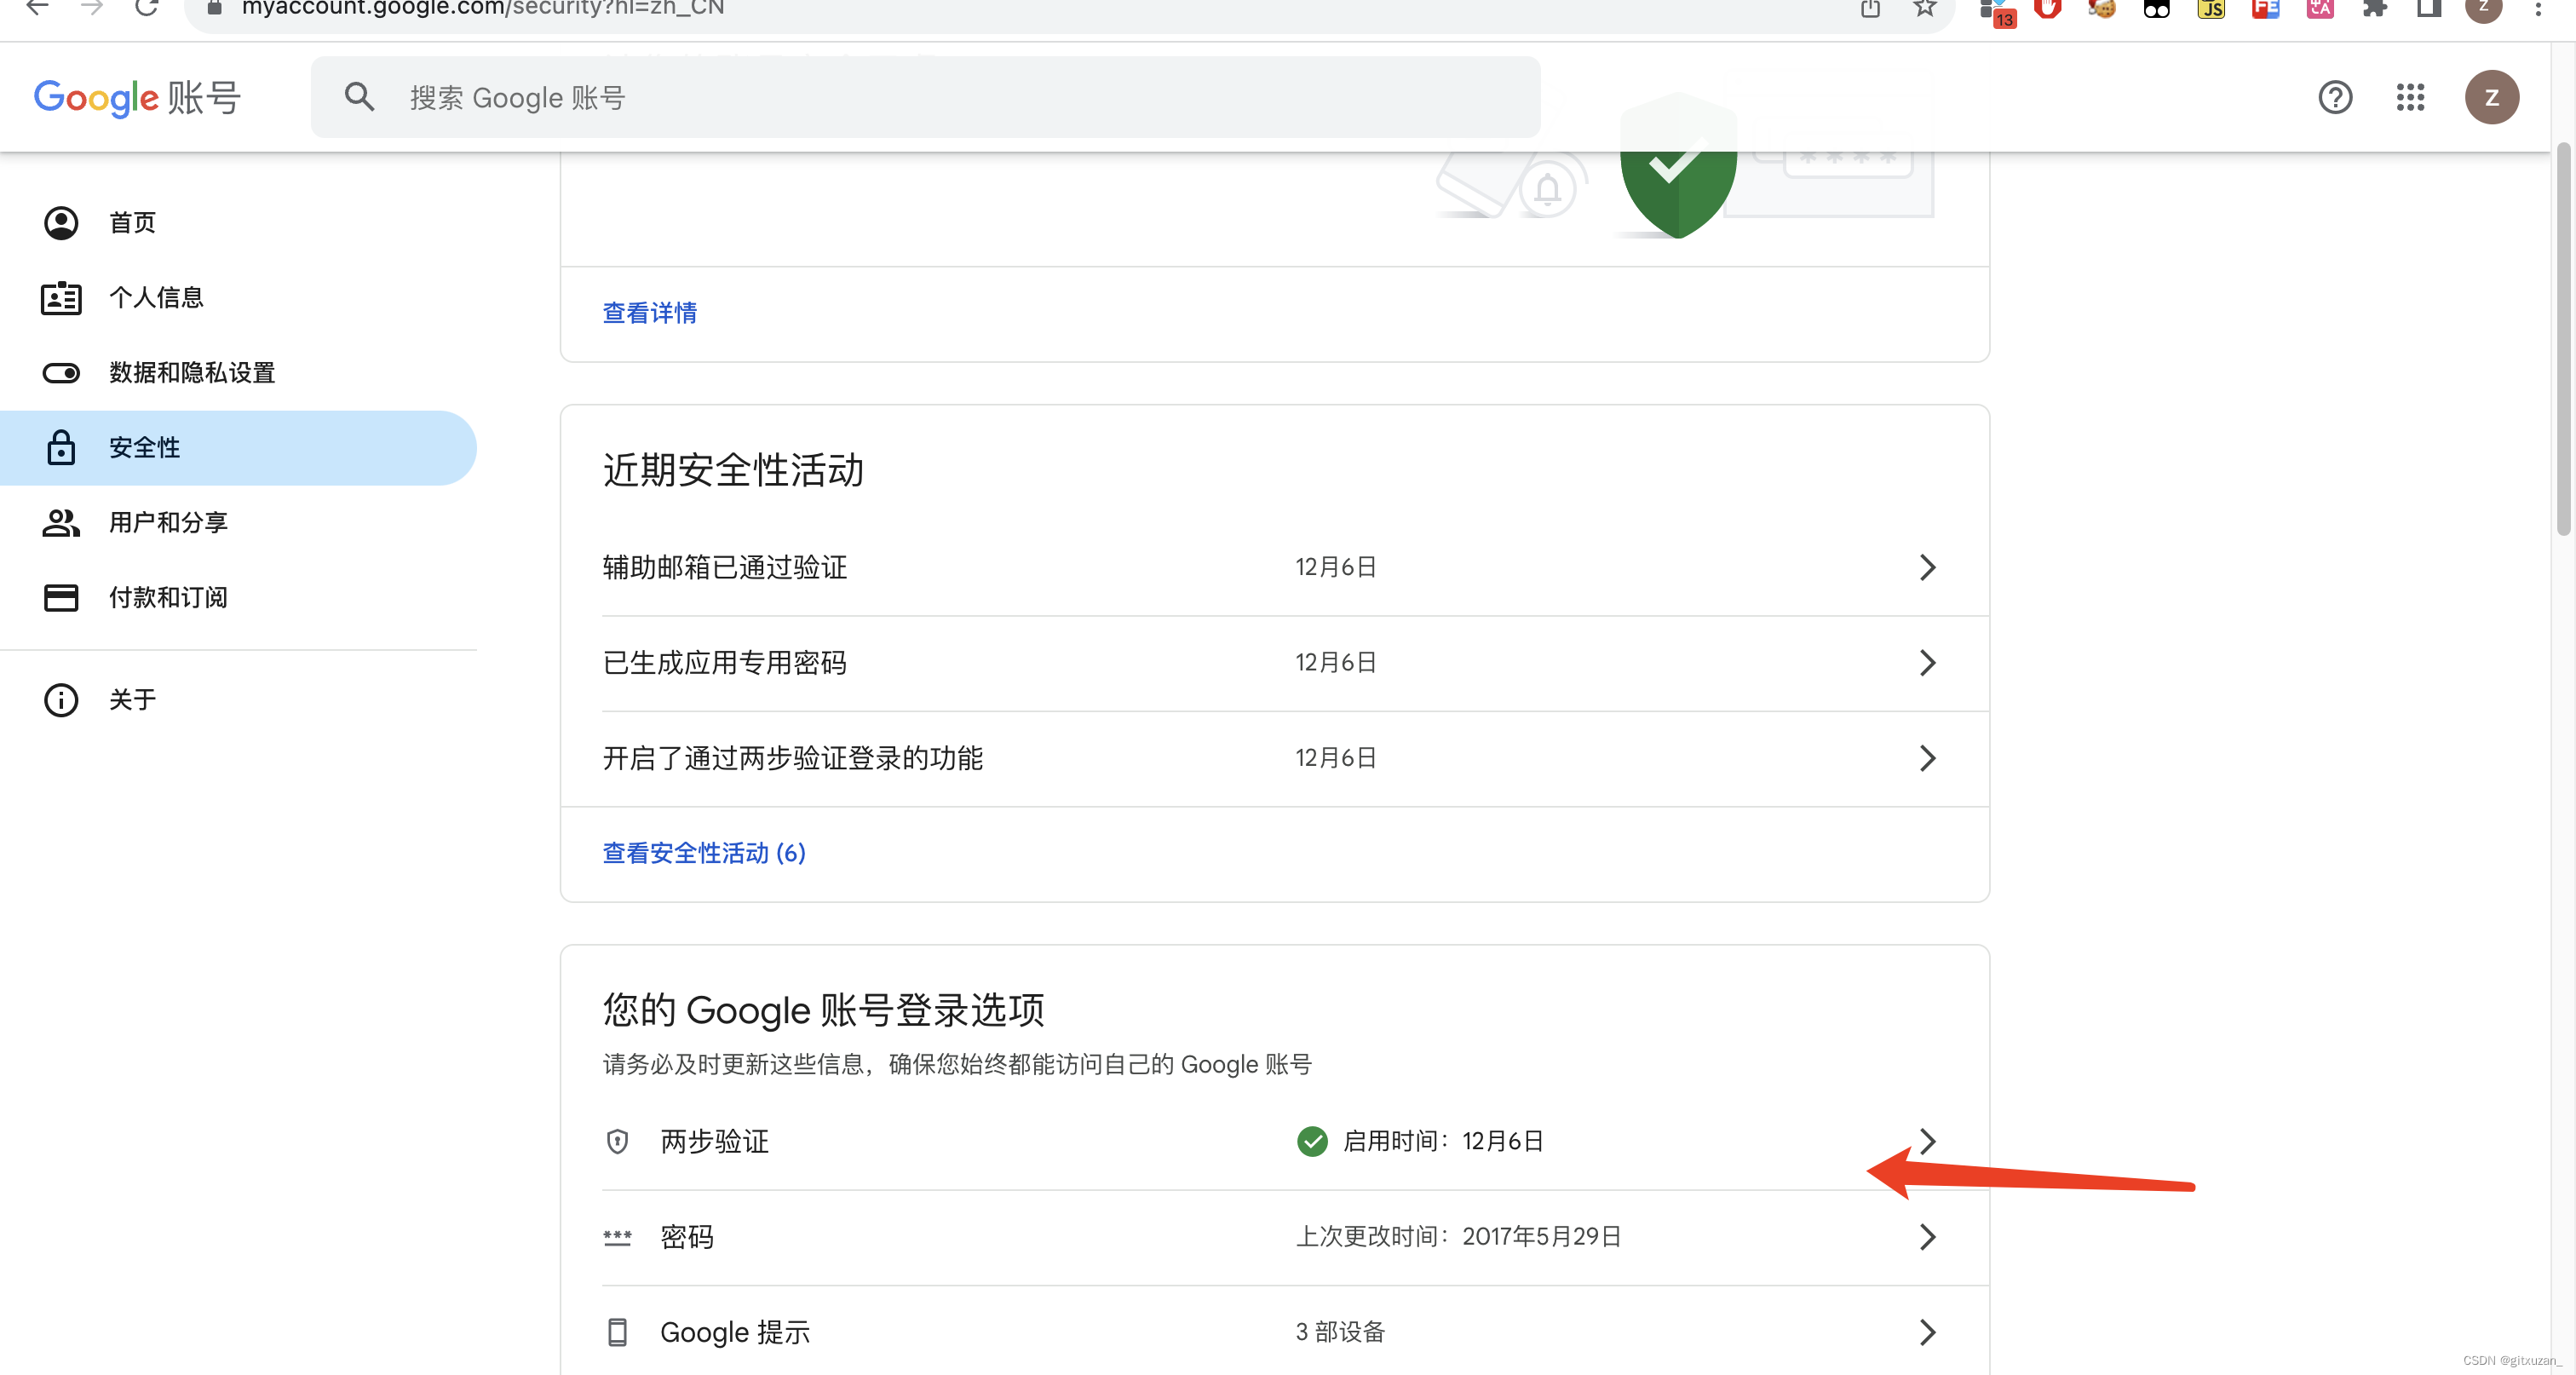
打开专用密码
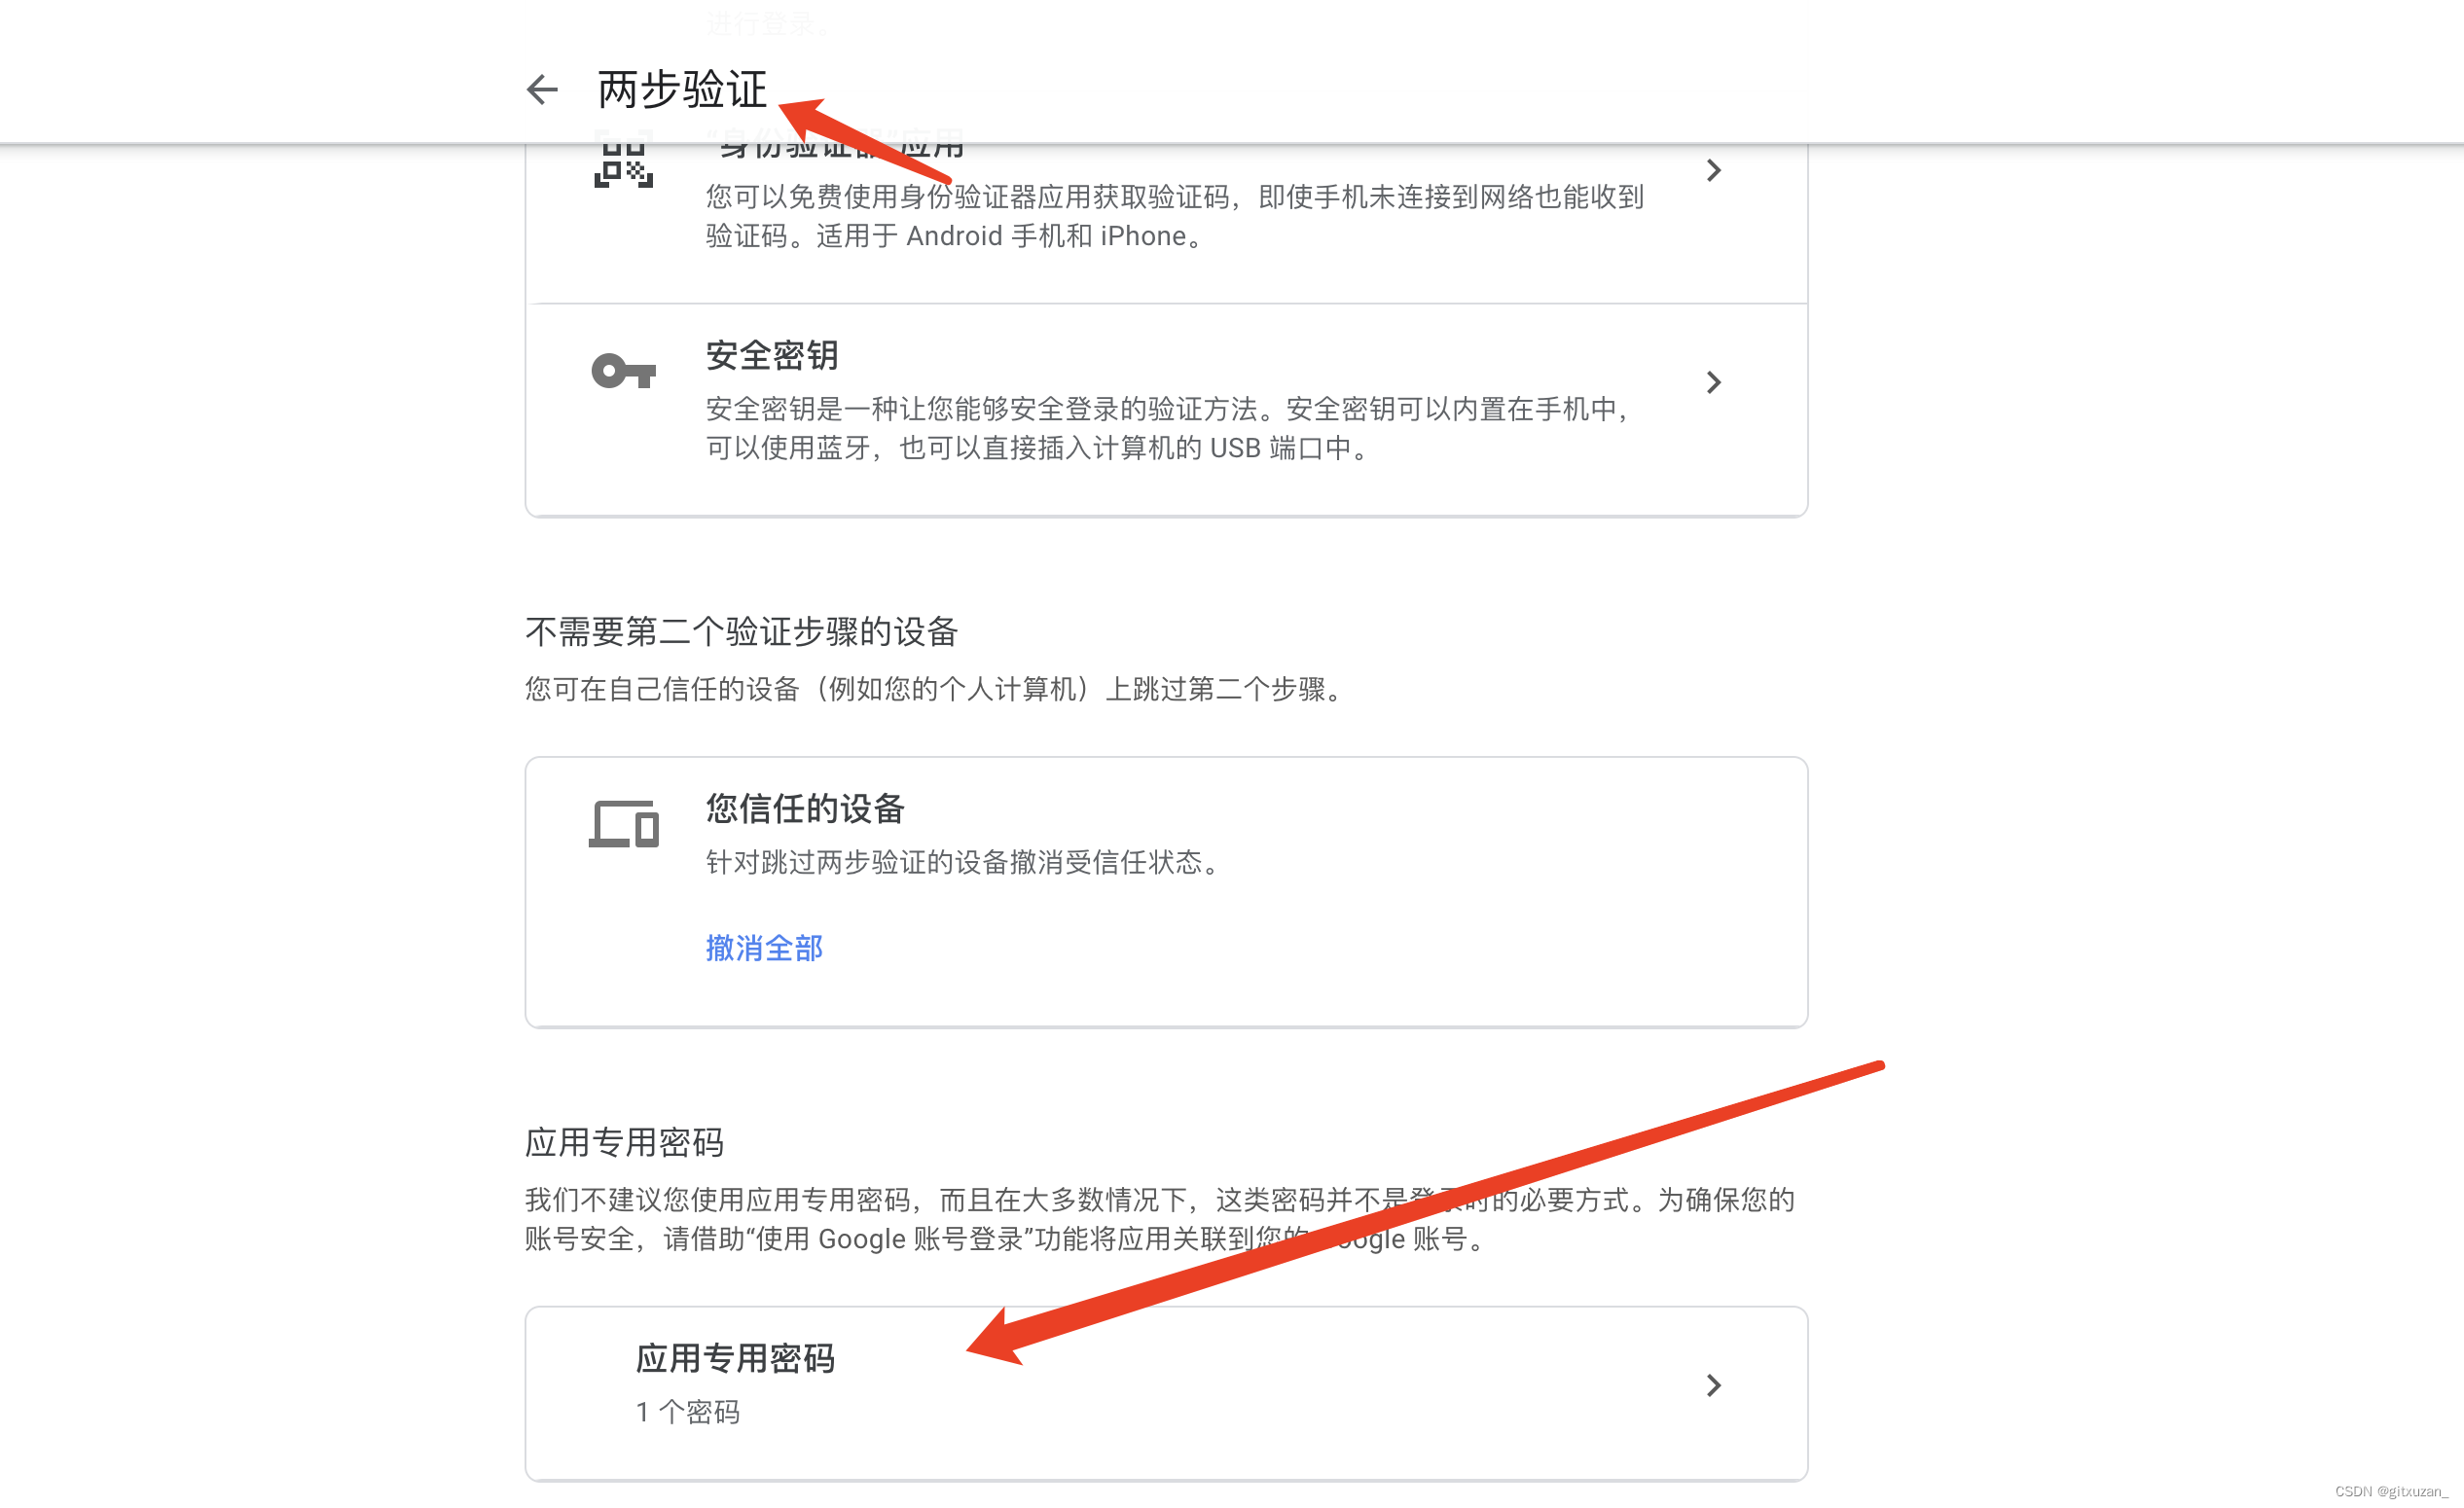
创建一个自定义名称的应用,这个授权码,就是发送邮箱设置的密码,会随机生成一段字符串
七、通过alertmanager 配置邮箱告警
7.1 alertmanager.yml配置
global:
  # 全局配置
  smtp_smarthost: 'smtp.gmail.com:587'  # 指定SMTP服务器和端口,这里使用的是Gmail的SMTP服务器和587端口
  smtp_from: 'xuzan@lippu.ltd'          # 发送告警邮件时使用的发件人邮箱地址
  smtp_auth_username: 'xuzan@lippu.ltd' # SMTP认证时使用的用户名,这里是邮箱地址
  smtp_auth_password: '二次认证上面生成auth密码' # SMTP认证时使用的密码

route:
  # 路由配置
  group_by: ['critical','warning']   # 告警分组依据,这里按照 'server_alert' 标签分组
  group_wait: 30s              # 分组后等待30秒,如果这段时间内有新的相同分组的告警则一起发送
  group_interval: 5m           # 分组告警发送间隔,即每5分钟发送一次同一组的告警
  repeat_interval: 1h          # 重复告警发送间隔,即相同的告警每小时重复发送一次
  receiver: 'email-notifications' # 默认接收器,用于处理没有匹配特定路由的告警
  routes:
    - match:
        severity: 'warning'     # 匹配规则,当告警级别为warning时
      receiver: 'email-notifications' # 使用此接收器处理告警
      group_by: ['warning']     # 告警分组依据,这里按照 'warning' 标签分组
    - match:
        severity: 'critical'    # 匹配规则,当告警级别为critical时
      receiver: 'email-notifications' # 使用此接收器处理告警
      group_by: ['critical']    # 告警分组依据,这里按照 'critical' 标签分组
	  group_wait: 10s           # 分组后等待10秒,如果这段时间内有新的相同分组的告警则一起发送
receivers:
  # 接收器定义
  - name: 'email-notifications'     # 接收器名称
    email_configs:
      - to: 'xuzan@lippu.ltd'       # 告警接收的邮箱地址
        send_resolved: true         # 告警解决后是否发送通知
prometheusyml__331">7.2 prometheus.yml 修改
global:
  scrape_interval: 30s # Set the scrape interval to every 15 seconds. Default is every 1 minute.
  evaluation_interval: 30s # Evaluate rules every 15 seconds. The default is every 1 minute.

# 其他全局配置...

scrape_configs:
  # Prometheus 自身的监控配置
  - job_name: "prometheus"
    static_configs:
      - targets: ["localhost:9070"]

  - job_name: 'node_widgets'
    scheme: https  # 使用 HTTPS
    tls_config:
      insecure_skip_verify: true  # 忽略证书验证
    static_configs:
      - targets: ['xxx:443']  # 替换为您的服务器 B 地址和端口
    metrics_path: '/prometheus/metrics'  # Node Exporter 的路径

  - job_name: '正式服'
    scheme: https  # 使用 HTTPS
    tls_config:
      insecure_skip_verify: true  # 忽略证书验证
    static_configs:
      - targets: ['xxx.com:443']  # 替换为您的服务器 B 地址和端口
    metrics_path: '/v1/app/metrics'  # Node Exporter 的路径

  - job_name: '测式服'
    scheme: http  # 使用 HTTPS
    static_configs:
      - targets: ['23.8323.373.2437:8063']  # 替换为您的服务器 B 地址和端口
    metrics_path: '/v1/app/metrics'  # Node Exporter 的路径

# Alertmanager configuration
alerting:
  alertmanagers:
    - static_configs:
        - targets:
            - localhost:9071

# Load rules once and periodically evaluate them according to the global 'evaluation_interval'.
rule_files:
  - "alert.yml"
    # 测试的
    #- "test_alert.yml"
7.3 报警配置
alert.yml 配置服务是否down机,内存,cpu和 磁盘使用告警
groups:
  - name: Prometheus alert
    rules:
      # 对任何实例超过30s无法联系的情况发出警报
      - alert: 服务是否down机
        expr: up == 0
        for: 30s
        labels:
          severity: critical
        annotations:
          instance: "{{ $labels.instance }}"
          description: "{{ $labels.job }} 服务down机了,紧急查看"

      # 内存使用率超过 80% 的告警
      - alert: 内存使用情况
        expr: (node_memory_MemTotal_bytes - node_memory_MemAvailable_bytes) / node_memory_MemTotal_bytes * 100 > 80
        for: 30s
        labels:
          severity: warning
        annotations:
          instance: "{{ $labels.instance }}"
          description: "内存使用率超过 80%,当前值:{{ $value }}%"

      # CPU 使用率超过 80% 的告警
      - alert: cpu使用情况
        expr: 100 - (avg by (instance) (irate(node_cpu_seconds_total{mode="idle"}[5m])) * 100) > 80
        for: 30s
        labels:
          severity: critical
        annotations:
          instance: "{{ $labels.instance }}"
          description: "CPU 使用率超过 80%,当前值:{{ $value }}%"

      # 磁盘使用率超过 80% 的告警
      - alert: 磁盘使用情况
        expr: (node_filesystem_size_bytes - node_filesystem_free_bytes) / node_filesystem_size_bytes * 100 > 80
        for: 30s
        labels:
          severity: warning
        annotations:
          instance: "{{ $labels.instance }}"
          description: "磁盘使用率超过 80%,当前值:{{ $value }}%"

#  - name: myapp_alerts_down
#    rules:
#      - alert: 程序挂掉了(紧急查看)
#        expr: myapp_up == 1
#        for: 30s
#        labels:
#          severity: warning
#        annotations:
#          summary: "程序掉了 down,超过了30s了"
#          description: "instance {{ $labels.instance }} with job {{ $labels.job }}"
7.4 测试报警 test.alert
groups:
  - name: test_alerts
    rules:
      - alert: TestAlert
        expr: vector(1)
        labels:
          severity: warning
7.5 告警模版也可以自定义,下面这个是官方的模版
https://raw.githubusercontent.com/prometheus/alertmanager/master/template/email.html
<!--
Style and HTML derived from https://github.com/mailgun/transactional-email-templates


The MIT License (MIT)

Copyright (c) 2014 Mailgun

Permission is hereby granted, free of charge, to any person obtaining a copy
of this software and associated documentation files (the "Software"), to deal
in the Software without restriction, including without limitation the rights
to use, copy, modify, merge, publish, distribute, sublicense, and/or sell
copies of the Software, and to permit persons to whom the Software is
furnished to do so, subject to the following conditions:

The above copyright notice and this permission notice shall be included in all
copies or substantial portions of the Software.

THE SOFTWARE IS PROVIDED "AS IS", WITHOUT WARRANTY OF ANY KIND, EXPRESS OR
IMPLIED, INCLUDING BUT NOT LIMITED TO THE WARRANTIES OF MERCHANTABILITY,
FITNESS FOR A PARTICULAR PURPOSE AND NONINFRINGEMENT. IN NO EVENT SHALL THE
AUTHORS OR COPYRIGHT HOLDERS BE LIABLE FOR ANY CLAIM, DAMAGES OR OTHER
LIABILITY, WHETHER IN AN ACTION OF CONTRACT, TORT OR OTHERWISE, ARISING FROM,
OUT OF OR IN CONNECTION WITH THE SOFTWARE OR THE USE OR OTHER DEALINGS IN THE
SOFTWARE.
-->
<!DOCTYPE html PUBLIC "-//W3C//DTD XHTML 1.0 Transitional//EN" "http://www.w3.org/TR/xhtml1/DTD/xhtml1-transitional.dtd">
<html xmlns="http://www.w3.org/1999/xhtml">
<head>
<meta name="viewport" content="width=device-width" />
<meta http-equiv="Content-Type" content="text/html; charset=UTF-8" />
<title>{{ template "__subject" . }}</title>
<style>
/* -------------------------------------
    GLOBAL
    A very basic CSS reset
------------------------------------- */
* {
  margin: 0;
  font-family: "Helvetica Neue", Helvetica, Arial, sans-serif;
  box-sizing: border-box;
  font-size: 14px;
}

img {
  max-width: 100%;
}

body {
  -webkit-font-smoothing: antialiased;
  -webkit-text-size-adjust: none;
  width: 100% !important;
  height: 100%;
  line-height: 1.6em;
  /* 1.6em * 14px = 22.4px, use px to get airier line-height also in Thunderbird, and Yahoo!, Outlook.com, AOL webmail clients */
  /*line-height: 22px;*/
}

/* Let's make sure all tables have defaults */
table td {
  vertical-align: top;
}

/* -------------------------------------
    BODY & CONTAINER
------------------------------------- */
body {
  background-color: #f6f6f6;
}

.body-wrap {
  background-color: #f6f6f6;
  width: 100%;
}

.container {
  display: block !important;
  max-width: 600px !important;
  margin: 0 auto !important;
  /* makes it centered */
  clear: both !important;
}

.content {
  max-width: 600px;
  margin: 0 auto;
  display: block;
  padding: 20px;
}

/* -------------------------------------
    HEADER, FOOTER, MAIN
------------------------------------- */
.main {
  background-color: #fff;
  border: 1px solid #e9e9e9;
  border-radius: 3px;
}

.content-wrap {
  padding: 30px;
}

.content-block {
  padding: 0 0 20px;
}

.header {
  width: 100%;
  margin-bottom: 20px;
}

.footer {
  width: 100%;
  clear: both;
  color: #999;
  padding: 20px;
}
.footer p, .footer a, .footer td {
  color: #999;
  font-size: 12px;
}

/* -------------------------------------
    TYPOGRAPHY
------------------------------------- */
h1, h2, h3 {
  font-family: "Helvetica Neue", Helvetica, Arial, "Lucida Grande", sans-serif;
  color: #000;
  margin: 40px 0 0;
  line-height: 1.2em;
  font-weight: 400;
}

h1 {
  font-size: 32px;
  font-weight: 500;
  /* 1.2em * 32px = 38.4px, use px to get airier line-height also in Thunderbird, and Yahoo!, Outlook.com, AOL webmail clients */
  /*line-height: 38px;*/
}

h2 {
  font-size: 24px;
  /* 1.2em * 24px = 28.8px, use px to get airier line-height also in Thunderbird, and Yahoo!, Outlook.com, AOL webmail clients */
  /*line-height: 29px;*/
}

h3 {
  font-size: 18px;
  /* 1.2em * 18px = 21.6px, use px to get airier line-height also in Thunderbird, and Yahoo!, Outlook.com, AOL webmail clients */
  /*line-height: 22px;*/
}

h4 {
  font-size: 14px;
  font-weight: 600;
}

p, ul, ol {
  margin-bottom: 10px;
  font-weight: normal;
}
p li, ul li, ol li {
  margin-left: 5px;
  list-style-position: inside;
}

/* -------------------------------------
    LINKS & BUTTONS
------------------------------------- */
a {
  color: #348eda;
  text-decoration: underline;
}

.btn-primary {
  text-decoration: none;
  color: #FFF;
  background-color: #348eda;
  border: solid #348eda;
  border-width: 10px 20px;
  line-height: 2em;
  /* 2em * 14px = 28px, use px to get airier line-height also in Thunderbird, and Yahoo!, Outlook.com, AOL webmail clients */
  /*line-height: 28px;*/
  font-weight: bold;
  text-align: center;
  cursor: pointer;
  display: inline-block;
  border-radius: 5px;
  text-transform: capitalize;
}

/* -------------------------------------
    OTHER STYLES THAT MIGHT BE USEFUL
------------------------------------- */
.last {
  margin-bottom: 0;
}

.first {
  margin-top: 0;
}

.aligncenter {
  text-align: center;
}

.alignright {
  text-align: right;
}

.alignleft {
  text-align: left;
}

.clear {
  clear: both;
}

/* -------------------------------------
    ALERTS
    Change the class depending on warning email, good email or bad email
------------------------------------- */
.alert {
  font-size: 16px;
  color: #fff;
  font-weight: 500;
  padding: 20px;
  text-align: center;
  border-radius: 3px 3px 0 0;
}
.alert a {
  color: #fff;
  text-decoration: none;
  font-weight: 500;
  font-size: 16px;
}
.alert.alert-warning {
  background-color: #E6522C;
}
.alert.alert-bad {
  background-color: #D0021B;
}
.alert.alert-good {
  background-color: #68B90F;
}

/* -------------------------------------
    INVOICE
    Styles for the billing table
------------------------------------- */
.invoice {
  margin: 40px auto;
  text-align: left;
  width: 80%;
}
.invoice td {
  padding: 5px 0;
}
.invoice .invoice-items {
  width: 100%;
}
.invoice .invoice-items td {
  border-top: #eee 1px solid;
}
.invoice .invoice-items .total td {
  border-top: 2px solid #333;
  border-bottom: 2px solid #333;
  font-weight: 700;
}

/* -------------------------------------
    RESPONSIVE AND MOBILE FRIENDLY STYLES
------------------------------------- */
@media only screen and (max-width: 640px) {
  body {
    padding: 0 !important;
  }

  h1, h2, h3, h4 {
    font-weight: 800 !important;
    margin: 20px 0 5px !important;
  }

  h1 {
    font-size: 22px !important;
  }

  h2 {
    font-size: 18px !important;
  }

  h3 {
    font-size: 16px !important;
  }

  .container {
    padding: 0 !important;
    width: 100% !important;
  }

  .content {
    padding: 0 !important;
  }

  .content-wrap {
    padding: 10px !important;
  }

  .invoice {
    width: 100% !important;
  }
}
</style>
</head>

<body itemscope itemtype="https://schema.org/EmailMessage">

<table class="body-wrap">
  <tr>
    <td></td>
    <td class="container" width="600">
      <div class="content">
        <table class="main" width="100%" cellpadding="0" cellspacing="0">
          <tr>
            {{ if gt (len .Alerts.Firing) 0 }}
            <td class="alert alert-warning">
              {{ .Alerts | len }} alert{{ if gt (len .Alerts) 1 }}s{{ end }} for {{ range .GroupLabels.SortedPairs }}
                {{ .Name }}={{ .Value }}
              {{ end }}
            </td>
            {{ else }}
            <td class="alert alert-good">
              {{ .Alerts | len }} alert{{ if gt (len .Alerts) 1 }}s{{ end }} for {{ range .GroupLabels.SortedPairs }}
                {{ .Name }}={{ .Value }}
              {{ end }}
            </td>
            {{ end }}
          </tr>
          <tr>
            <td class="content-wrap">
              <table width="100%" cellpadding="0" cellspacing="0">
                <tr>
                  <td class="content-block">
                    <a href='{{ template "__alertmanagerURL" . }}' class="btn-primary">View in {{ template "__alertmanager" . }}</a>
                  </td>
                </tr>
                {{ if gt (len .Alerts.Firing) 0 }}
                <tr>
                  <td class="content-block">
                    <strong>[{{ .Alerts.Firing | len }}] Firing</strong>
                  </td>
                </tr>
                {{ end }}
                {{ range .Alerts.Firing }}
                <tr>
                  <td class="content-block">
                    <strong>Labels</strong><br />
                    {{ range .Labels.SortedPairs }}{{ .Name }} = {{ .Value }}<br />{{ end }}
                    {{ if gt (len .Annotations) 0 }}<strong>Annotations</strong><br />{{ end }}
                    {{ range .Annotations.SortedPairs }}{{ .Name }} = {{ .Value }}<br />{{ end }}
                    <a href="{{ .GeneratorURL }}">Source</a><br />
                  </td>
                </tr>
                {{ end }}

                {{ if gt (len .Alerts.Resolved) 0 }}
                  {{ if gt (len .Alerts.Firing) 0 }}
                <tr>
                  <td class="content-block">
                    <br />
                    <hr />
                    <br />
                  </td>
                </tr>
                  {{ end }}
                <tr>
                  <td class="content-block">
                    <strong>[{{ .Alerts.Resolved | len }}] Resolved</strong>
                  </td>
                </tr>
                {{ end }}
                {{ range .Alerts.Resolved }}
                <tr>
                  <td class="content-block">
                    <strong>Labels</strong><br />
                    {{ range .Labels.SortedPairs }}{{ .Name }} = {{ .Value }}<br />{{ end }}
                    {{ if gt (len .Annotations) 0 }}<strong>Annotations</strong><br />{{ end }}
                    {{ range .Annotations.SortedPairs }}{{ .Name }} = {{ .Value }}<br />{{ end }}
                    <a href="{{ .GeneratorURL }}">Source</a><br />
                  </td>
                </tr>
                {{ end }}
              </table>
            </td>
          </tr>
        </table>

        <div class="footer">
          <table width="100%">
            <tr>
              <td class="aligncenter content-block"><a href='{{ .ExternalURL }}'>Sent by {{ template "__alertmanager" . }}</a></td>
            </tr>
          </table>
        </div></div>
    </td>
    <td></td>
  </tr>
</table>

</body>
</html>
八、alertmanger 的webhook配置
8.1 alert_news.yml
下面的匹配主要会通过match 匹配报警的 label
route:
  # 路由配置
  group_by: ['critical','warning']   # 告警分组依据,这里按照 'server_alert' 标签分组
  group_wait: 30s              # 分组后等待30秒,如果这段时间内有新的相同分组的告警则一起发送
  group_interval: 5m           # 分组告警发送间隔,即每5分钟发送一次同一组的告警
  repeat_interval: 1h          # 重复告警发送间隔,即相同的告警每小时重复发送一次
  receiver: 'email-notifications' # 默认接收器,用于处理没有匹配特定路由的告警
  routes:
    - match:
        severity: 'warning'     # 匹配规则,当告警级别为warning时
      receiver: 'email-notifications' # 使用此接收器处理告警
      group_by: ['warning']     # 告警分组依据,这里按照 'warning' 标签分组
      continue: true  # 允许告警继续匹配后续路由
    - match:
        webhook: 'server'
      receiver: 'webhook-server-restart'
      group_by: [ 'server_restart' ] # 这里按 job 和 instance 分组
      group_wait: 0s           # 分组后等待10秒,如果这段时间内有新的相同分组的告警则一起发送
      group_interval: 2m           # 分组告警发送间隔,即每5分钟发送一次同一组的告警
      repeat_interval: 1h          # 重复告警发送间隔,即相同的告警每小时重复发送一次
      continue: true  # 允许告警继续匹配后续路由
    - match:
        severity: 'critical'    # 匹配规则,当告警级别为critical时
      receiver: 'email-notifications' # 使用此接收器处理告警
      group_by: ['critical']    # 告警分组依据,这里按照 'critical' 标签分组
      group_wait: 4s           # 分组后等待10秒,如果这段时间内有新的相同分组的告警则一起发送
      continue: true  # 允许告警继续匹配后续路由
receivers:
  # 接收器定义
  - name: 'email-notifications'     # 接收器名称
    email_configs:
      - to: 'xuzan@lippu.ltd'       # 告警接收的邮箱地址
        send_resolved: true         # 告警解决后是否发送通知
  - name: 'webhook-server-restart'
    webhook_configs:
      - url: 'http://test.com'  # 替换为你的webhook URL
        send_resolved: false
webhook 发送的内容是个post请求,可以通过job去区分做点自动化的事情
{
    "receiver": "webhook-server-restart",
    "status": "firing",
    "alerts": [
        {
            "status": "firing",
            "labels": {
                "alertname": "服务是否down机",
                "instance": "127.0.0.1:8030",
                "job": "widgets测试用的8030",
                "severity": "critical",
                "webhook": "server"
            },
            "annotations": {
                "description": "widgets测试用的8030 服务down机了,紧急查看",
                "instance": "127.0.0.1:8030"
            },
            "startsAt": "2023-12-12T05:33:45.995Z",
            "endsAt": "0001-01-01T00:00:00Z",
            "generatorURL": "http://ip-172-31-1-251.ec2.internal:9070/graph?g0.expr=up+%3D%3D+0&g0.tab=1",
            "fingerprint": "e42bc9ee6cfe5567"
        }
    ],
    "groupLabels": {},
    "commonLabels": {
        "alertname": "服务是否down机",
        "instance": "127.0.0.1:8030",
        "job": "widgets测试用的8030",
        "severity": "critical",
        "webhook": "server"
    },
    "commonAnnotations": {
        "description": "widgets测试用的8030 服务down机了,紧急查看",
        "instance": "127.0.0.1:8030"
    },
    "externalURL": "http://ip-172-31-1-251.ec2.internal:9071",
    "version": "4",
    "groupKey": "{}/{webhook=\"server\"}:{}",
    "truncatedAlerts": 0
}
8.2 关于amtool 使用
检测配置和查看当前警报
./amtool check-config new_alertmanager.yml

./amtool --alertmanager.url=http://localhost:9071 alert