PrometheusPadavan_0">Prometheus监控Padavan路由器
1、背景
近期在Synology(群辉)中安装一套Prometheus监控程序,目前已经监控Synology,然后家中有有路由器(Padavan)型号,也准备使用Prometheus+Grafan进行监控。
环境:
Prometheus:2.48.0
Grafan:10
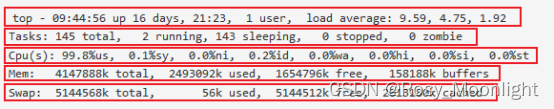
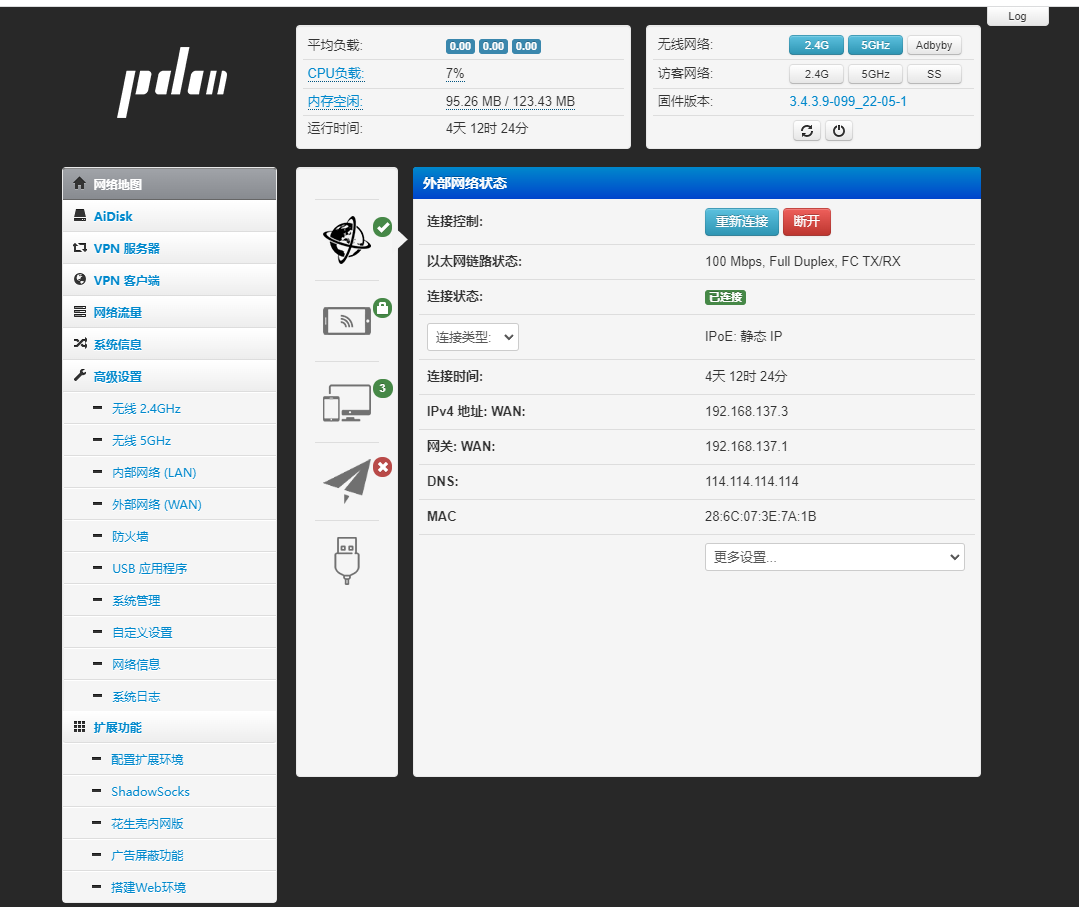
Padavan:固件版本:3.4.3.9-099_22-05-1
2、监控步骤
1、padavan_exporter 正确使用
地址:https://github.com/Bpazy/padavan_exporter/blob/master/README-zh_CN.md
padavan_exporter有两种方式(不是放到Padavan系统上的)
Linux操作系统
在Linux操作系统下载padavan_exporter
参数使用
$ ./padavan_exporter --help
Flags:
  --help                        Show context-sensitive help (also try
                                --help-long and --help-man).
  --web.listen-address=":9100"  Address on which to expose metrics and web
                                interface
  --padavan.ssh.host="127.0.0.1:22"
                                Padavan ssh host
  --padavan.ssh.username="admin"
                                Padavan ssh username
  --padavan.ssh.password="admin"
                                Padavan ssh password
  --debug                       Debug mode
安装 padavan_exporter 并使用正确的参数启动(点击跳转项目首页)
wget https://github.com/Bpazy/padavan_exporter/releases/download/v0.0.2/padavan_exporter-linux-amd64-v0.0.2
sudo mv ./padavan_exporter-linux-amd64-v0.0.2 /usr/local/bin/padavan_exporter
sudo chmod u=rwx,o=rx,g=rx /usr/local/bin/padavan_exporter
sudo chgrp root /usr/local/bin/padavan_exporter
sudo chown root /usr/local/bin/padavan_exporter

# 自定义 systemd service
sudo touch /lib/systemd/system/padavan_exporter.service
sudo cat <<EOF >/lib/systemd/system/padavan_exporter.service
[Unit]
Description=Node exporter
After=network.target

[Service]
Type=simple
ExecStart=/usr/local/bin/padavan_exporter  --padavan.ssh.host="127.0.0.1:22"  --padavan.ssh.username="admin"  --padavan.ssh.password="admin"
Restart=on-failure

[Install]
WantedBy=multi-user.target
EOF

# 加载自定义的 service
sudo systemctl daemon-reload
# 开机自启
sudo systemctl enable padavan_exporter
# 启动
sudo systemctl start padavan_exporter
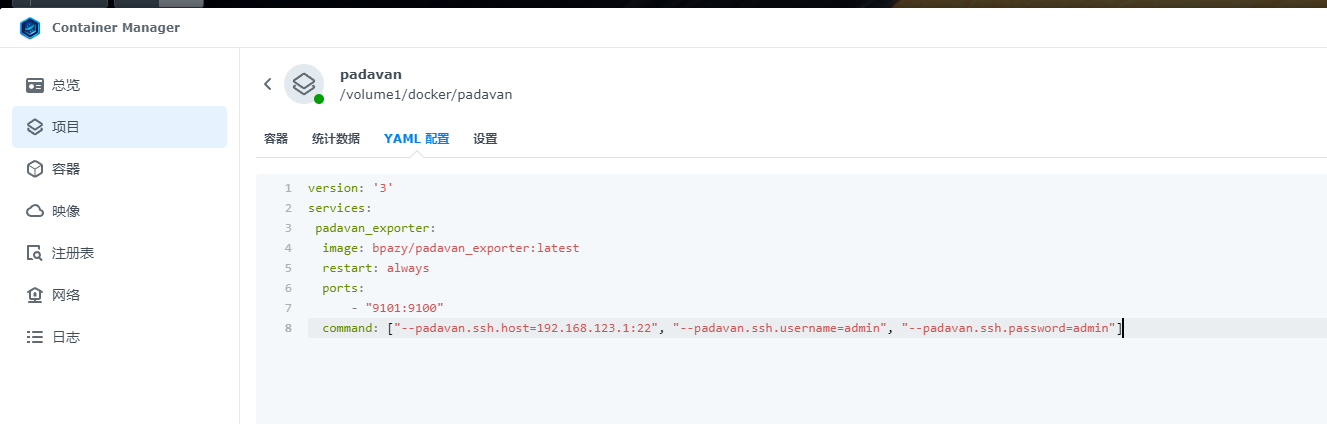
Docker Compose(推荐)
当然更好的方式是使用 Docker Compose,你可以参考本项目预置的 docker-compose.yml 文件。
此处要注意,我把9100端口 映射到 9101,因为 我的 9100端口已经被占用,你们要注意
version: '3'
services:
 padavan_exporter:
  image: bpazy/padavan_exporter:latest
  restart: always
  ports:
      - "9101:9100"
  command: ["--padavan.ssh.host=192.168.123.1:22", "--padavan.ssh.username=admin", "--padavan.ssh.password=admin"]
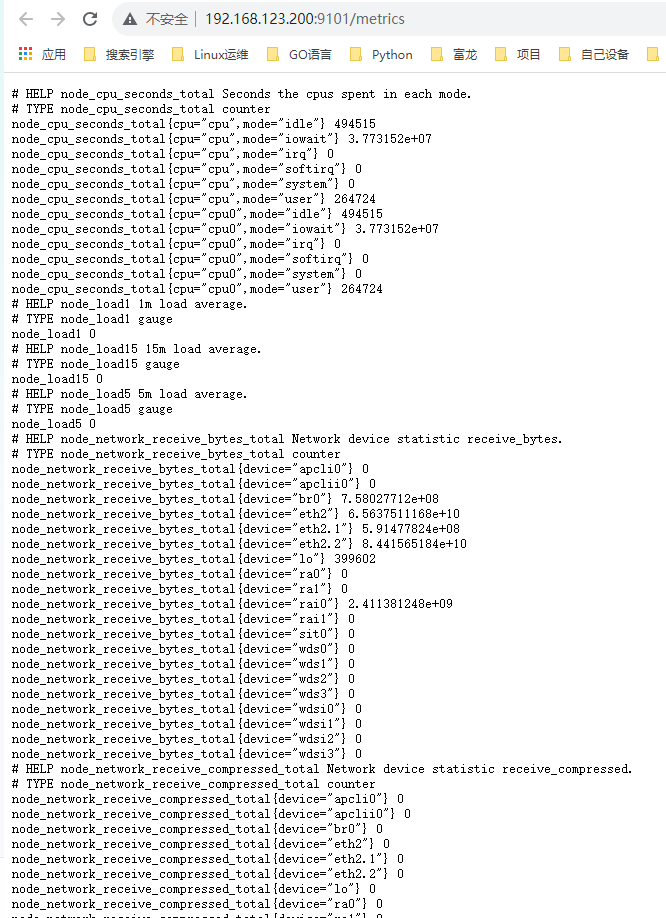
测试数据
Prometheus_113">Prometheus修改配置重载
  - job_name: 'padavan'
    static_configs:
    - targets: ['192.168.123.200:9101']
Grafana__122">2、Grafana 导入图形
这个图在Dashboard: https://grafana.com/grafana/dashboards/15978 进行修改 根补充
 Padavan" />
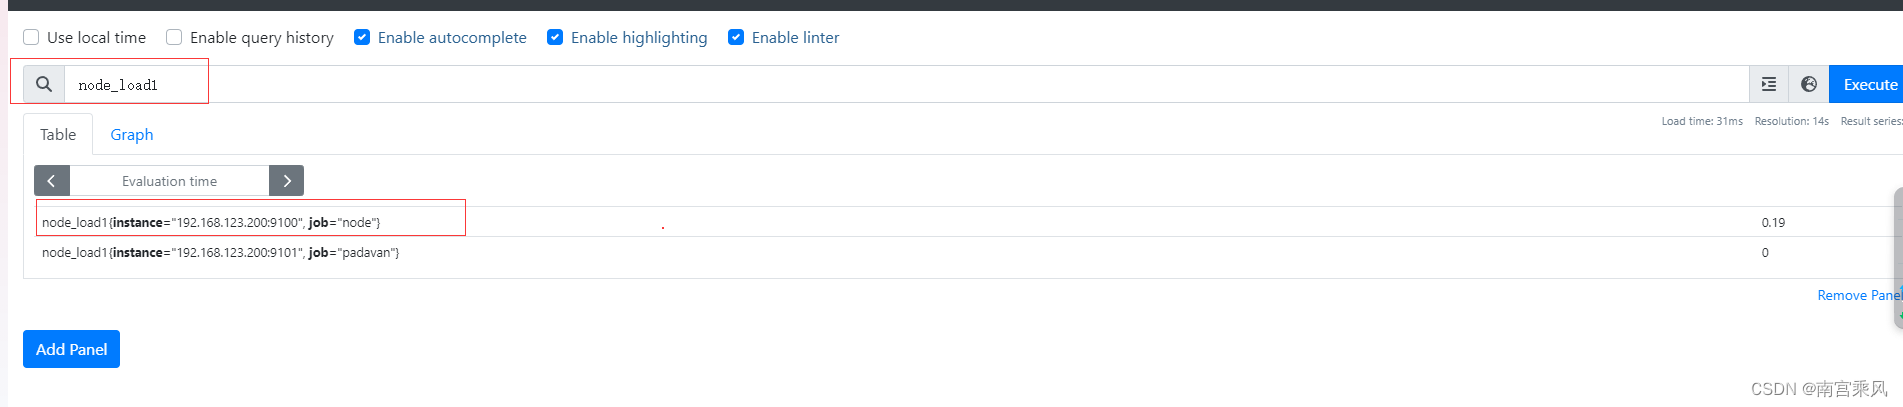
如果导入没数据,请编辑
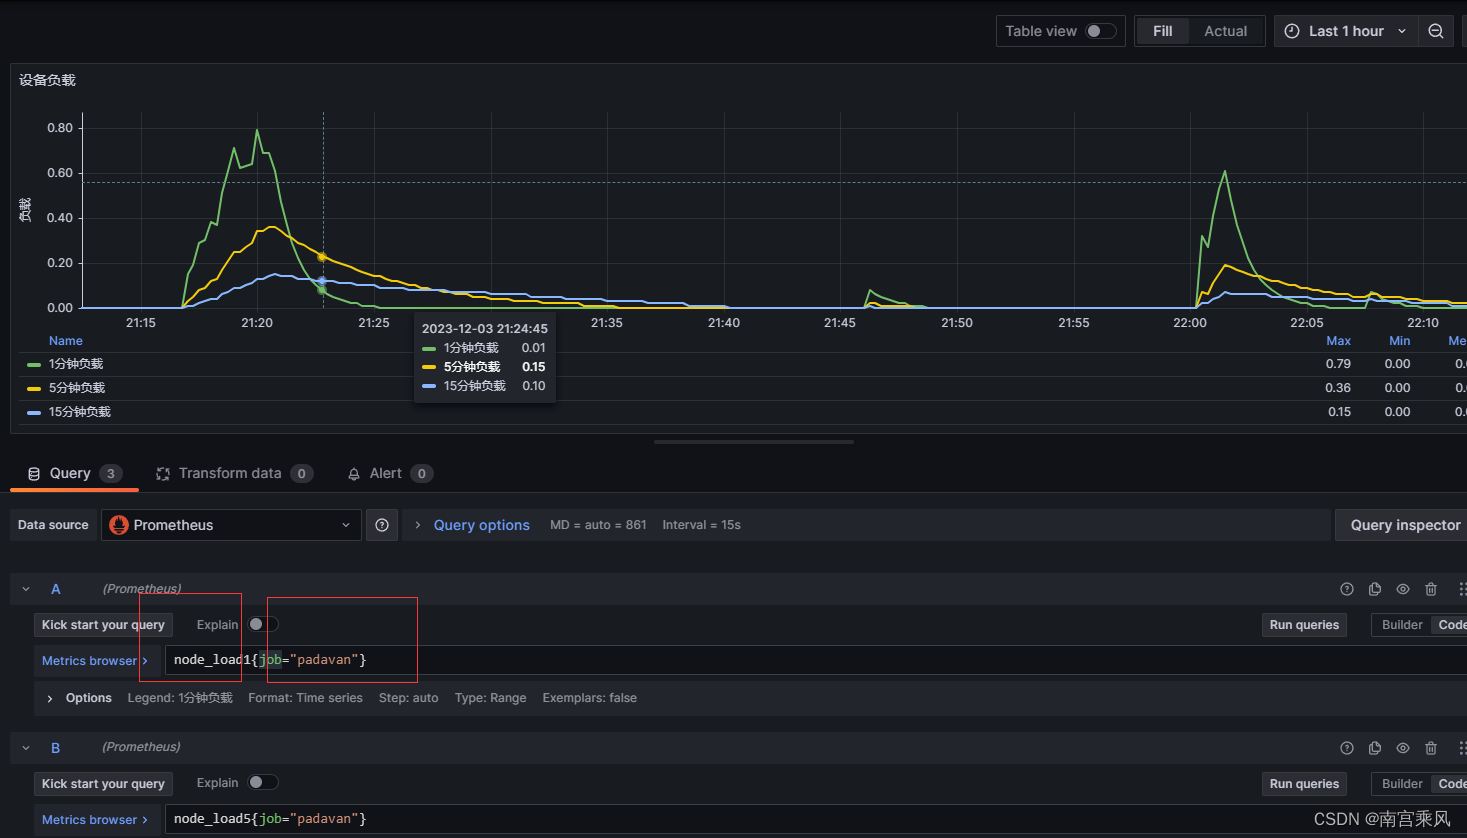
然后在Prometheus上进行调试
下载Json文件导入
Padavan-1701611865144.json
{
"__inputs": [
{
"name": "DS_PROMETHEUS",
"label": "Prometheus",
"description": "",
"type": "datasource",
"pluginId": "prometheus",
"pluginName": "Prometheus"
}
],
"__elements": {},
"__requires": [
{
"type": "grafana",
"id": "grafana",
"name": "Grafana",
"version": "10.2.2"
},
{
"type": "panel",
"id": "graph",
"name": "Graph (old)"
},
{
"type": "datasource",
"id": "prometheus",
"name": "Prometheus",
"version": "1.0.0"
},
{
"type": "panel",
"id": "timeseries",
"name": "Time series"
}
],
"annotations": {
"list": [
{
"builtIn": 1,
"datasource": {
"type": "datasource",
"uid": "grafana"
},
"enable": true,
"hide": true,
"iconColor": "rgba(0, 211, 255, 1)",
"name": "Annotations & Alerts",
"type": "dashboard"
}
]
},
"description": "Padavan exporter's Dashboard 南宫乘风 fix ",
"editable": true,
"fiscalYearStartMonth": 0,
"gnetId": 15978,
"graphTooltip": 2,
"id": null,
"links": [
{
"asDropdown": false,
"icon": "external link",
"includeVars": false,
"keepTime": false,
"tags": [],
"targetBlank": false,
"title": "如果不显示数据,请手动修改 页面中的标签数据(请点击,请查询博客教程)",
"tooltip": "",
"type": "link",
"url": "https://blog.csdn.net/heian_99"
}
],
"liveNow": false,
"panels": [
{
"collapsed": false,
"gridPos": {
"h": 1,
"w": 24,
"x": 0,
"y": 0
},
"id": 9,
"panels": [],
"title": "基础信息",
"type": "row"
},
{
"datasource": {
"type": "prometheus",
"uid": "${DS_PROMETHEUS}"
},
"fieldConfig": {
"defaults": {
"color": {
"mode": "palette-classic"
},
"custom": {
"axisBorderShow": true,
"axisCenteredZero": false,
"axisColorMode": "text",
"axisLabel": "负载",
"axisPlacement": "auto",
"barAlignment": 0,
"drawStyle": "line",
"fillOpacity": 0,
"gradientMode": "none",
"hideFrom": {
"legend": false,
"tooltip": false,
"viz": false
},
"insertNulls": false,
"lineInterpolation": "linear",
"lineWidth": 2,
"pointSize": 5,
"scaleDistribution": {
"type": "linear"
},
"showPoints": "auto",
"spanNulls": false,
"stacking": {
"group": "A",
"mode": "none"
},
"thresholdsStyle": {
"mode": "off"
}
},
"decimals": 2,
"mappings": [],
"thresholds": {
"mode": "absolute",
"steps": [
{
"color": "green",
"value": null
},
{
"color": "red",
"value": 80
}
]
}
},
"overrides": []
},
"gridPos": {
"h": 9,
"w": 11,
"x": 0,
"y": 1
},
"id": 15,
"options": {
"legend": {
"calcs": [
"max",
"min",
"mean"
],
"displayMode": "table",
"placement": "bottom",
"showLegend": true
},
"tooltip": {
"mode": "multi",
"sort": "none"
}
},
"targets": [
{
"datasource": {
"type": "prometheus",
"uid": "${DS_PROMETHEUS}"
},
"editorMode": "code",
"expr": "node_load1{job=\"padavan\"}",
"instant": false,
"legendFormat": "1分钟负载",
"range": true,
"refId": "A"
},
{
"datasource": {
"type": "prometheus",
"uid": "${DS_PROMETHEUS}"
},
"editorMode": "code",
"expr": "node_load5{job=\"padavan\"}",
"hide": false,
"instant": false,
"legendFormat": "5分钟负载",
"range": true,
"refId": "B"
},
{
"datasource": {
"type": "prometheus",
"uid": "${DS_PROMETHEUS}"
},
"editorMode": "code",
"expr": "node_load15{job=\"padavan\"}",
"hide": false,
"instant": false,
"legendFormat": "15分钟负载",
"range": true,
"refId": "C"
}
],
"title": "设备负载",
"type": "timeseries"
},
{
"datasource": {
"type": "prometheus",
"uid": "${DS_PROMETHEUS}"
},
"description": "",
"fieldConfig": {
"defaults": {
"color": {
"mode": "palette-classic"
},
"custom": {
"axisBorderShow": false,
"axisCenteredZero": false,
"axisColorMode": "text",
"axisLabel": "",
"axisPlacement": "auto",
"barAlignment": 0,
"drawStyle": "line",
"fillOpacity": 25,
"gradientMode": "none",
"hideFrom": {
"legend": false,
"tooltip": false,
"viz": false
},
"insertNulls": false,
"lineInterpolation": "smooth",
"lineStyle": {
"fill": "solid"
},
"lineWidth": 1,
"pointSize": 5,
"scaleDistribution": {
"type": "linear"
},
"showPoints": "auto",
"spanNulls": false,
"stacking": {
"group": "A",
"mode": "none"
},
"thresholdsStyle": {
"mode": "off"
}
},
"fieldMinMax": true,
"mappings": [],
"min": 0,
"thresholds": {
"mode": "absolute",
"steps": [
{
"color": "green",
"value": null
},
{
"color": "red",
"value": 80
}
]
},
"unit": "percent"
},
"overrides": []
},
"gridPos": {
"h": 9,
"w": 12,
"x": 11,
"y": 1
},
"id": 14,
"options": {
"legend": {
"calcs": [
"max",
"min",
"mean"
],
"displayMode": "table",
"placement": "bottom",
"showLegend": true
},
"tooltip": {
"mode": "multi",
"sort": "none"
}
},
"targets": [
{
"datasource": {
"type": "prometheus",
"uid": "${DS_PROMETHEUS}"
},
"editorMode": "code",
"expr": "100- (\r\n (\r\n sum without (mode) (rate(node_cpu_seconds_total{job=\"padavan\", cpu=\"cpu\"}[5m]))\r\n -\r\n sum without (mode) (rate(node_cpu_seconds_total{job=\"padavan\",cpu=\"cpu\", mode=\"idle\"}[5m]))\r\n ) / \r\n sum without (mode) (rate(node_cpu_seconds_total{job=\"padavan\",cpu=\"cpu\"}[5m]))\r\n) * 100",
"instant": false,
"legendFormat": "cpu使用率",
"range": true,
"refId": "A"
}
],
"title": "CPU使用率",
"type": "timeseries"
},
{
"datasource": {
"type": "prometheus",
"uid": "${DS_PROMETHEUS}"
},
"description": "1H路由器数据",
"fieldConfig": {
"defaults": {
"color": {
"mode": "palette-classic"
},
"custom": {
"axisBorderShow": true,
"axisCenteredZero": false,
"axisColorMode": "text",
"axisLabel": "",
"axisPlacement": "auto",
"barAlignment": 0,
"drawStyle": "bars",
"fillOpacity": 100,
"gradientMode": "hue",
"hideFrom": {
"legend": false,
"tooltip": false,
"viz": false
},
"insertNulls": false,
"lineInterpolation": "linear",
"lineWidth": 1,
"pointSize": 5,
"scaleDistribution": {
"type": "linear"
},
"showPoints": "auto",
"spanNulls": false,
"stacking": {
"group": "A",
"mode": "percent"
},
"thresholdsStyle": {
"mode": "off"
}
},
"decimals": 2,
"fieldMinMax": false,
"mappings": [],
"thresholds": {
"mode": "absolute",
"steps": [
{
"color": "green",
"value": null
},
{
"color": "red",
"value": 80
}
]
},
"unit": "bytes"
},
"overrides": []
},
"gridPos": {
"h": 9,
"w": 11,
"x": 0,
"y": 10
},
"id": 8,
"options": {
"legend": {
"calcs": [],
"displayMode": "list",
"placement": "bottom",
"showLegend": true
},
"tooltip": {
"mode": "multi",
"sort": "none"
}
},
"pluginVersion": "10.2.2",
"targets": [
{
"datasource": {
"type": "prometheus",
"uid": "${DS_PROMETHEUS}"
},
"editorMode": "code",
"expr": "increase(node_network_receive_bytes_total{job=\"padavan\",device=~'br0|eth2.2'}[1h])",
"format": "time_series",
"interval": "30m",
"legendFormat": "{{device}} 下载",
"range": true,
"refId": "A"
},
{
"datasource": {
"type": "prometheus",
"uid": "${DS_PROMETHEUS}"
},
"editorMode": "code",
"exemplar": false,
"expr": "increase(node_network_transmit_bytes_total{job=\"padavan\",device=~'eth2|br0|eth2.2'}[1h])",
"interval": "30m",
"legendFormat": "{{device}} 上传",
"range": true,
"refId": "B"
}
],
"title": "1H路由器数据",
"type": "timeseries"
},
{
"aliasColors": {},
"bars": false,
"dashLength": 10,
"dashes": false,
"datasource": {
"type": "prometheus",
"uid": "${DS_PROMETHEUS}"
},
"description": "",
"fieldConfig": {
"defaults": {
"links": []
},
"overrides": []
},
"fill": 1,
"fillGradient": 0,
"gridPos": {
"h": 9,
"w": 12,
"x": 11,
"y": 10
},
"hiddenSeries": false,
"id": 4,
"legend": {
"avg": false,
"current": false,
"max": false,
"min": false,
"show": true,
"total": false,
"values": false
},
"lines": true,
"linewidth": 1,
"nullPointMode": "null",
"options": {
"alertThreshold": true
},
"percentage": false,
"pluginVersion": "10.2.2",
"pointradius": 2,
"points": false,
"renderer": "flot",
"seriesOverrides": [
{
"$$hashKey": "object:250",
"alias": "ppp0 receive rate",
"color": "#5794F2",
"fill": 0,
"yaxis": 2
},
{
"$$hashKey": "object:251",
"alias": "ppp0 receive total",
"color": "#B877D9"
}
],
"spaceLength": 10,
"stack": false,
"steppedLine": false,
"targets": [
{
"datasource": {
"type": "prometheus",
"uid": "${DS_PROMETHEUS}"
},
"editorMode": "code",
"expr": "increase(node_network_receive_bytes_total{job=\"padavan\", device=~\"eth2.2|br0\"}[1000w])",
"interval": "",
"legendFormat": "{{device}} 接收总数",
"range": true,
"refId": "A"
},
{
"datasource": {
"type": "prometheus",
"uid": "${DS_PROMETHEUS}"
},
"editorMode": "code",
"expr": "rate(node_network_receive_bytes_total{device=~\"eth2.2|br0\", job=\"padavan\"}[1m])",
"interval": "",
"legendFormat": "{{device}} 接收速率",
"range": true,
"refId": "B"
}
],
"thresholds": [],
"timeRegions": [],
"title": "网络下载总计",
"tooltip": {
"shared": true,
"sort": 0,
"value_type": "individual"
},
"type": "graph",
"xaxis": {
"mode": "time",
"show": true,
"values": []
},
"yaxes": [
{
"$$hashKey": "object:268",
"format": "decbytes",
"label": "Receive Total",
"logBase": 1,
"show": true
},
{
"$$hashKey": "object:269",
"format": "Bps",
"label": "Receive Rate",
"logBase": 1,
"show": true
}
],
"yaxis": {
"align": false
}
},
{
"aliasColors": {},
"bars": false,
"dashLength": 10,
"dashes": false,
"datasource": {
"type": "prometheus",
"uid": "${DS_PROMETHEUS}"
},
"description": "",
"fieldConfig": {
"defaults": {
"links": []
},
"overrides": []
},
"fill": 1,
"fillGradient": 0,
"gridPos": {
"h": 9,
"w": 11,
"x": 0,
"y": 19
},
"hiddenSeries": false,
"id": 6,
"legend": {
"avg": false,
"current": false,
"max": false,
"min": false,
"show": true,
"total": false,
"values": false
},
"lines": true,
"linewidth": 1,
"nullPointMode": "null",
"options": {
"alertThreshold": true
},
"percentage": false,
"pluginVersion": "10.2.2",
"pointradius": 2,
"points": false,
"renderer": "flot",
"seriesOverrides": [
{
"$$hashKey": "object:824",
"alias": "ppp0 download bandwidth",
"color": "#5794F2"
},
{
"$$hashKey": "object:825",
"alias": "ppp0 upload bandwidth",
"color": "#73BF69"
}
],
"spaceLength": 10,
"stack": false,
"steppedLine": false,
"targets": [
{
"datasource": {
"type": "prometheus",
"uid": "${DS_PROMETHEUS}"
},
"editorMode": "code",
"expr": "rate(node_network_transmit_bytes_total{device=~\"eth2.2|br0\", job=\"padavan\"}[1m])*8",
"instant": false,
"interval": "",
"legendFormat": "{{device}} 上传",
"refId": "A"
},
{
"datasource": {
"type": "prometheus",
"uid": "${DS_PROMETHEUS}"
},
"editorMode": "code",
"expr": "rate(node_network_receive_bytes_total{device=~\"eth2.2|br0\", job=\"padavan\"}[1m])*8",
"instant": false,
"interval": "",
"legendFormat": "{{device}} 下载",
"refId": "B"
}
],
"thresholds": [],
"timeRegions": [],
"title": "网络带宽",
"tooltip": {
"shared": true,
"sort": 0,
"value_type": "individual"
},
"type": "graph",
"xaxis": {
"mode": "time",
"show": true,
"values": []
},
"yaxes": [
{
"$$hashKey": "object:838",
"format": "decbits",
"label": "",
"logBase": 1,
"show": true
},
{
"$$hashKey": "object:839",
"format": "short",
"label": "",
"logBase": 1,
"show": false
}
],
"yaxis": {
"align": false
}
},
{
"aliasColors": {},
"bars": false,
"dashLength": 10,
"dashes": false,
"datasource": {
"type": "prometheus",
"uid": "${DS_PROMETHEUS}"
},
"fieldConfig": {
"defaults": {
"links": []
},
"overrides": []
},
"fill": 1,
"fillGradient": 0,
"gridPos": {
"h": 9,
"w": 12,
"x": 11,
"y": 19
},
"hiddenSeries": false,
"id": 2,
"legend": {
"avg": false,
"current": false,
"max": false,
"min": false,
"show": true,
"total": false,
"values": false
},
"lines": true,
"linewidth": 1,
"nullPointMode": "null",
"options": {
"alertThreshold": true
},
"percentage": false,
"pluginVersion": "10.2.2",
"pointradius": 2,
"points": false,
"renderer": "flot",
"seriesOverrides": [
{
"$$hashKey": "object:723",
"alias": "ppp0 transmit rate",
"color": "#73BF69",
"fill": 0,
"yaxis": 2
},
{
"$$hashKey": "object:724",
"alias": "ppp0 transmit total",
"color": "#B877D9"
}
],
"spaceLength": 10,
"stack": false,
"steppedLine": false,
"targets": [
{
"datasource": {
"type": "prometheus",
"uid": "${DS_PROMETHEUS}"
},
"editorMode": "code",
"expr": "increase(node_network_transmit_bytes_total{job=\"padavan\", device=~\"eth2.2|br0\"}[1000w])",
"interval": "",
"legendFormat": "{{device}} 上传总计",
"range": true,
"refId": "A"
},
{
"datasource": {
"type": "prometheus",
"uid": "${DS_PROMETHEUS}"
},
"editorMode": "code",
"expr": "rate(node_network_transmit_bytes_total{device=~\"eth2.2|br0\", job=\"padavan\"}[1m])",
"interval": "",
"legendFormat": "{{device}} 上传速率",
"range": true,
"refId": "B"
}
],
"thresholds": [],
"timeRegions": [],
"title": "网络上传总计",
"tooltip": {
"shared": true,
"sort": 0,
"value_type": "individual"
},
"type": "graph",
"xaxis": {
"mode": "time",
"show": true,
"values": []
},
"yaxes": [
{
"$$hashKey": "object:741",
"format": "decbytes",
"label": "Transmit Total",
"logBase": 1,
"show": true
},
{
"$$hashKey": "object:742",
"format": "Bps",
"label": "Transmit Rate",
"logBase": 1,
"show": true
}
],
"yaxis": {
"align": false,
"alignLevel": 0
}
}
],
"refresh": "10s",
"schemaVersion": 38,
"tags": [
"jokersy"
],
"templating": {
"list": []
},
"time": {
"from": "now-1h",
"to": "now"
},
"timepicker": {
"refresh_intervals": [
"10s",
"30s",
"1m",
"5m",
"15m",
"30m",
"1h",
"2h",
"1d"
]
},
"timezone": "",
"title": "Padavan",
"uid": "5BoX3my7z",
"version": 30,
"weekStart": ""
}

![laravel DB::connection 报错 Database connection [{$name}] not configured](https://img-blog.csdnimg.cn/direct/3b51198e3e83445d9ecac0a6729c278e.png)