- 一、 promethues概念
- prometheus介绍
- promethues的特点
- prometheus的工作原理
- prometheus的架构
- 二、promethues和zabbix的区别
- 三、prometheus安装部署
- prometheus下载安装
- prometheus启动
- 浏览器访问
- 查看暴露指标
- 将Prometheus配置为systemd管理
- 配置node_exporter监控项
- node_prometheus安装下载
- 配置systemctl启动node_exporter
- 修改prometheus配置文件,重启
- 配置mysql-exporter监控项
- 安装mysqld-exporter
- 启动mysqld-exporter
- 普罗米修斯`服务端`配置文件添加监控项
- 可视化工具Grafana
一、 promethues概念
prometheus_3">prometheus介绍
promethues是一个开源的系统监控和报警系统,现在已经加入到CNCF基金会,成为继k8s之后第二个在CNCF托管的项目,在kubernetes容器管理系统中,通常会搭配prometheus进行监控,同时也支持多种exporter采集数据,还支持pushgateway进行数据上报,Prometheus性能足够支撑上万台规模的集群。
promethues的特点

prometheus_8">prometheus的工作原理
Prometheus server 定期从静态配置的 targets 或者服务发现的 targets 拉取数据。
当新拉取的数据大于配置内存缓存区的时候,Prometheus 会将数据持久化到磁盘(如果使用 remote storage 将持久化到云端)。
Prometheus 可以配置 rules,然后定时查询数据,当条件触发的时候,会将 alert 推送到配置的 Alertmanager
Alertmanager 收到警告的时候,可以根据配置,聚合,去重,降噪,最后发送警告。
可以使用 API, Prometheus Console 或者 Grafana 查询和聚合数据。
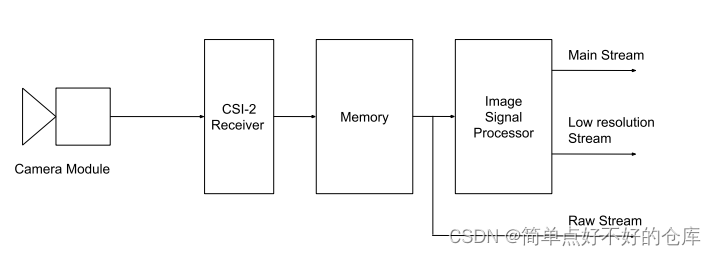
prometheus_15">prometheus的架构
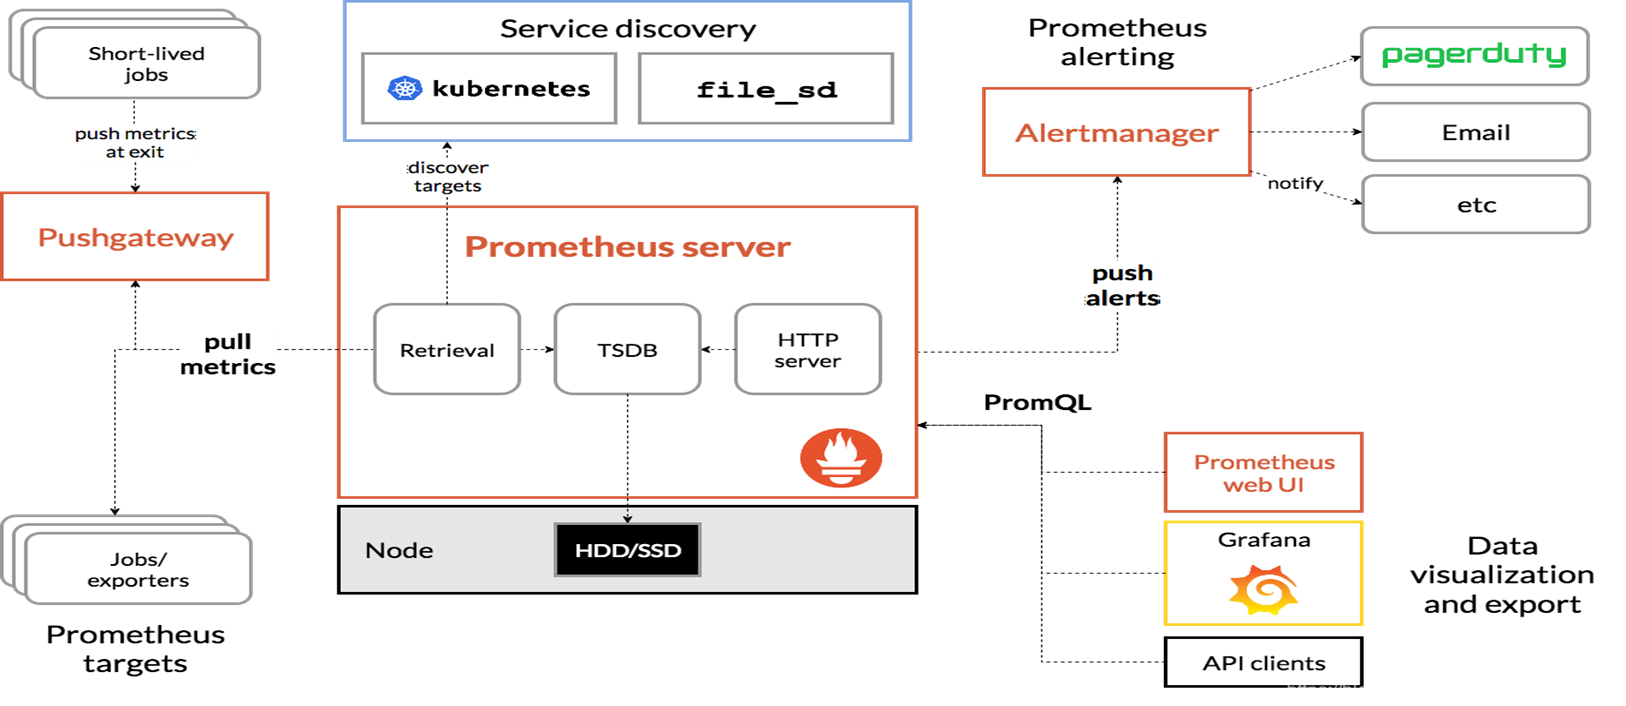
1)Prometheus Server: 用于收集和存储时间序列数据。
2)pushgateway: 各个目标主机可上报数据到pushgateway,然后prometheus server统一从pushgateway拉取数据
3)Exporters: prometheus支持多种exporter,通过exporter可以采集metrics数据,然后发送到prometheus server端,所有向promtheus server提供监控数据的程序都可以被称为exporter
4)Alertmanager: 从 Prometheus server 端接收到 alerts 后,会进行去重,分组,并路由到相应的接收方,发出报警,常见的接收方式有:电子邮件,微信,钉钉等。
5)Client Library: 客户端库,检测应用程序代码,当Prometheus抓取实例的HTTP端点时,客户端库会将所有跟踪的metrics指标的当前状态发送到prometheus server端。
6)Grafana(一个开源的数据可视化工具):监控仪表盘,可视化监控数据
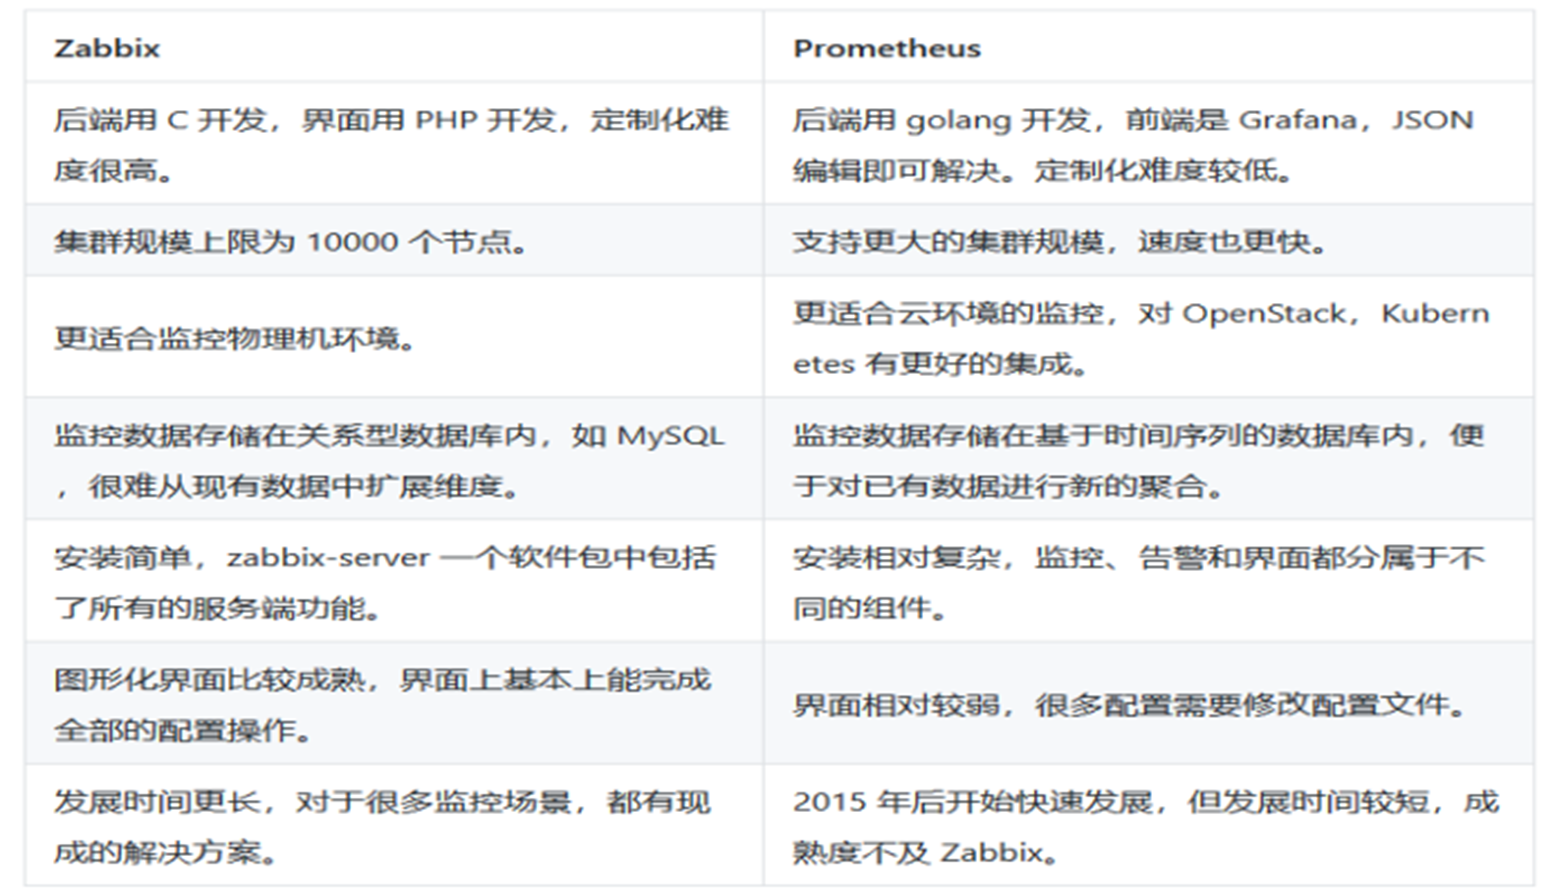
zabbix_30">二、promethues和zabbix的区别
prometheus_33">三、prometheus安装部署
prometheus_34">prometheus下载安装
#下载安装包
[root@prometheus ~]#  wget https://github.com/prometheus/prometheus/releases/download/v2.47.2/prometheus-2.47.2.linux-amd64.tar.gz
[root@prometheus ~]# tar -xf prometheus-2.47.2.linux-amd64.tar.gz -C /usr/local
[root@prometheus ~]# cd /usr/local
[root@prometheus local]# mv prometheus-2.47.2.linux-amd64/ prometheus
[root@prometheus local]# cd prometheus/
[root@prometheus prometheus]# ./prometheus --version
prometheus, version 2.47.2 (branch: HEAD, revision: 3f3172cde1ee37f1c7b3a5f3d9b031190509b3ad)
  build user:       root@79f2ad339b75
  build date:       20231012-16:07:10
  go version:       go1.21.3
  platform:         linux/amd64
  tags:             netgo,builtinassets,stringlabels
prometheus_50">prometheus启动
#protheus启动
[root@prometheus prometheus]# ./prometheus --config.file=prometheus.yml
[root@prometheus ~]# ss -nplt
State      Recv-Q Send-Q              Local Address:Port                             Peer Address:Port
LISTEN     0      128                             *:22                                          *:*                   users:(("sshd",pid=939,fd=3))
LISTEN     0      100                     127.0.0.1:25                                          *:*                   users:(("master",pid=1148,fd=13))
LISTEN     0      128                          [::]:9090                                     [::]:*                   users:(("prometheus",pid=1550,fd=7))
LISTEN     0      128                          [::]:22                                       [::]:*                   users:(("sshd",pid=939,fd=4))
LISTEN     0      100                         [::1]:25                                       [::]:*                   users:(("master",pid=1148,fd=14))
浏览器访问
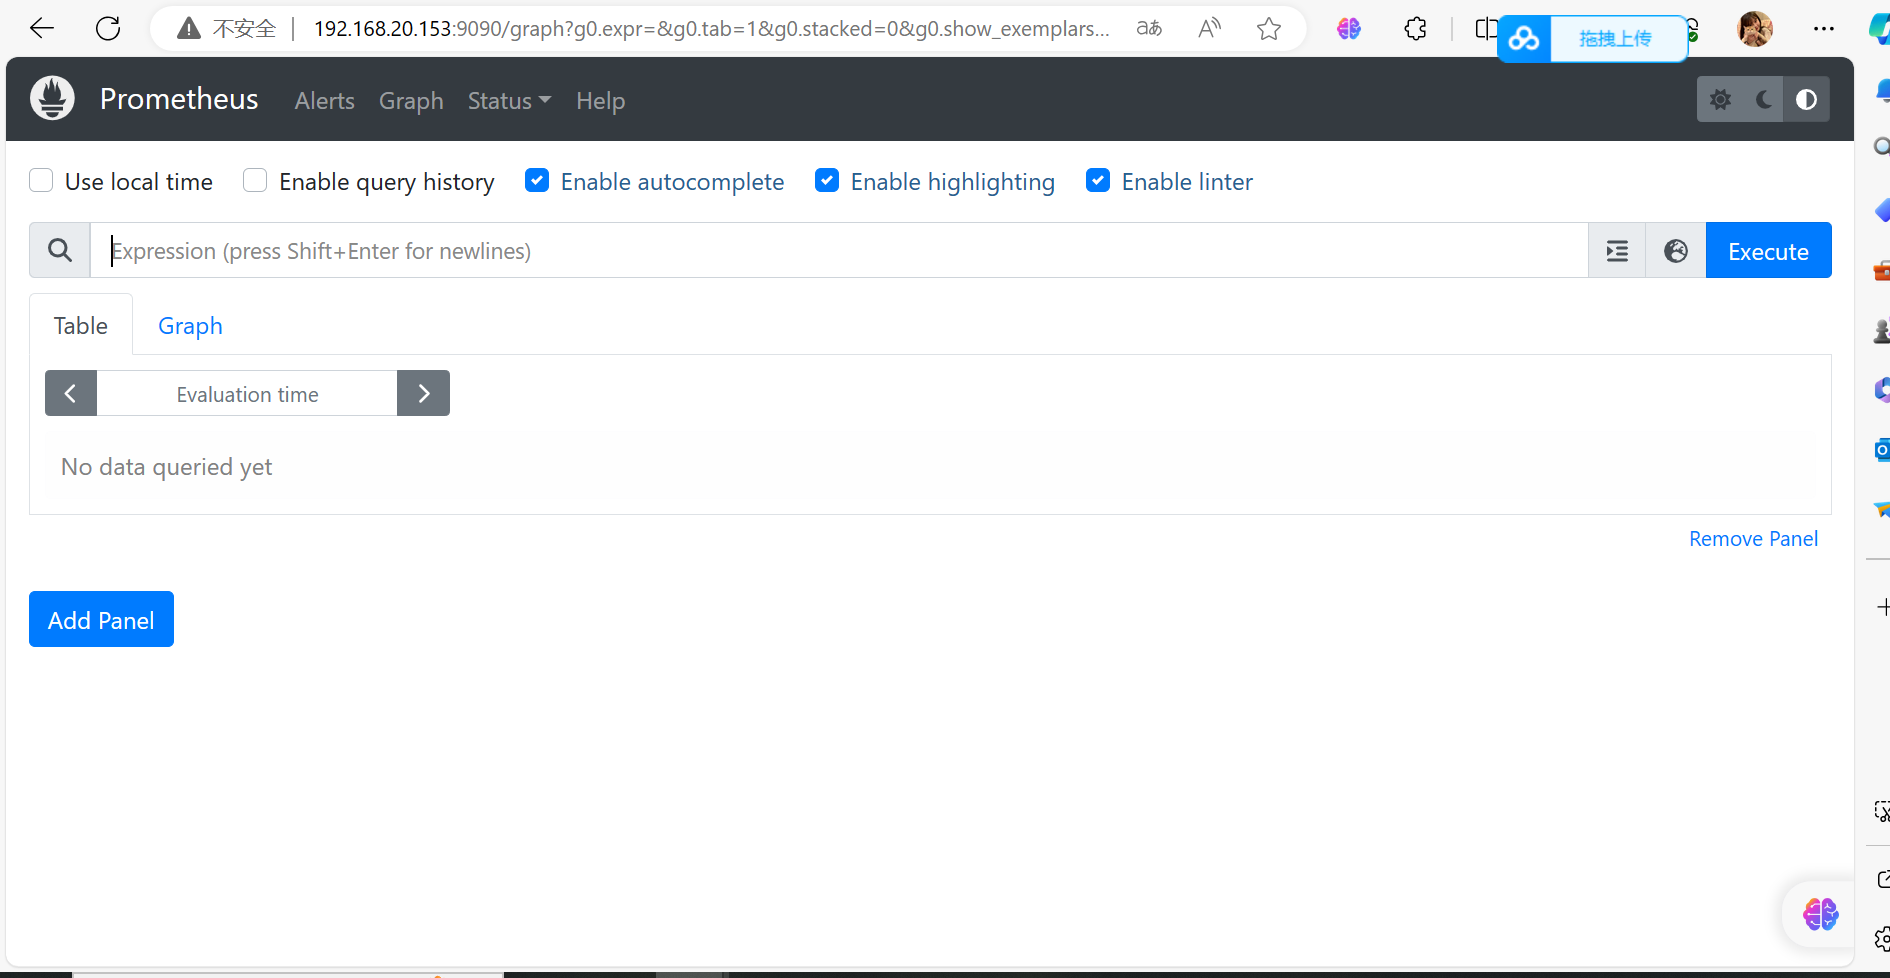
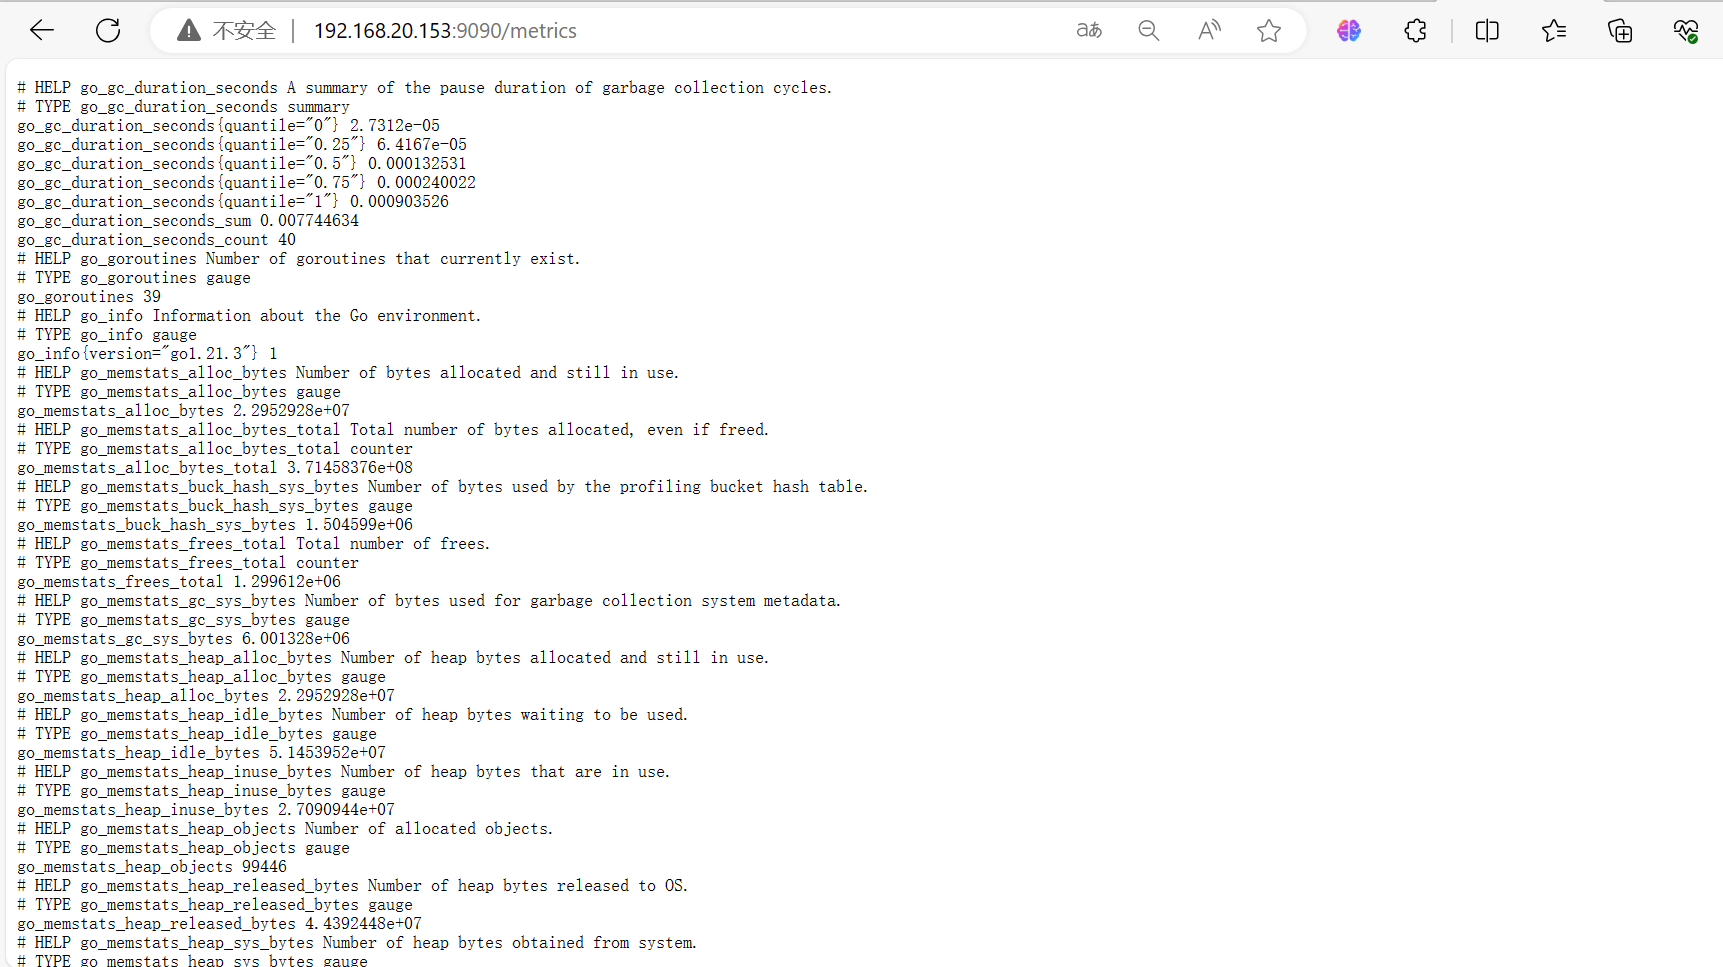
查看暴露指标
http://192.168.20.153:9090/metrics
将Prometheus配置为systemd管理
[root@prometheus ~]# vim /usr/lib/systemd/system/prometheus.service

[root@prometheus ~]# systemctl daemon-reload
[root@prometheus ~]# systemctl start prometheus
[root@prometheus ~]# ss -tlanp |grep 9090
LISTEN     0      128       [::]:9090                  [::]:*                   users:(("prometheus",pid=1550,fd=7))
ESTAB      0      0        [::1]:57360                [::1]:9090                users:(("prometheus",pid=1550,fd=11))
ESTAB      0      0        [::1]:9090                 [::1]:57360               users:(("prometheus",pid=1550,fd=12))
ESTAB      0      0      [::ffff:192.168.20.153]:9090                 [::ffff:192.168.20.1]:63447               users:(("prometheus",pid=1550,fd=13))
ESTAB      0      0      [::ffff:192.168.20.153]:9090                 [::ffff:192.168.20.1]:63451               users:(("prometheus",pid=1550,fd=15))
ESTAB      0      0      [::ffff:192.168.20.153]:9090                 [::ffff:192.168.20.1]:63449               users:(("prometheus",pid=1550,fd=14))
配置node_exporter监控项
prometheus_85">node_prometheus安装下载
[root@localhost ~]# wget https://github.com/prometheus/node_exporter/releases/download/v1.7.0/node_exporter-1.7.0.linux-amd64.tar.gz
[root@localhost ~]# tar -xf node_exporter-1.7.0.linux-amd64.tar.gz -C /usr/local/
[root@localhost ~]# cd /usr/local
[root@localhost local]# mv node_exporter-1.7.0.linux-amd64/ node
[root@localhost local]# cd node
[root@localhost node]# ./node_exporter &
[root@localhost node]# ss -tlnp  | grep 9100
LISTEN     0      128       [::]:9100                  [::]:*                   users:(("node_exporter",pid=1515,fd=3))
配置systemctl启动node_exporter
[root@localhost node]# vim /usr/lib/systemd/system/node_exporter.service
[Unit]
Description=node_exporter
After=network.target

[Service]
ExecStart=/usr/local/node_exporter/node_exporter
Restart=on-failure

[Install]
WantedBy=multi-user.target
[root@localhost node]# systemctl daemon-reload
[root@localhost node]# systemctl start node_exporter
[root@localhost node]# ss -tlnp  | grep 9100
LISTEN     0      128       [::]:9100                  [::]:*                   users:(("node_exporter",pid=11178,fd=3))
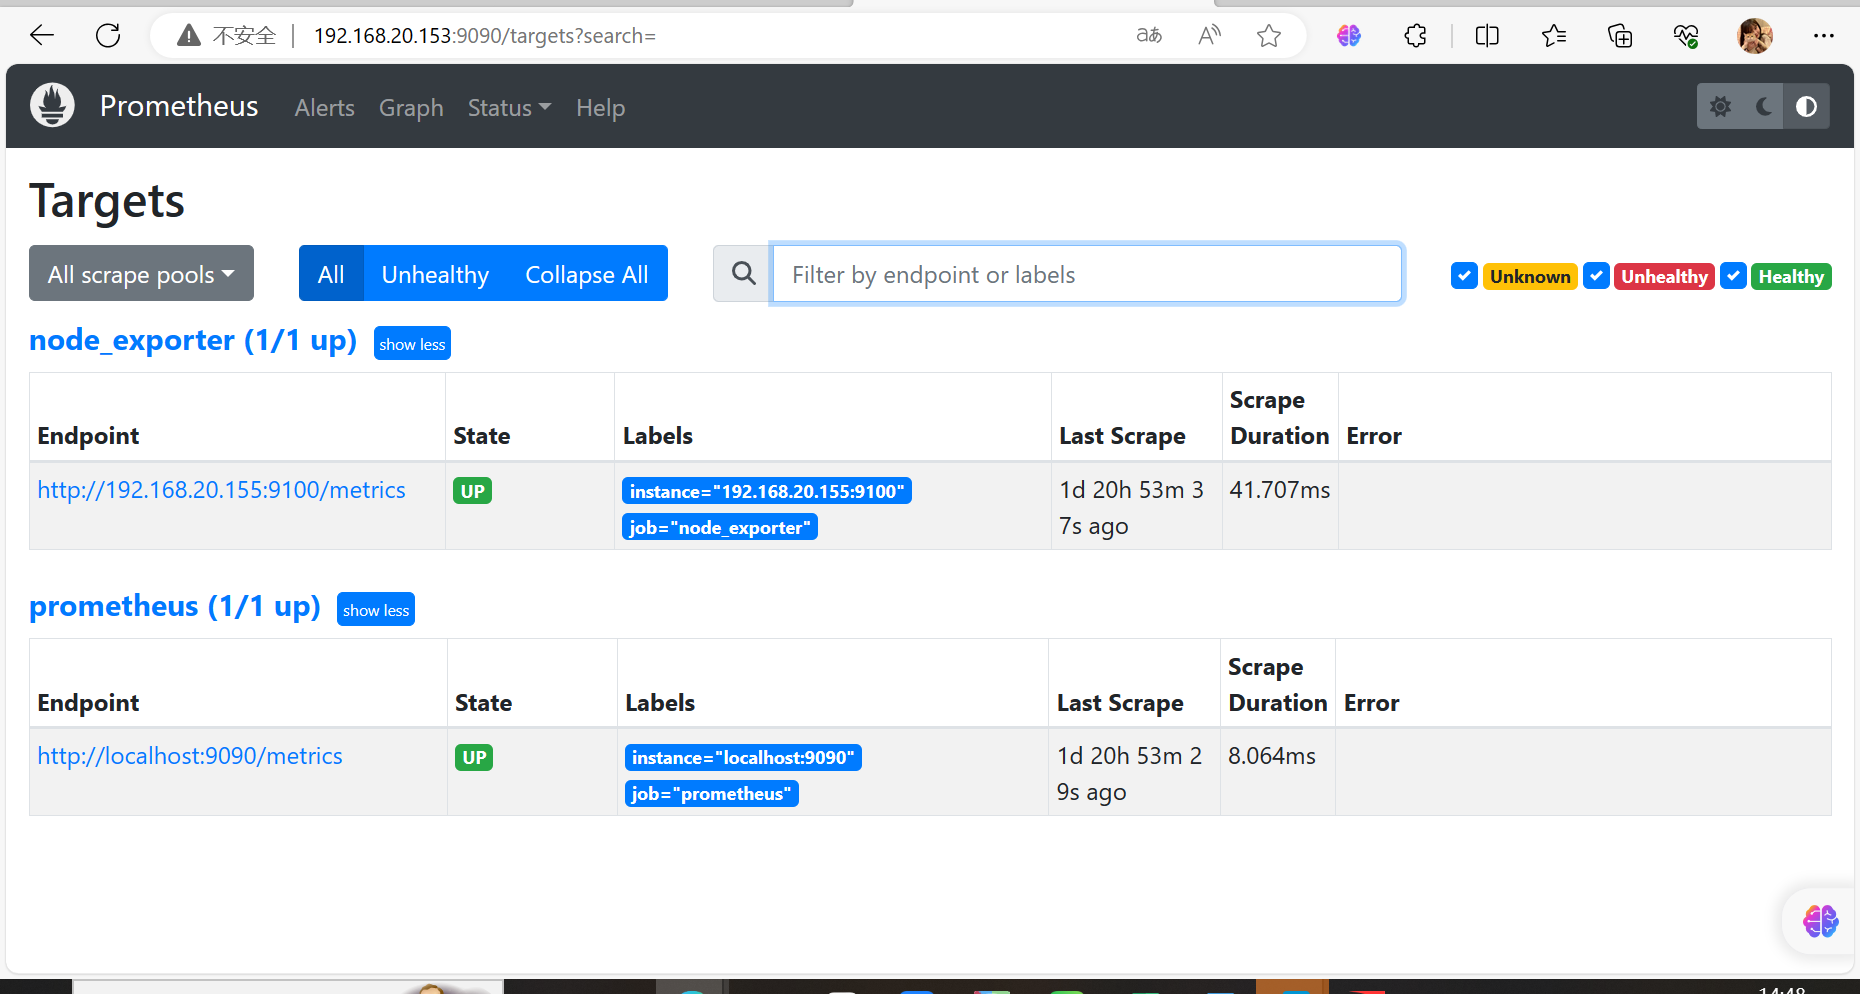
prometheus_115">修改prometheus配置文件,重启
[root@prometheus prometheus]# vim prometheus.yml
 - targets: ["localhost:9090"]
  - job_name: "node"
    static_configs:
      - targets: ["192.168.20.155:9100']
# 重启服务
[root@prometheus prometheus]# systemctl restart prometheus
配置mysql-exporter监控项
安装mysqld-exporter
# 安装mysqld-exporter
[root@localhost ~]# wget https://github.com/prometheus/mysqld_exporter/releases/download/v0.15.0/mysqld_exporter-0.15.0.linux-amd64.tar.gz
[root@localhost ~]# tar xf mysqld_exporter-0.15.0.linux-amd64.tar.gz -C /usr/local/
[root@localhost local]# mv mysqld_exporter-0.15.0.linux-amd64 mysqld_exporter
[root@localhost mysqld_exporter]# vim .my.cnf
[client]
user=root
password=Qianfeng@123
启动mysqld-exporter
启动mysqld-exporter
[root@localhost mysqld_exporter]# ./mysqld_exporter --config.my-cnf="/usr/local/mysqld_exporter/.my.cnf" &
[root@localhost mysqld_exporter]# ps -ef |grep mysqld_exporter
root       3447   3398  0 01:31 pts/1    00:00:02 ./node_exporter
root       4647   3398  0 02:13 pts/1    00:00:00 ./mysqld_exporter --config.my-cnf=/usr/local/mysqld_exporter/.my.cnf

[root@localhost mysqld_exporter]# ss -lntp |grep 4647
LISTEN     0      128         :::9104                    :::*                   users:(("mysqld_exporter",pid=4647,fd=
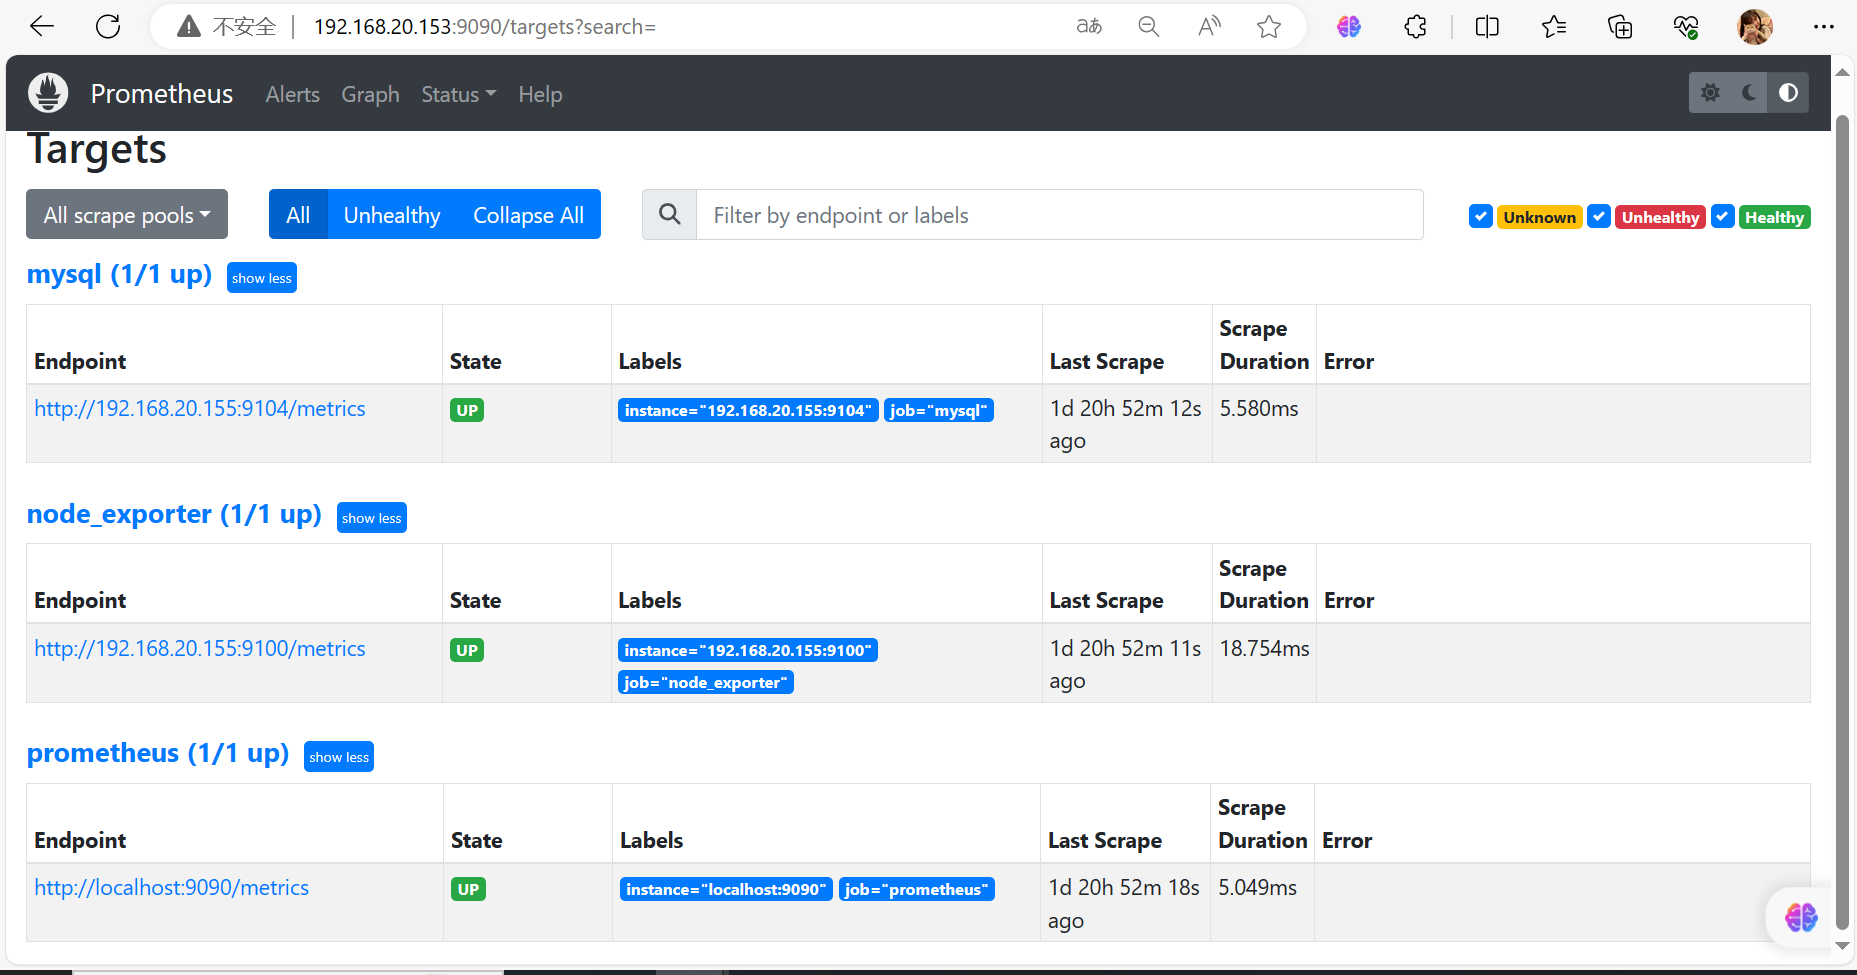
普罗米修斯服务端配置文件添加监控项
[root@prometheus prometheus]# vim prometheus.yml
  - job_name: 'mysql'
    static_configs:
    - targets: ['192.168.2.44:9104']

[root@prometheus prometheus]# systemctl restart prometheus
node_memory_MemTotal_bytes{job="node_exporter", instance="192.168.20.155:9100"}
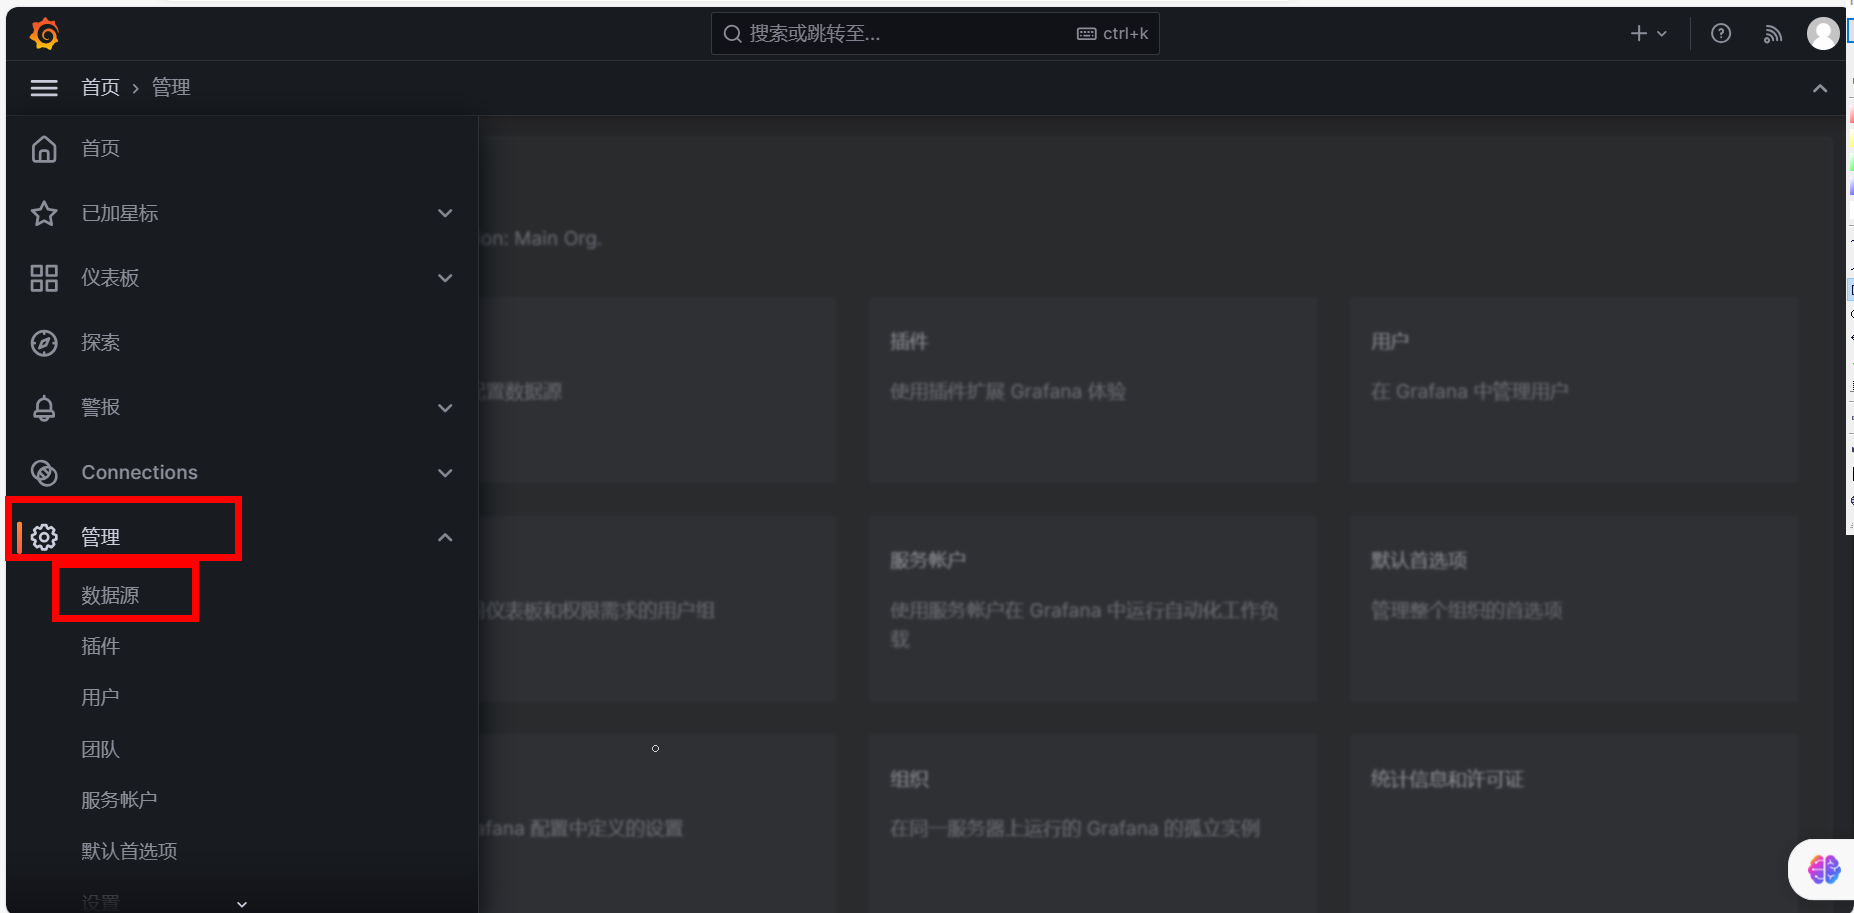
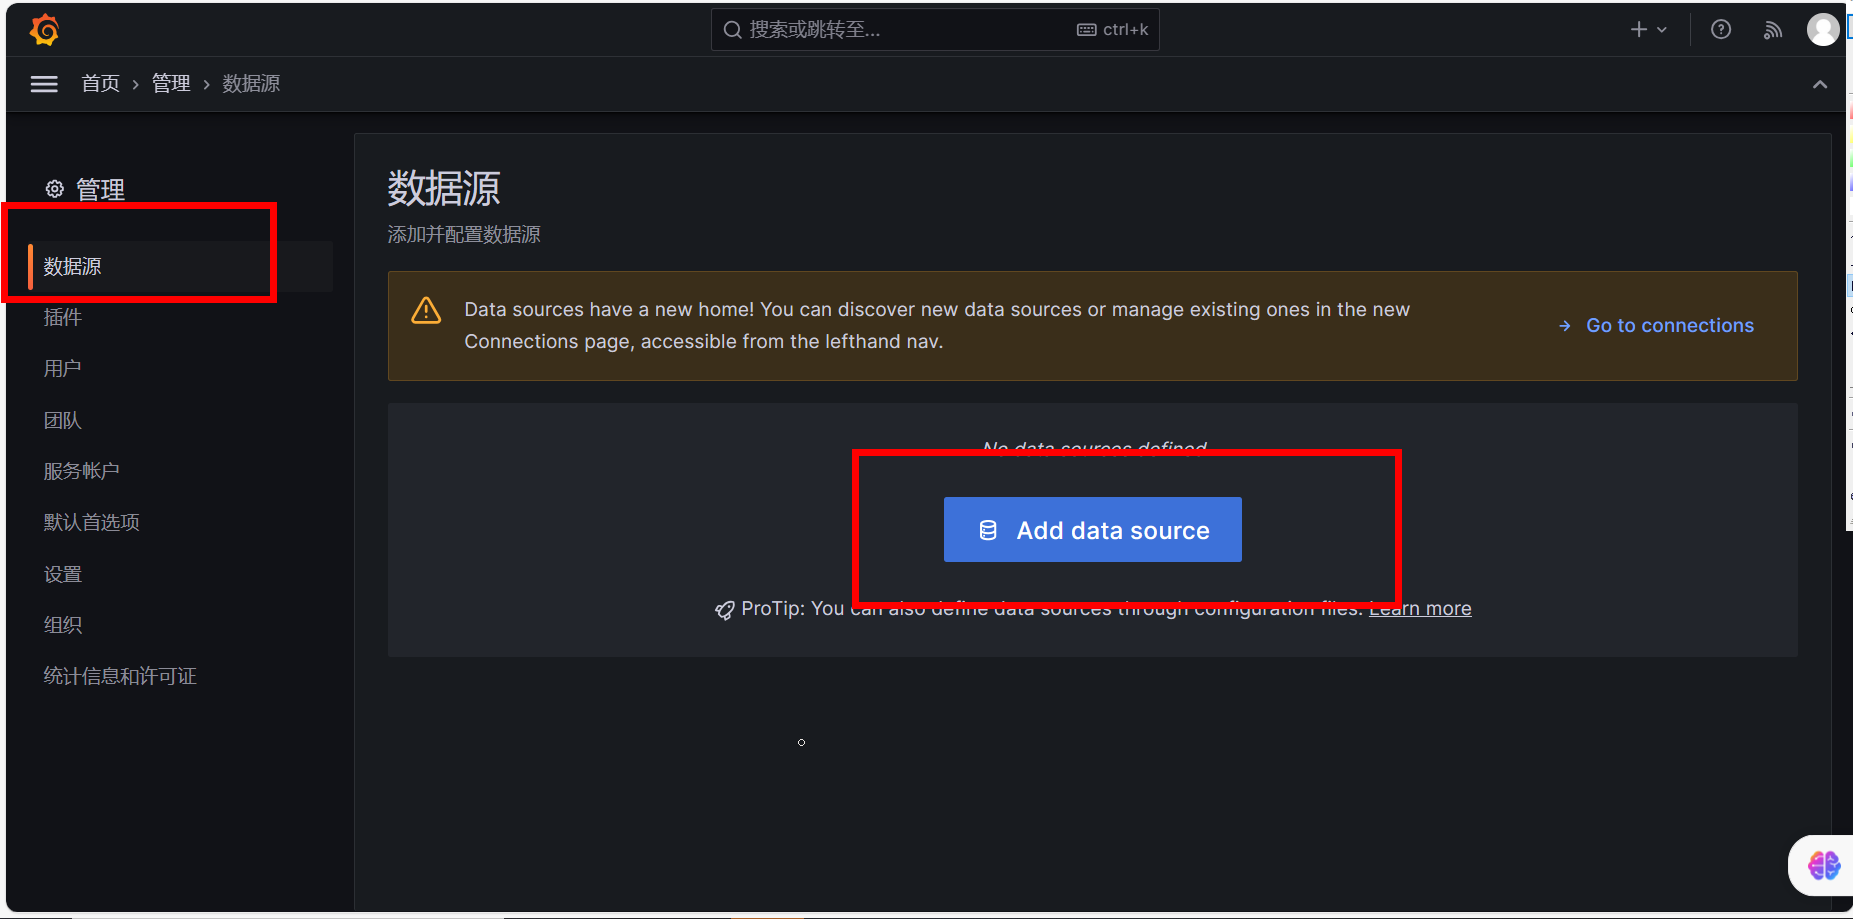
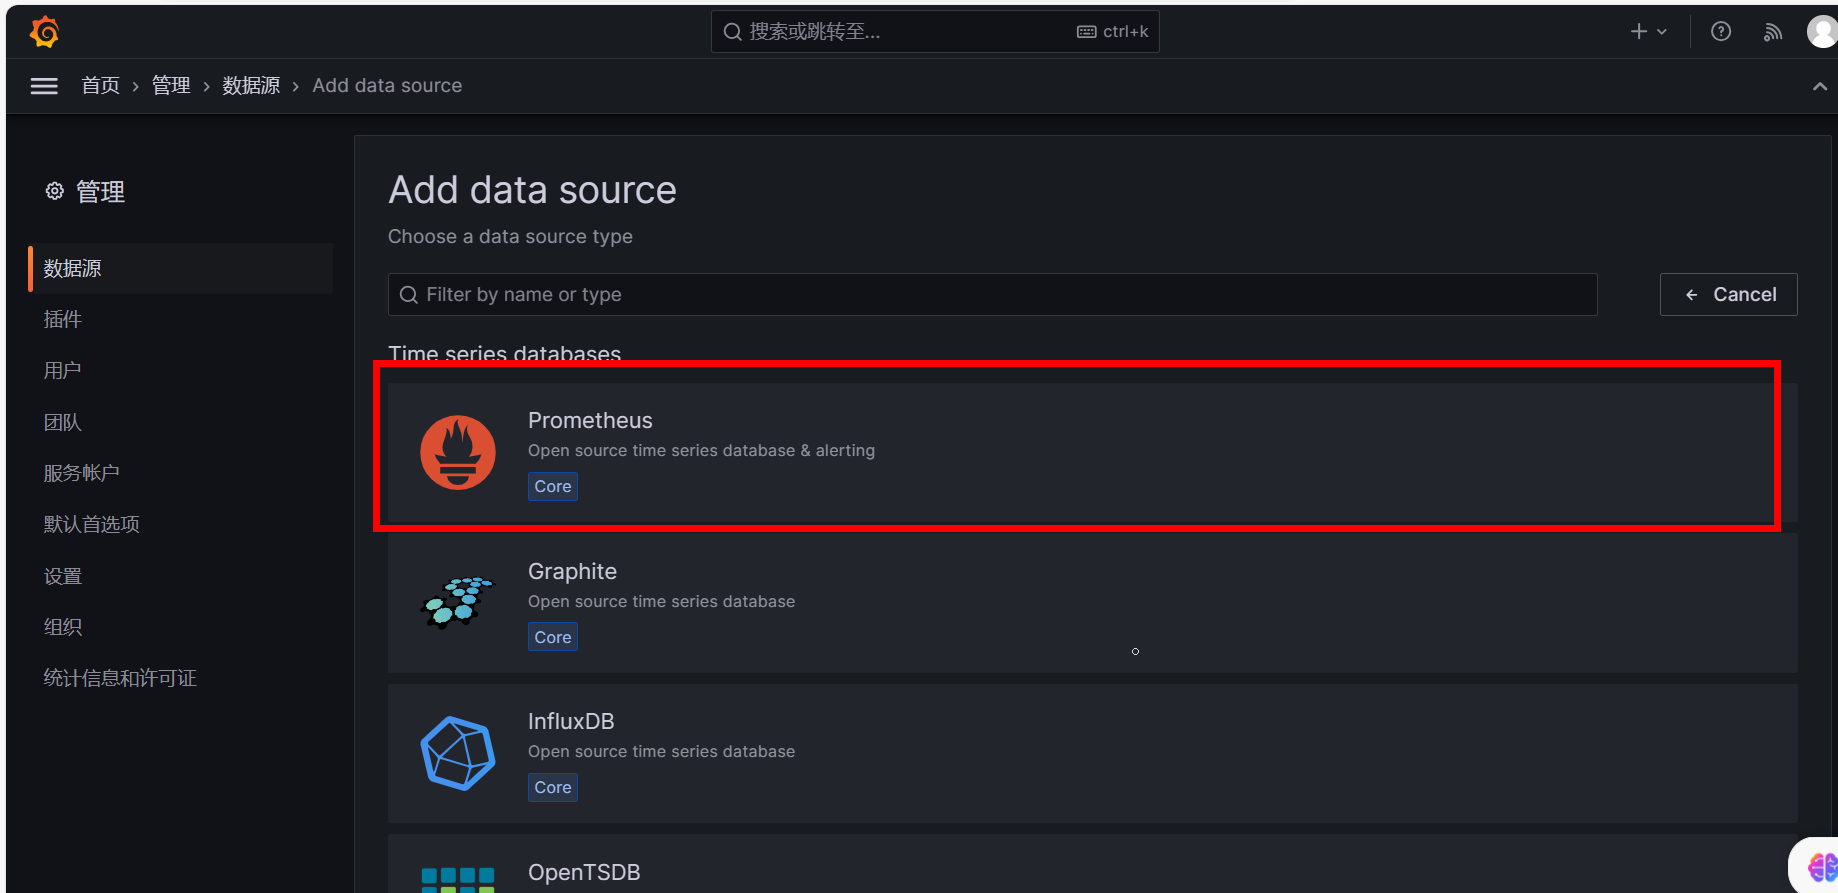
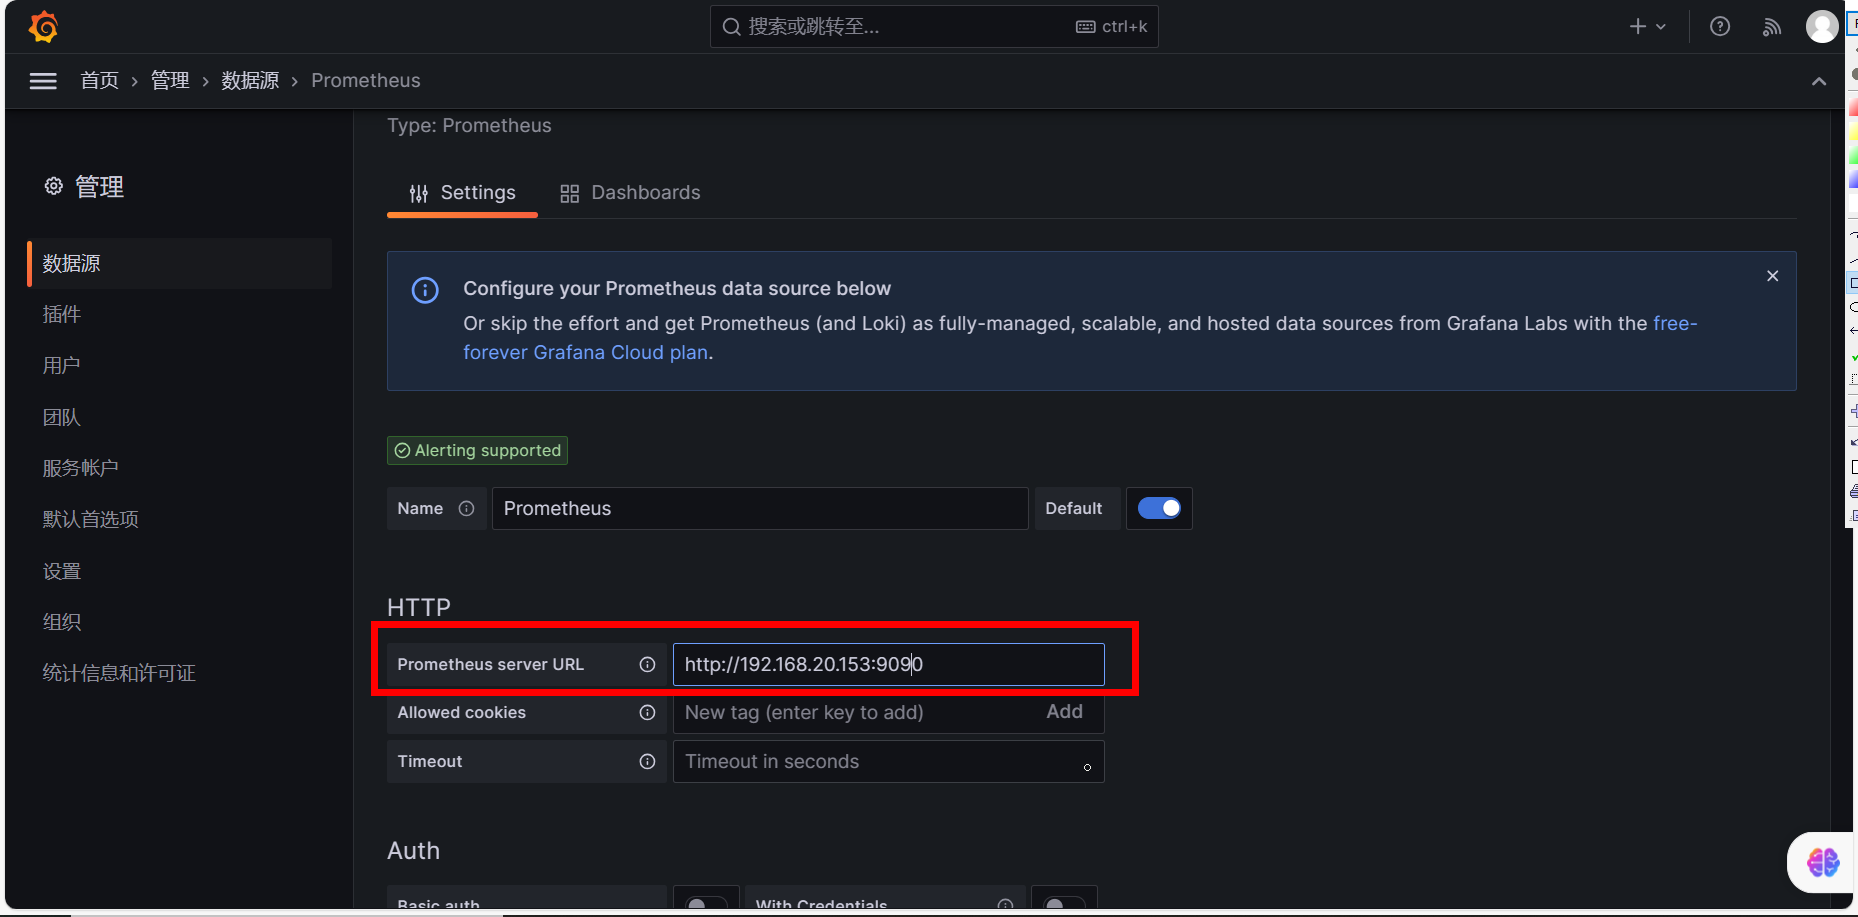
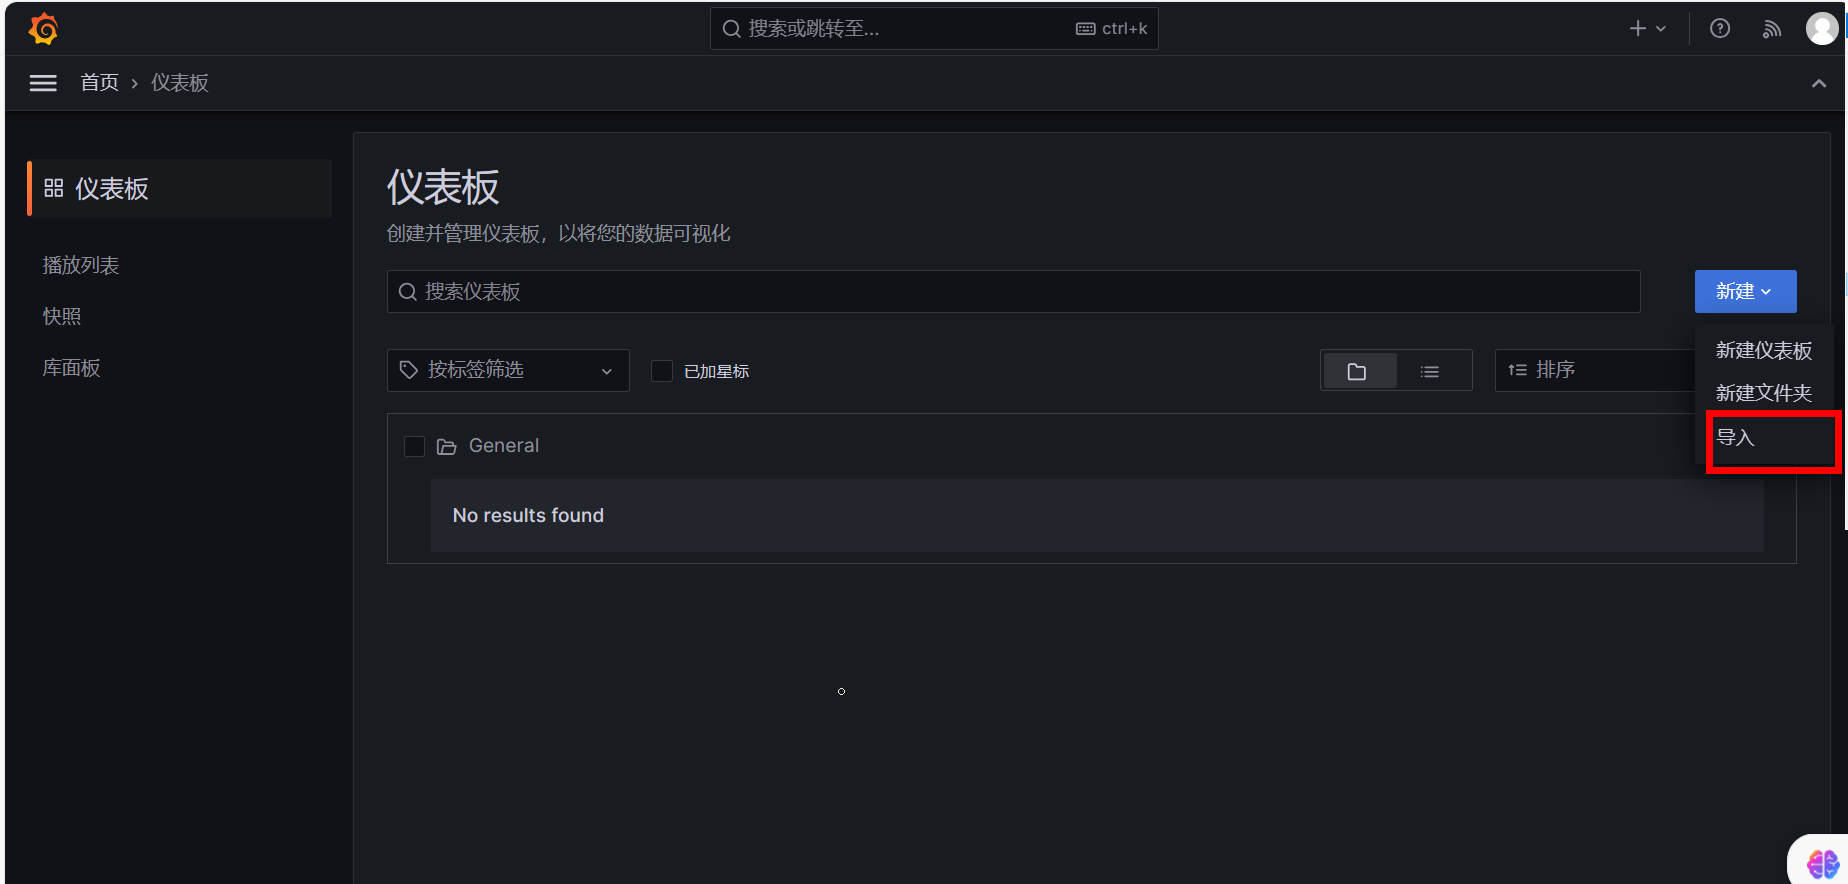
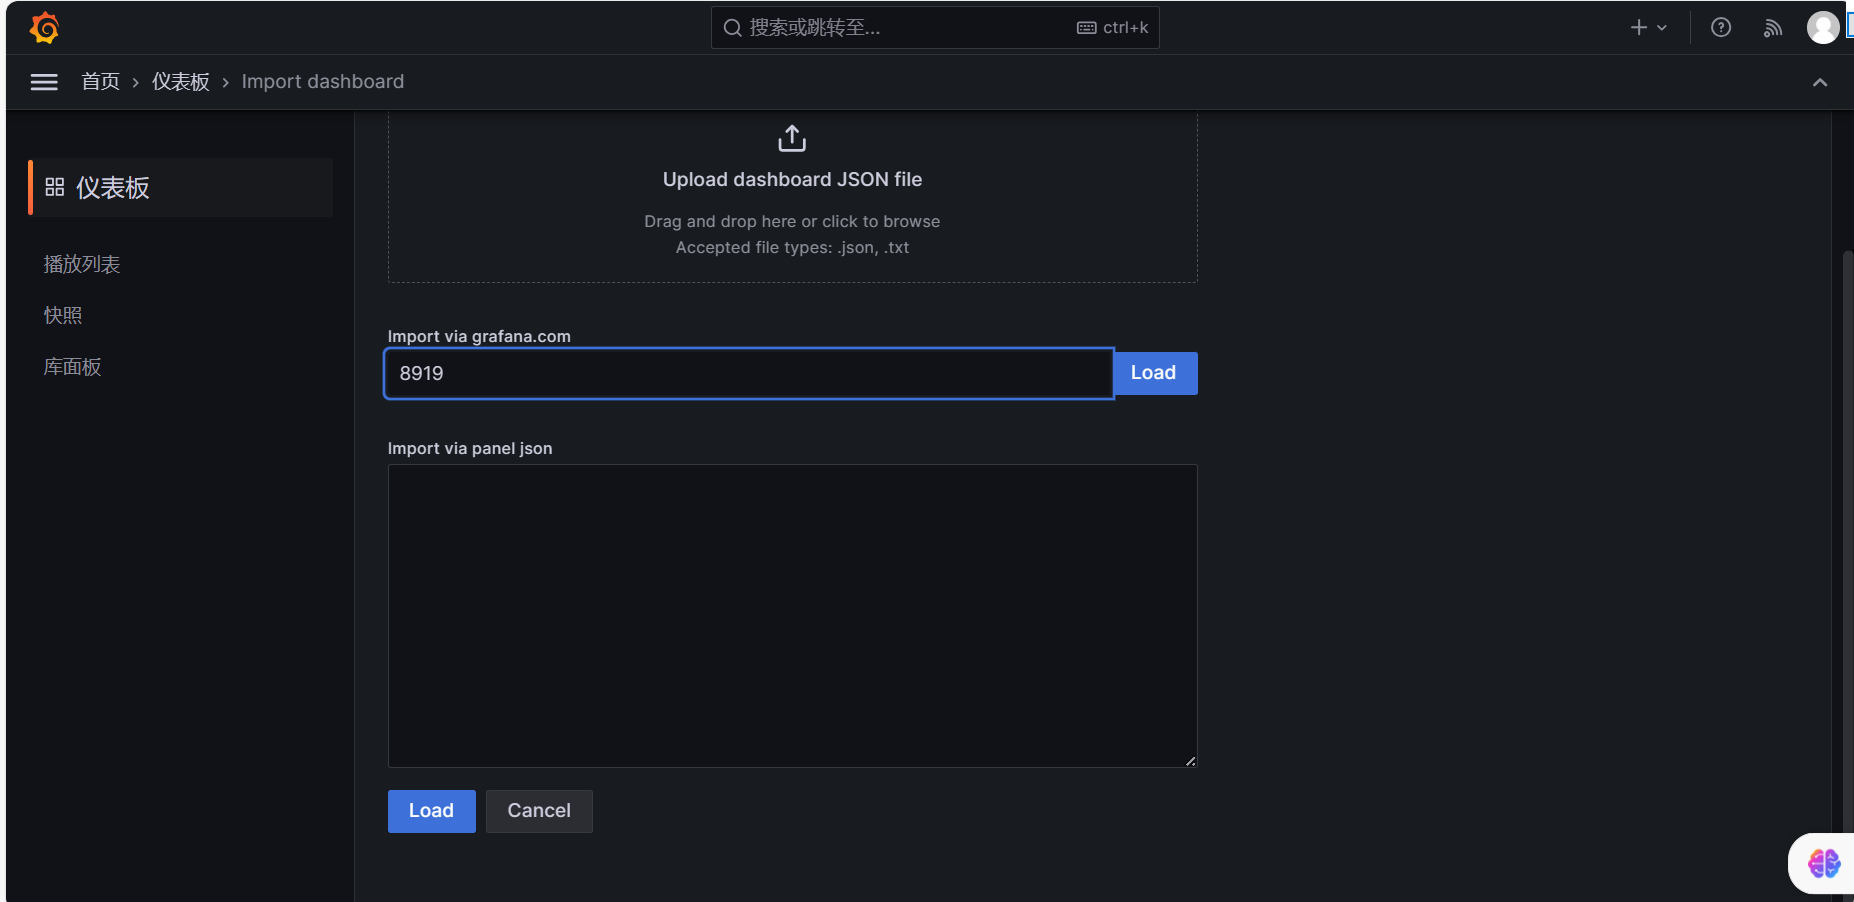
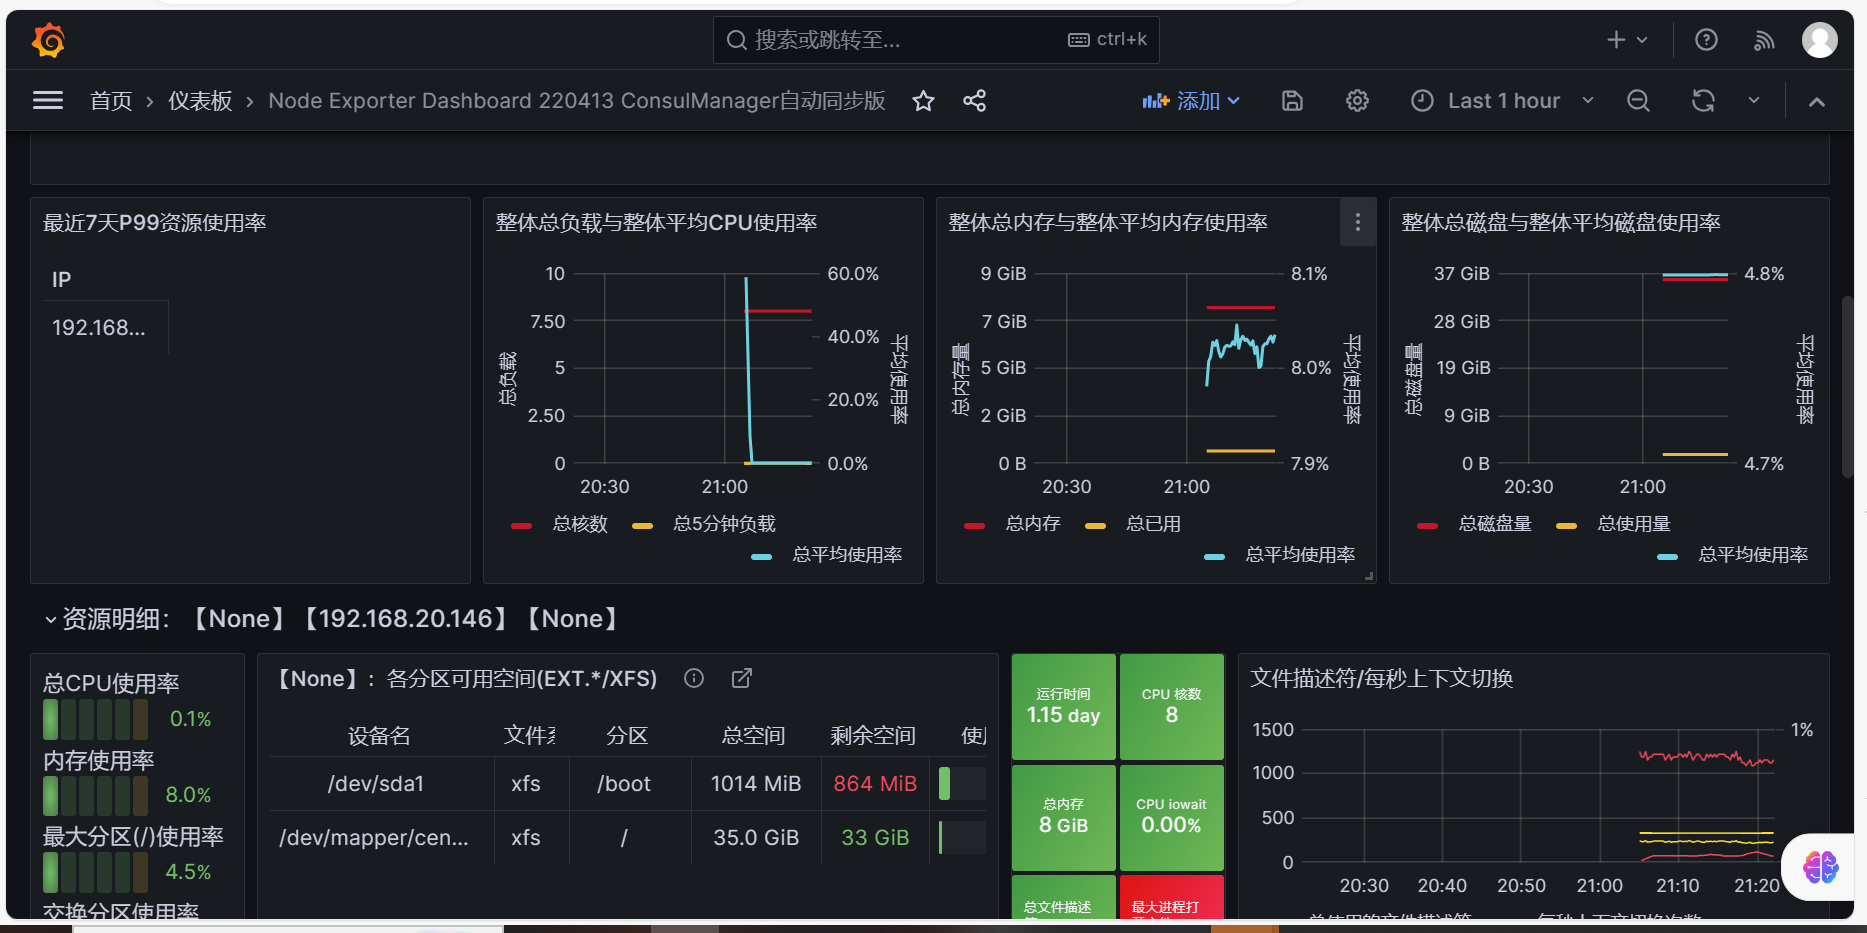
可视化工具Grafana
使用Grafana展示Prometheus 数据
[root@prometheus ~]# wget https://mirrors.tuna.tsinghua.edu.cn/grafana/yum/rpm/Packages/grafana-10.0.0-1.x86_64.rpm
[root@prometheus ~]# yum install initscripts fontconfig -y
[root@prometheus ~]# yum install -y grafana-10.0.0-1.x86_64.rpm
[root@prometheus ~]# systemctl status grafana-server.service
[root@prometheus ~]# ss -tlanp |grep grafana |grep LISTEN
LISTEN     0      1024      [::]:3000                  [::]:*                   users:(("grafana",pid=10629,fd=11))
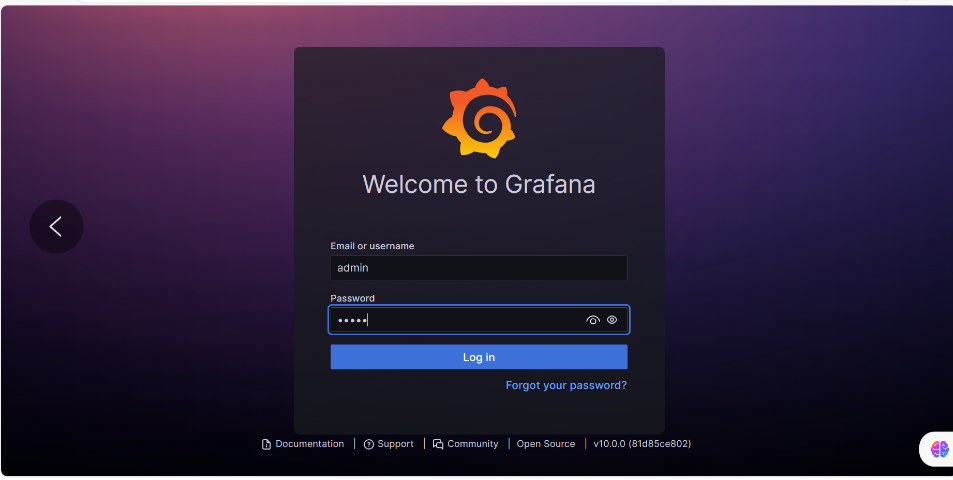
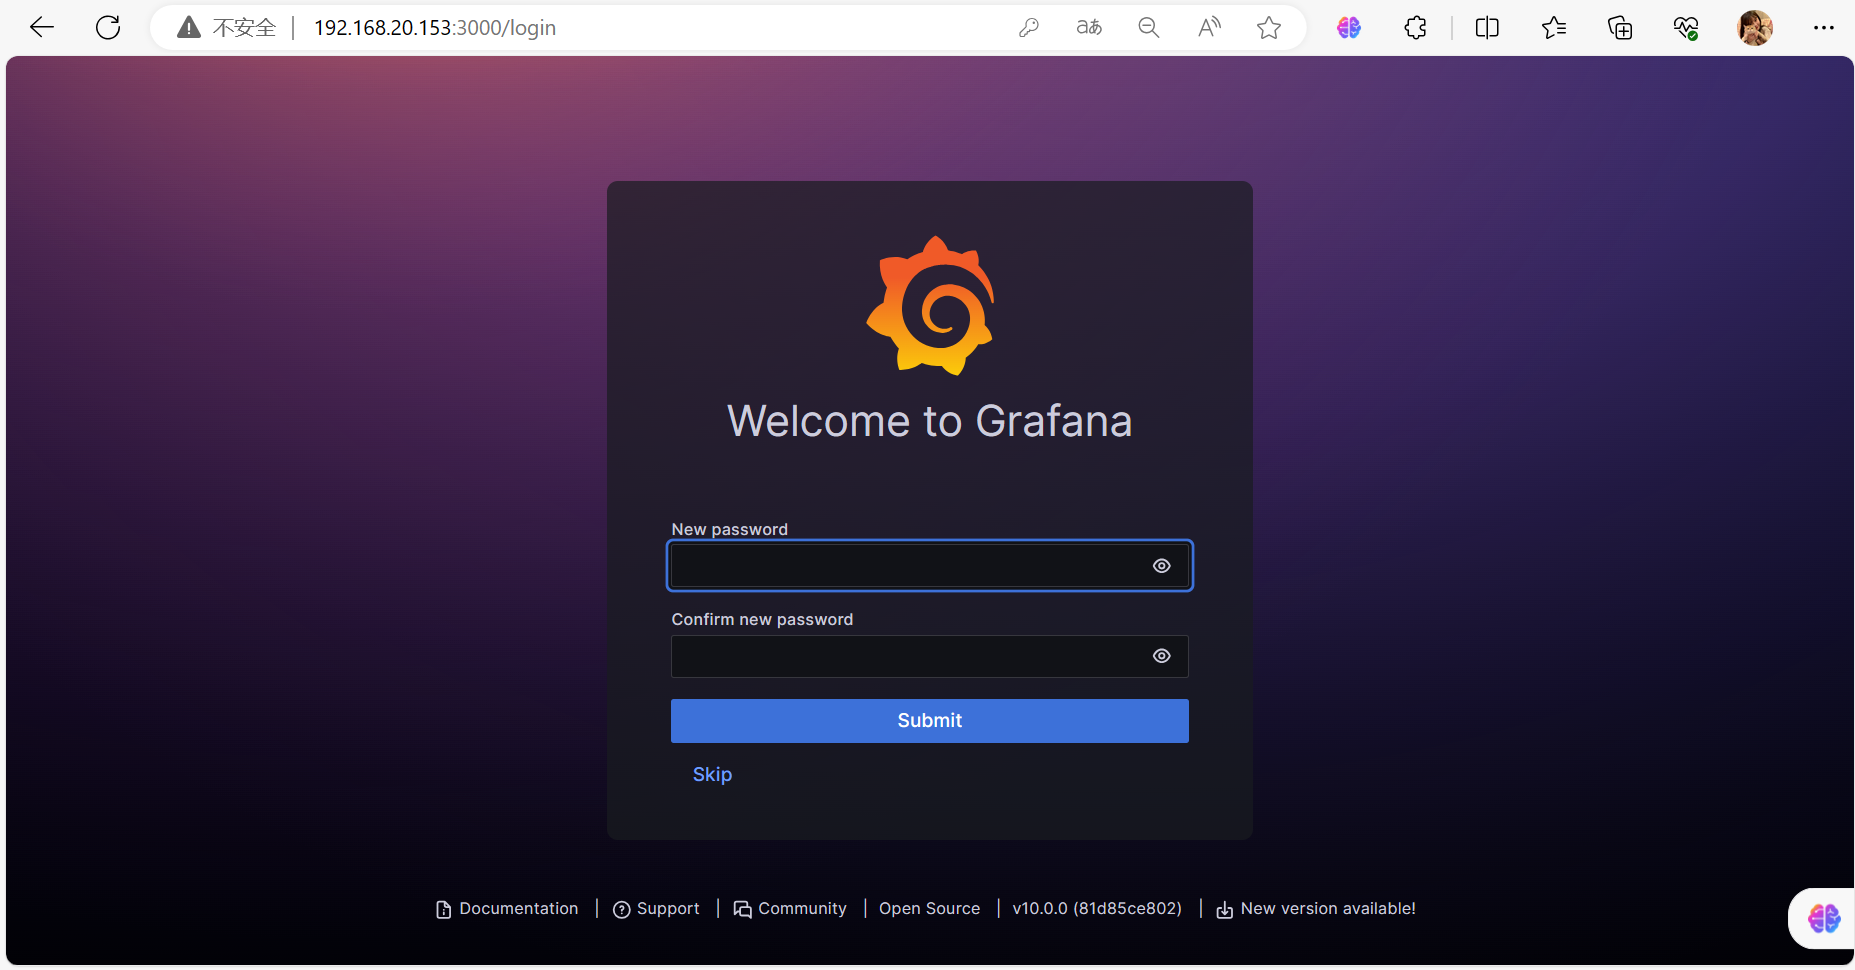
启动后访问地址:ip:3000
初始用户名和密码都是admin
更改密码
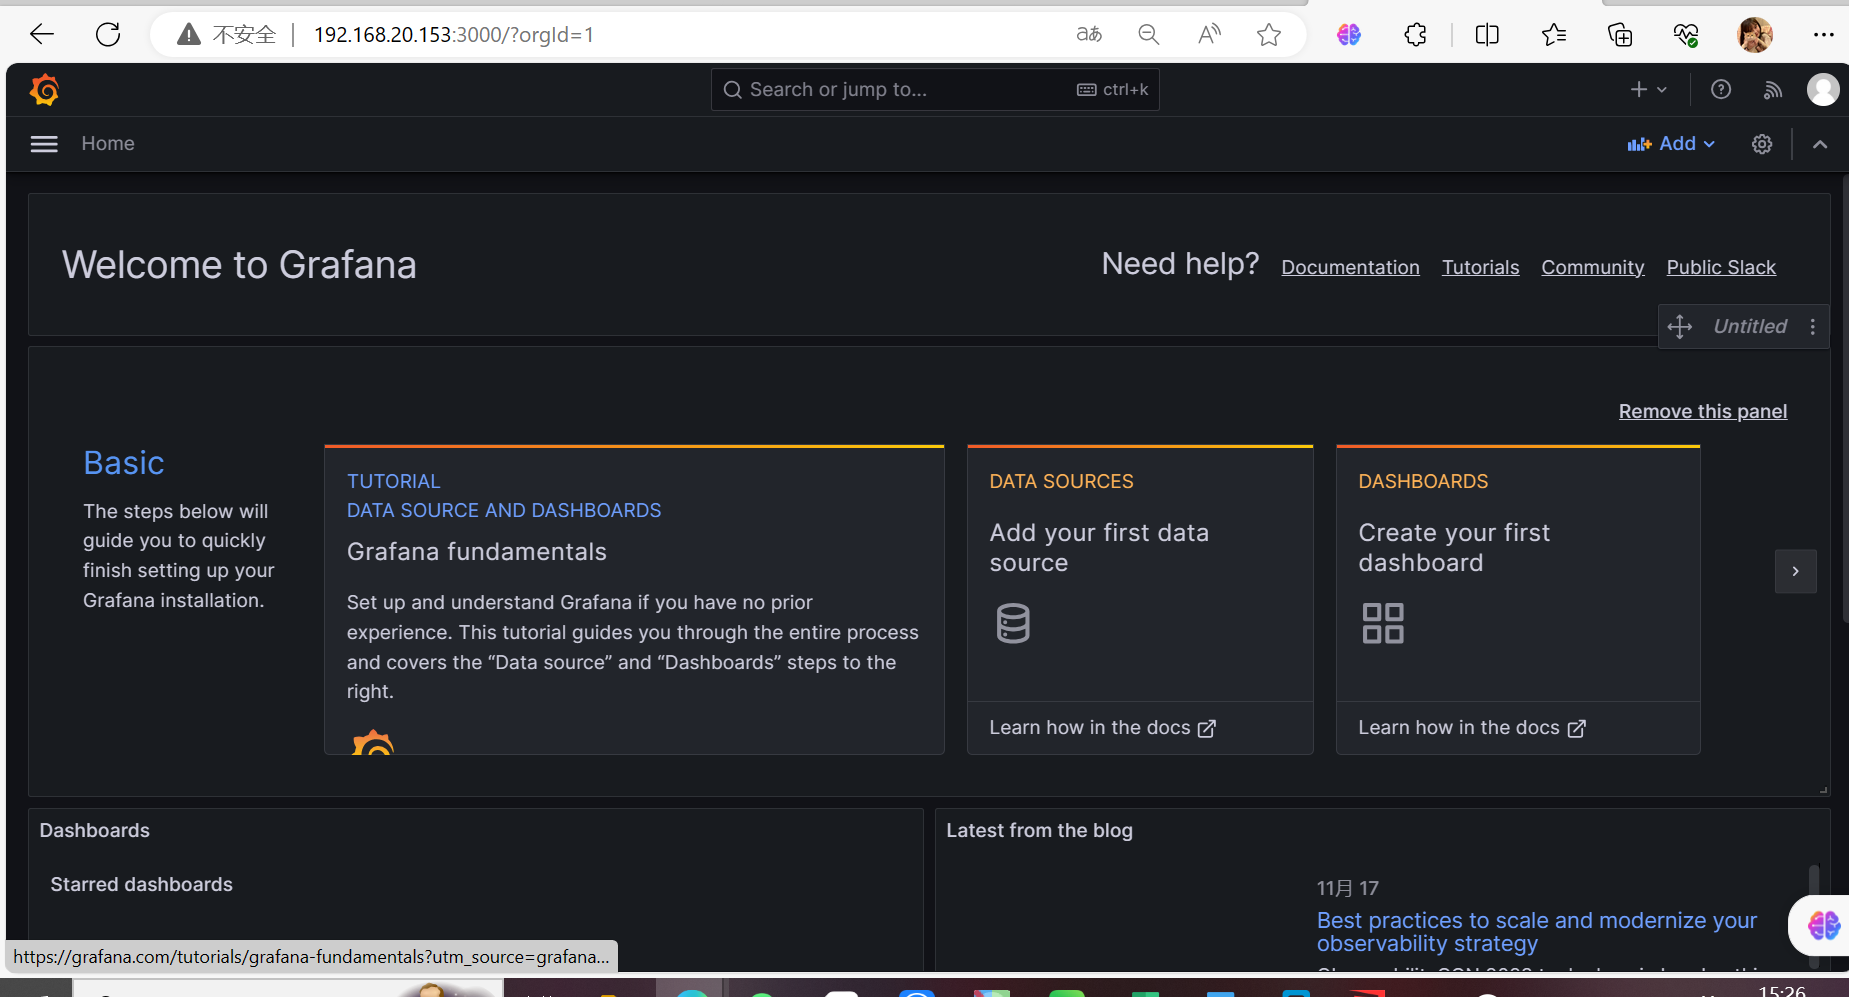
主页面
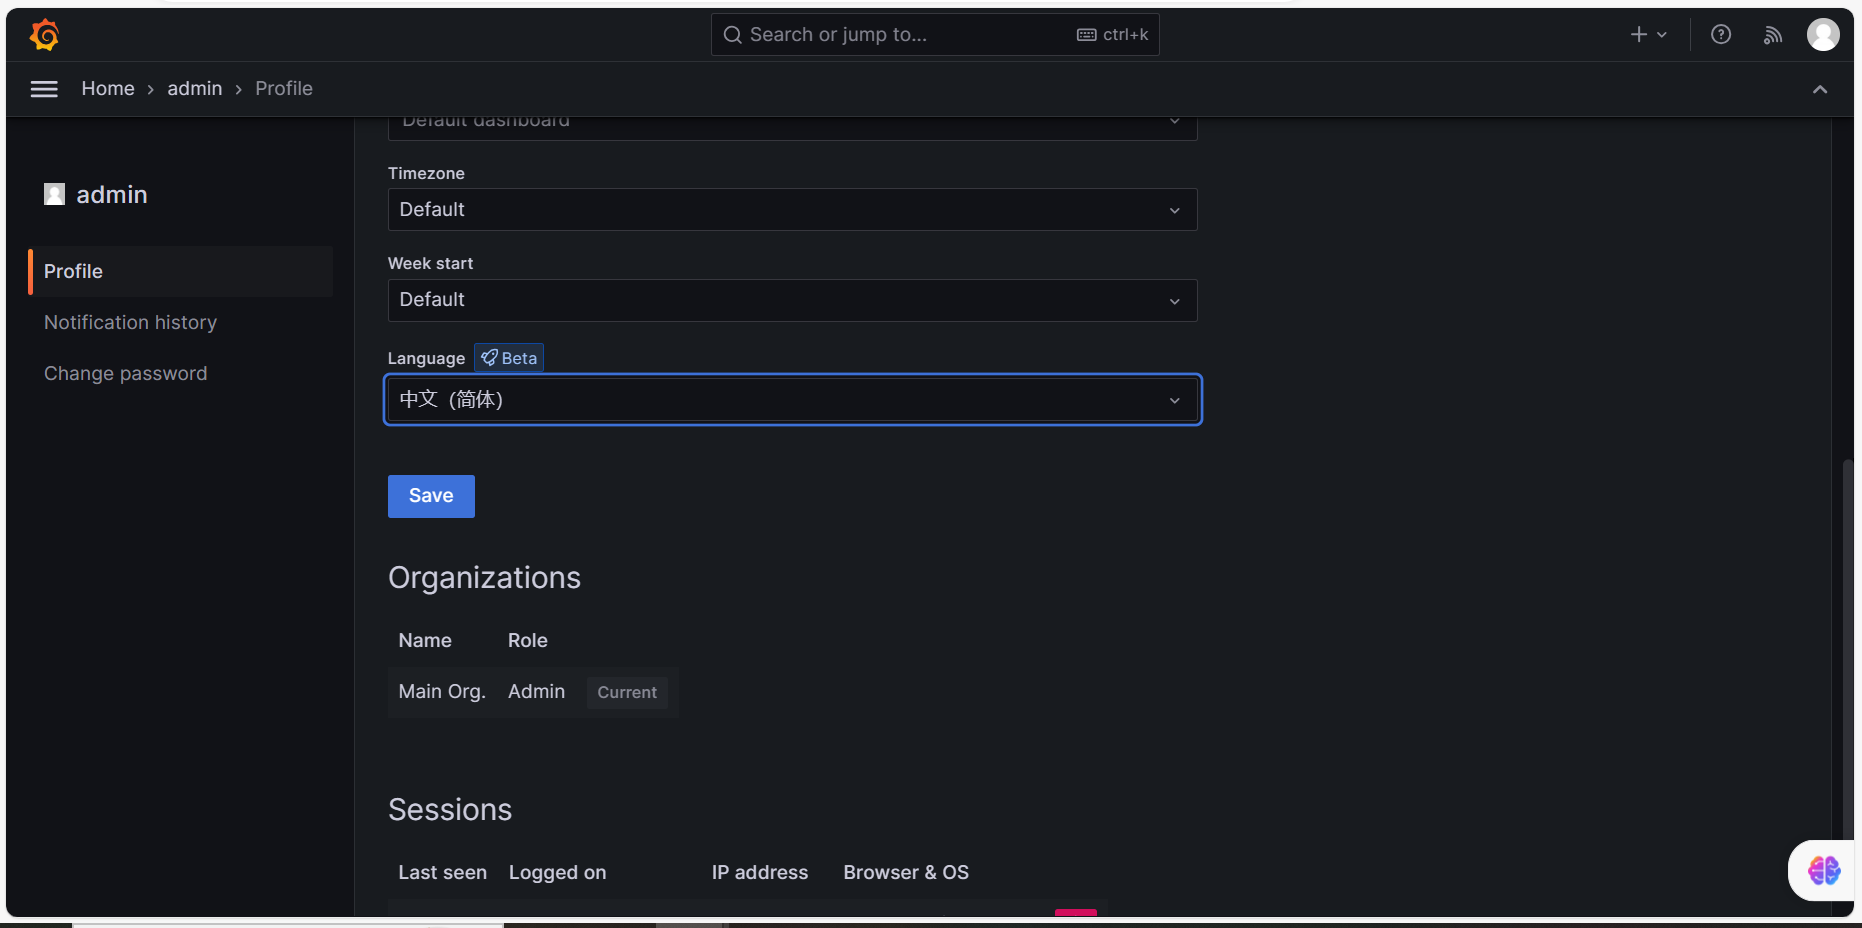
改为中文