一、监控部署
1、将k8s集群中kube-state-metrics指标进行收集,服务进行部署
1.1 pod性能指标(k8s集群组件自动集成)
k8s组件本身提供组件自身运行的监控指标以及容器相关的监控指标。通过cAdvisor 是一个开源的分析容器资源使用率和性能特性的代理工具,集成到 Kubelet中,当Kubelet启动时会同时启动cAdvisor,且一个cAdvisor只监控一个Node节点的信息。cAdvisor 自动查找所有在其所在节点上的容器,自动采集 CPU、内存、文件系统和网络使用的统计信息。cAdvisor 通过它所在节点机的 Root 容器,采集并分析该节点机的全面使用情况。
当然kubelet也会输出一些监控指标数据,因此pod的监控数据有kubelet和cadvisor,监控url分别为
https://NodeIP:10250/metrics
https://NodeIP:10250/metrics/cadvisor
1.2 K8S资源监控(k8s集群内部署)
kube-state-metrics是一个简单的服务,它监听Kubernetes API服务器并生成关联对象的指标。它不关注单个Kubernetes组件的运行状况,而是关注内部各种对象(如deployment、node、pod等)的运行状况。
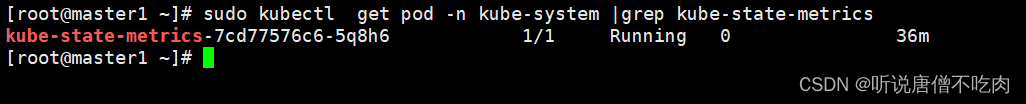
注:先手动检查下集群,是否已经安装kube-state-metrics
如果集群没有安装,可参考如下步骤进行部署:
docker pull gcr.io/google_containers/kube-state-metrics:v1.6.0
// 镜像打标签,设置为当前k8s配置的镜像仓库地址
docker tag quay.io/coreos/kube-state-metrics:v1.9.0 dockerhub.kubekey.local/library/kube-state-metrics:v1.9.0
// 推进仓库
docker push dockerhub.kubekey.local/library/kube-state-metrics:v1.9.0
1.3 编辑kube-state-metrics.yml文件
vim kube-state-metrics.yml
---
apiVersion: v1
kind: ServiceAccount
metadata:
  labels:
    app: kube-state-metrics
  name: kube-state-metrics
  namespace: prometheus
---
apiVersion: rbac.authorization.k8s.io/v1
kind: ClusterRole
metadata:
  name: kube-state-metrics
rules:
- apiGroups: [""]
  resources:
  - configmaps
  - secrets
  - nodes
  - pods
  - services
  - resourcequotas
  - replicationcontrollers
  - limitranges
  - persistentvolumeclaims
  - persistentvolumes
  - namespaces
  - endpoints
  verbs: ["list", "watch"]
- apiGroups: ["extensions"]
  resources:
  - daemonsets
  - deployments
  - replicasets
  - ingresses
  verbs: ["list", "watch"]
- apiGroups: ["apps"]
  resources:
  - daemonsets
  - deployments
  - replicasets
  - statefulsets
  verbs: ["list", "watch"]
- apiGroups: ["batch"]
  resources:
  - cronjobs
  - jobs
  verbs: ["list", "watch"]
- apiGroups: ["autoscaling"]
  resources:
  - horizontalpodautoscalers
  verbs: ["list", "watch"]
- apiGroups: ["policy"]
  resources:
  - poddisruptionbudgets
  verbs: ["list", "watch"]
- apiGroups: ["certificates.k8s.io"]
  resources:
  - certificatesigningrequests
  verbs: ["list", "watch"]
- apiGroups: ["storage.k8s.io"]
  resources:
  - storageclasses
  verbs: ["list", "watch"]
- apiGroups: ["autoscaling.k8s.io"]
  resources:
  - verticalpodautoscalers
  verbs: ["list", "watch"]
---
apiVersion: rbac.authorization.k8s.io/v1
kind: ClusterRoleBinding
metadata:
  labels:
    app: kube-state-metrics
  name: kube-state-metrics
roleRef:
  apiGroup: rbac.authorization.k8s.io
  kind: ClusterRole
  name: kube-state-metrics
subjects:
- kind: ServiceAccount
  name: kube-state-metrics
  namespace: prometheus
---
#apiVersion: extensions/v1beta1
apiVersion: apps/v1
kind: Deployment
metadata:
  labels:
    app: kube-state-metrics
  name: kube-state-metrics
  namespace: prometheus
spec:
  replicas: 1
  selector:
    matchLabels:
      app: kube-state-metrics
  strategy:
    rollingUpdate:
      maxSurge: 1
      maxUnavailable: 0
    type: RollingUpdate
  template:
    metadata:
      labels:
        app: kube-state-metrics
    spec:
      containers:
      # 注意,这里image地址修改为你k8s配置的仓库地址
      - image: dockerhub.kubekey.local/library/kube-state-metrics:v1.9.0
        imagePullPolicy: IfNotPresent
        livenessProbe:
          failureThreshold: 3
          httpGet:
            path: /
            port: 8080
            scheme: HTTP
          initialDelaySeconds: 30
          periodSeconds: 10
          successThreshold: 1
          timeoutSeconds: 30
        name: kube-state-metrics
        ports:
        - containerPort: 8080
          protocol: TCP
        readinessProbe:
          failureThreshold: 3
          httpGet:
            path: /
            port: 8080
            scheme: HTTP
          initialDelaySeconds: 30
          periodSeconds: 10
          successThreshold: 1
          timeoutSeconds: 5
        resources:
          limits:
            cpu: 500m
            memory: 768Mi
          requests:
            cpu: 250m
            memory: 768Mi
      restartPolicy: Always
      serviceAccount: kube-state-metrics
      serviceAccountName: kube-state-metrics
---
apiVersion: v1
kind: Service
metadata:
  labels:
    app: kube-state-metrics
  name: kube-state-metrics
  namespace: prometheus
spec:
  ports:
  - name: kube-state-metrics
    port: 80
    protocol: TCP
    targetPort: 8080
  selector:
    app: kube-state-metrics
    ## 注意这里kube-state-metrics暴露类型修改为NodePort对外暴露
  type: NodePort
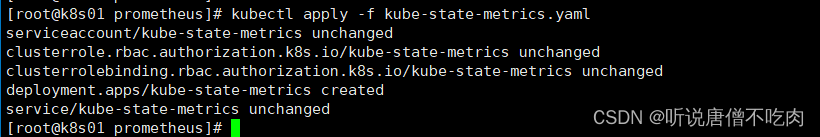
1.4 启动yaml文件
kubectl apply -f kube-state-metrics.yaml
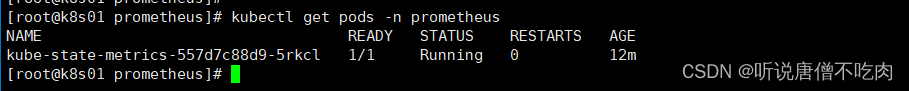
1.5 查看pod信息
kubectl get pod -n prometheus
1.6 查看service信息
kubectl get svc -n prometheus
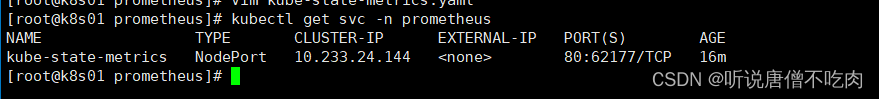
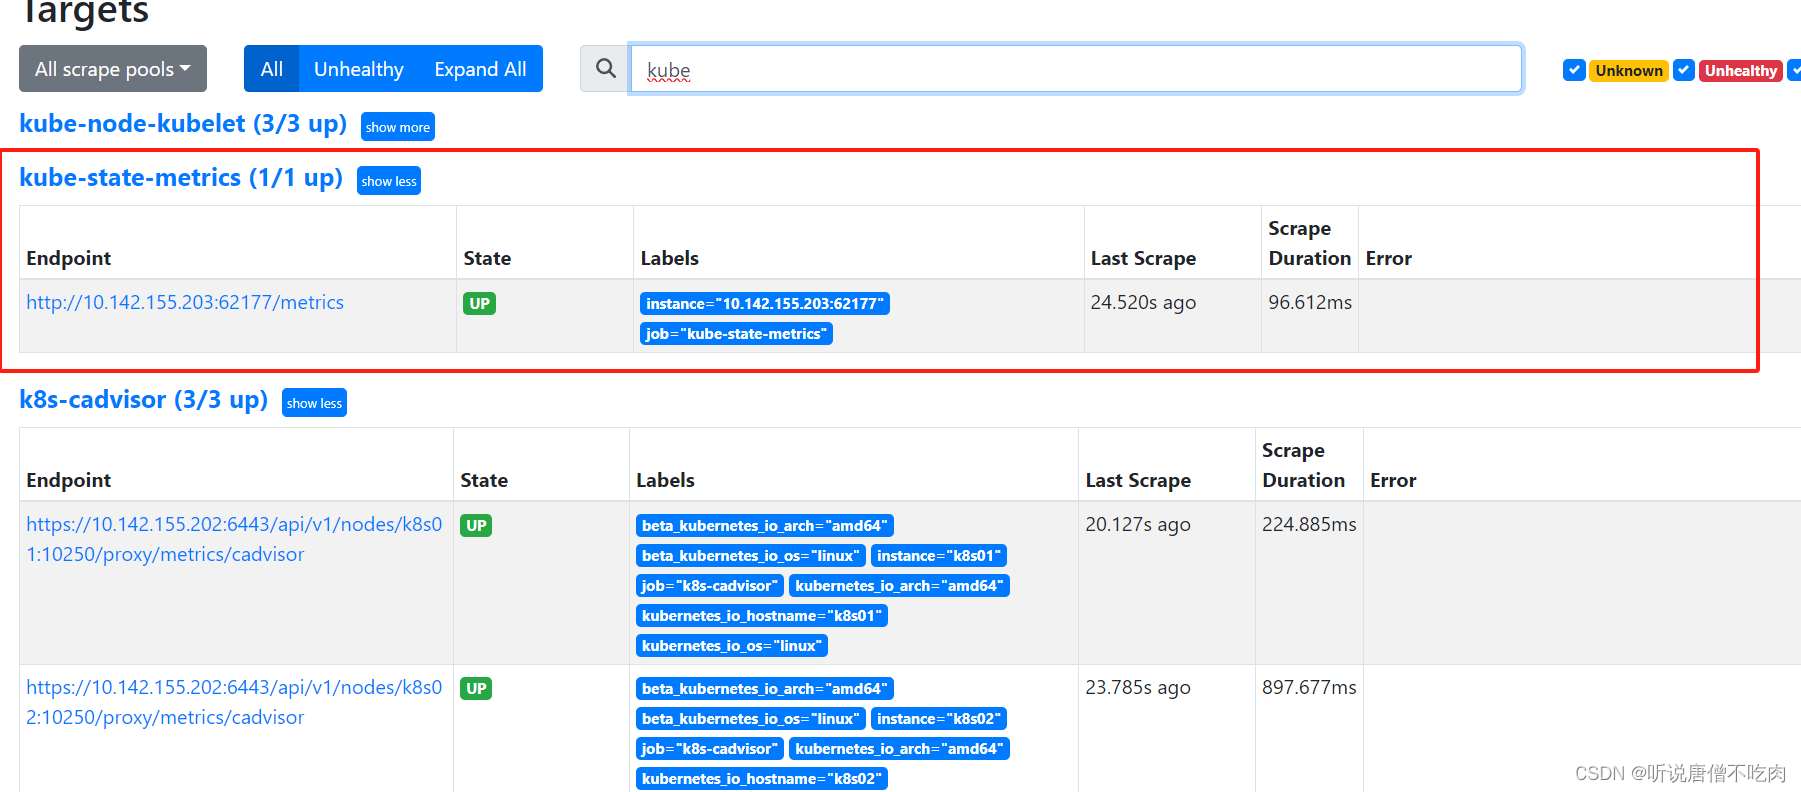
这里可以看到k8s集群对外暴露的端口为 62177
1.7 查看集群信息
kubectl get po -n prometheus -owide
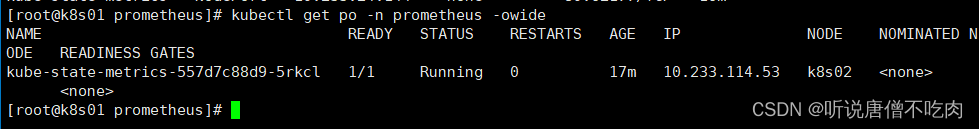
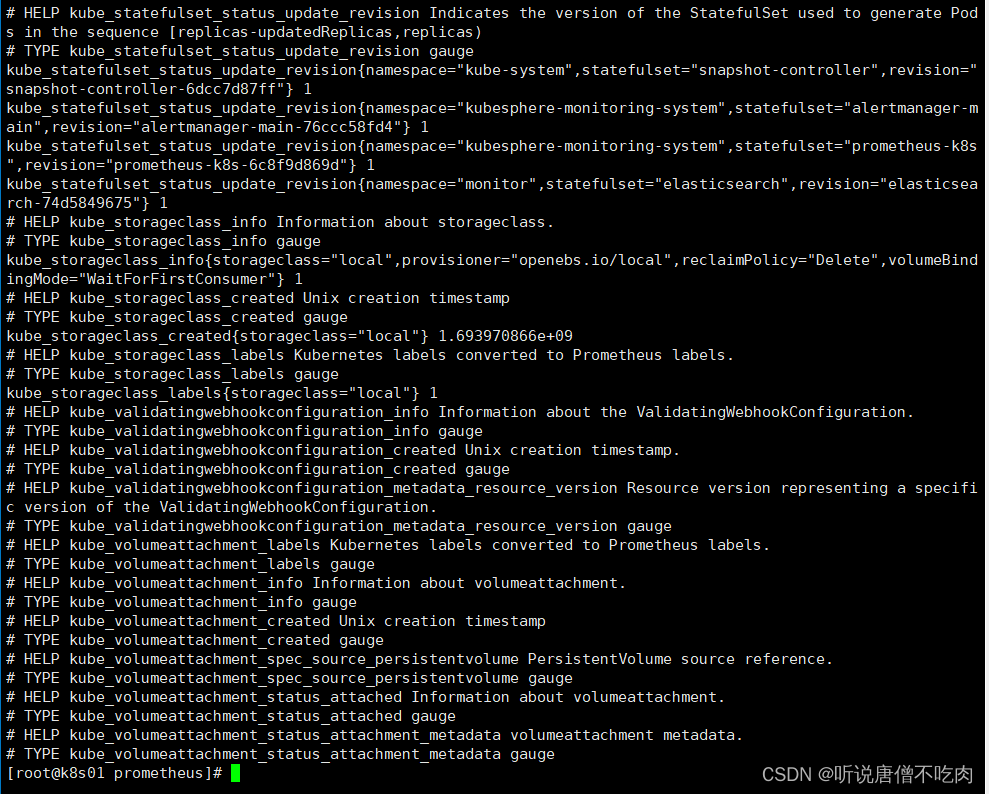
然后查看metrics信息
可以手动
curl k8s02:62177/metrics
正常,数据metrics就会出现
二、创建token供集群外部访问
集群外部监控K8s集群,通过访问kube-apiserver来访问集群资源。通过这种方式集群外部prometheus也能自动发现k8s集群服务
# 1.创建serviceaccounts
kubectl create sa prometheus -n default
# 2.创建prometheus角色并对其绑定cluster-admin
kubectl create clusterrolebinding prometheus --clusterrole cluster-admin --serviceaccount=default:prometheus
# 3. 创建secret; k8s1.24之后默认不会为serveiceaccounts创建secret
kubectl apply -f - <<EOF
apiVersion: v1
kind: Secret
type: kubernetes.io/service-account-token
metadata:
  name: prometheus-token
  namespace: default
  annotations:
    kubernetes.io/service-account.name: "prometheus"
EOF
# 4. 测试访问kube-apiserver
APISERVER=$(kubectl config view --minify -o jsonpath='{.clusters[0].cluster.server}')
TOKEN=$(kubectl get secret  prometheus-token -n default -o jsonpath='{.data.token}' | base64 --decode)
curl $APISERVER/api --header "Authorization: Bearer $TOKEN" --insecure
# 5. 保存token
echo $TOKEN > k8s_token
# 6. 测试访问指标
# 访问pod性能资源指标:(访问kubelet)
# 注意:master1为当前master节点的hostname,需要修改
curl $APISERVER/api/v1/nodes/master1:10250/proxy/metrics --header "Authorization: Bearer $TOKEN" --insecure
三、集成Prometheus配置
vim prometheus.yml
scrape_configs:
  - job_name: "k8s-cadvisor"
    honor_timestamps: true
    metrics_path: /metrics
    scheme: https
    kubernetes_sd_configs:
    - api_server: https://10.142.155.202:6443
      role: node
      bearer_token_file: /prometheus/data/k8s_token
      tls_config:
        insecure_skip_verify: true
    bearer_token_file: /prometheus/data/k8s_token
    tls_config:
      insecure_skip_verify: true
    relabel_configs:
    - action: labelmap
      regex: __meta_kubernetes_node_label_(.+)
    - separator: ;
      regex: (.*)
      target_label: __address__
      replacement: 10.142.155.202:6443
      action: replace
    - source_labels: [__meta_kubernetes_node_name]
      separator: ;
      regex: (.+)
      target_label: __metrics_path__
      replacement: /api/v1/nodes/${1}:10250/proxy/metrics/cadvisor
      action: replace
  - job_name: "kube-node-kubelet"
    scheme: https
    tls_config:
      insecure_skip_verify: true
    bearer_token_file: /prometheus/data/k8s_token
    kubernetes_sd_configs:
    - role: node
      api_server: "https://10.142.155.202:6443"   // 修改为对应的k8s master的节点
      tls_config:
        insecure_skip_verify: true
      bearer_token_file: /prometheus/data/k8s_token
    relabel_configs:
    - target_label: __address__
      replacement: 10.142.155.202:6443
    - source_labels: [__meta_kubernetes_node_name]
      regex: (.+)
      target_label: __metrics_path__
      replacement: /api/v1/nodes/${1}:10250/proxy/metrics
    - action: labelmap
      regex: __meta_kubernetes_service_label_(.+)
    - source_labels: [__meta_kubernetes_namespace]
      action: replace
      target_label: kubernetes_namespace
    - source_labels: [__meta_kubernetes_service_name]
      action: replace
      target_label: service_name
注意:bearer_token_file: /prometheus/data/k8s_token
这里的token为上面生成的token信息,请根据目录进行配置即可
然后重启prometheus
如果是容器部署的prometheus,需要考虑映射token,可docker cp到/prometheus/data/ 即可
即可
docker restart prometheus
3、进入prometheus界面,查看相关指标
默认情况下 prometheus url: http://IP:9090
4、集成grafana
导入grafana JSON ID, 747
4.1、导入node信息指标
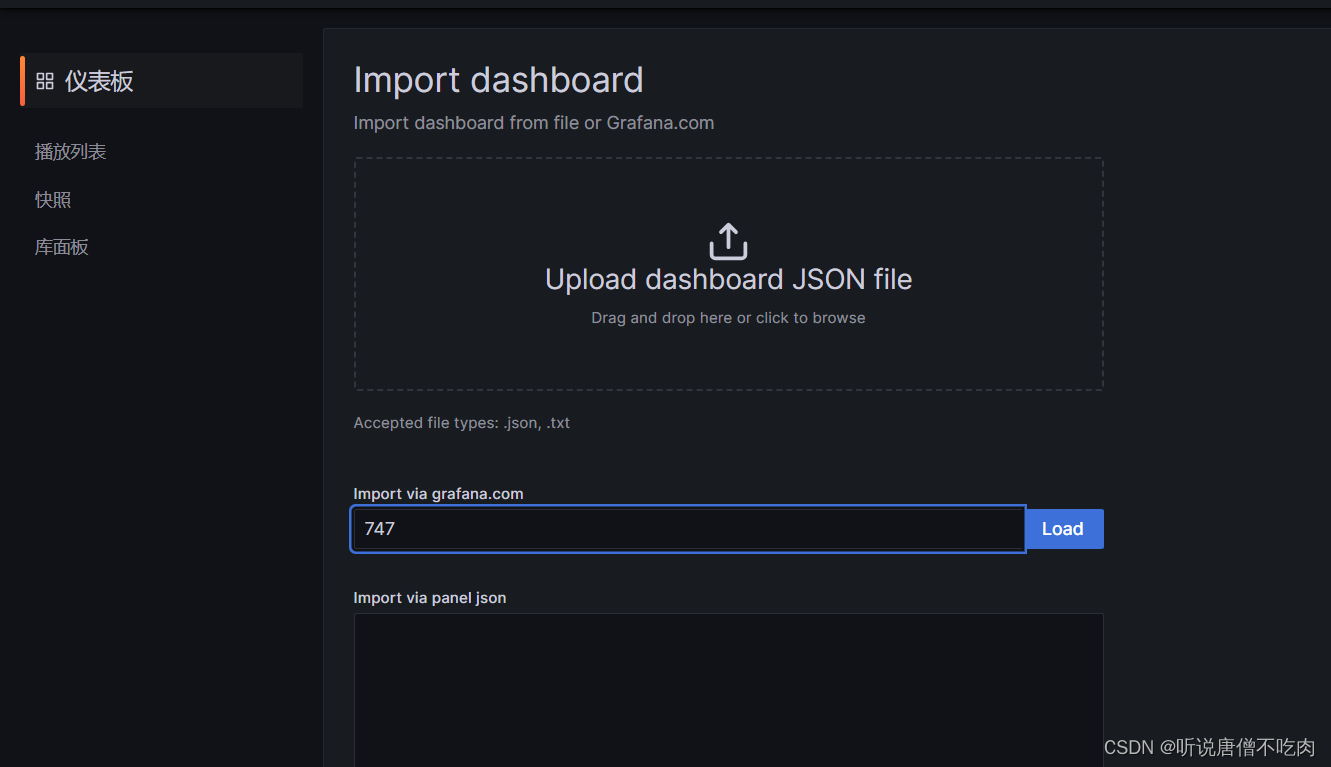
load 即可
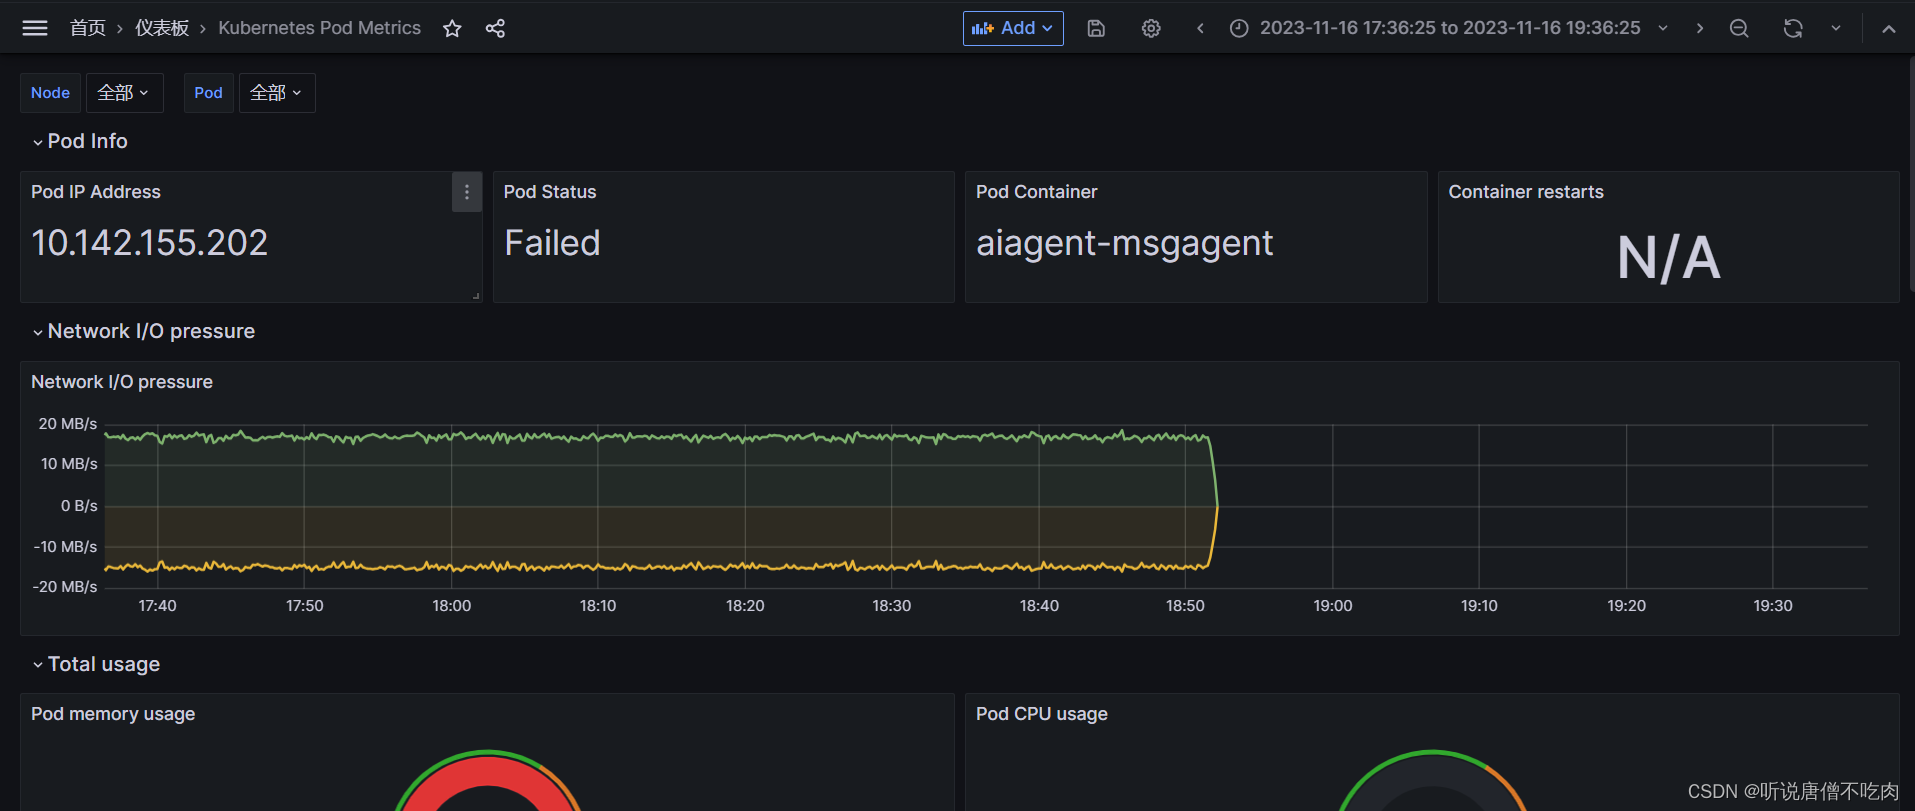
4.2、导入pod信息指标
JSON ID:15760
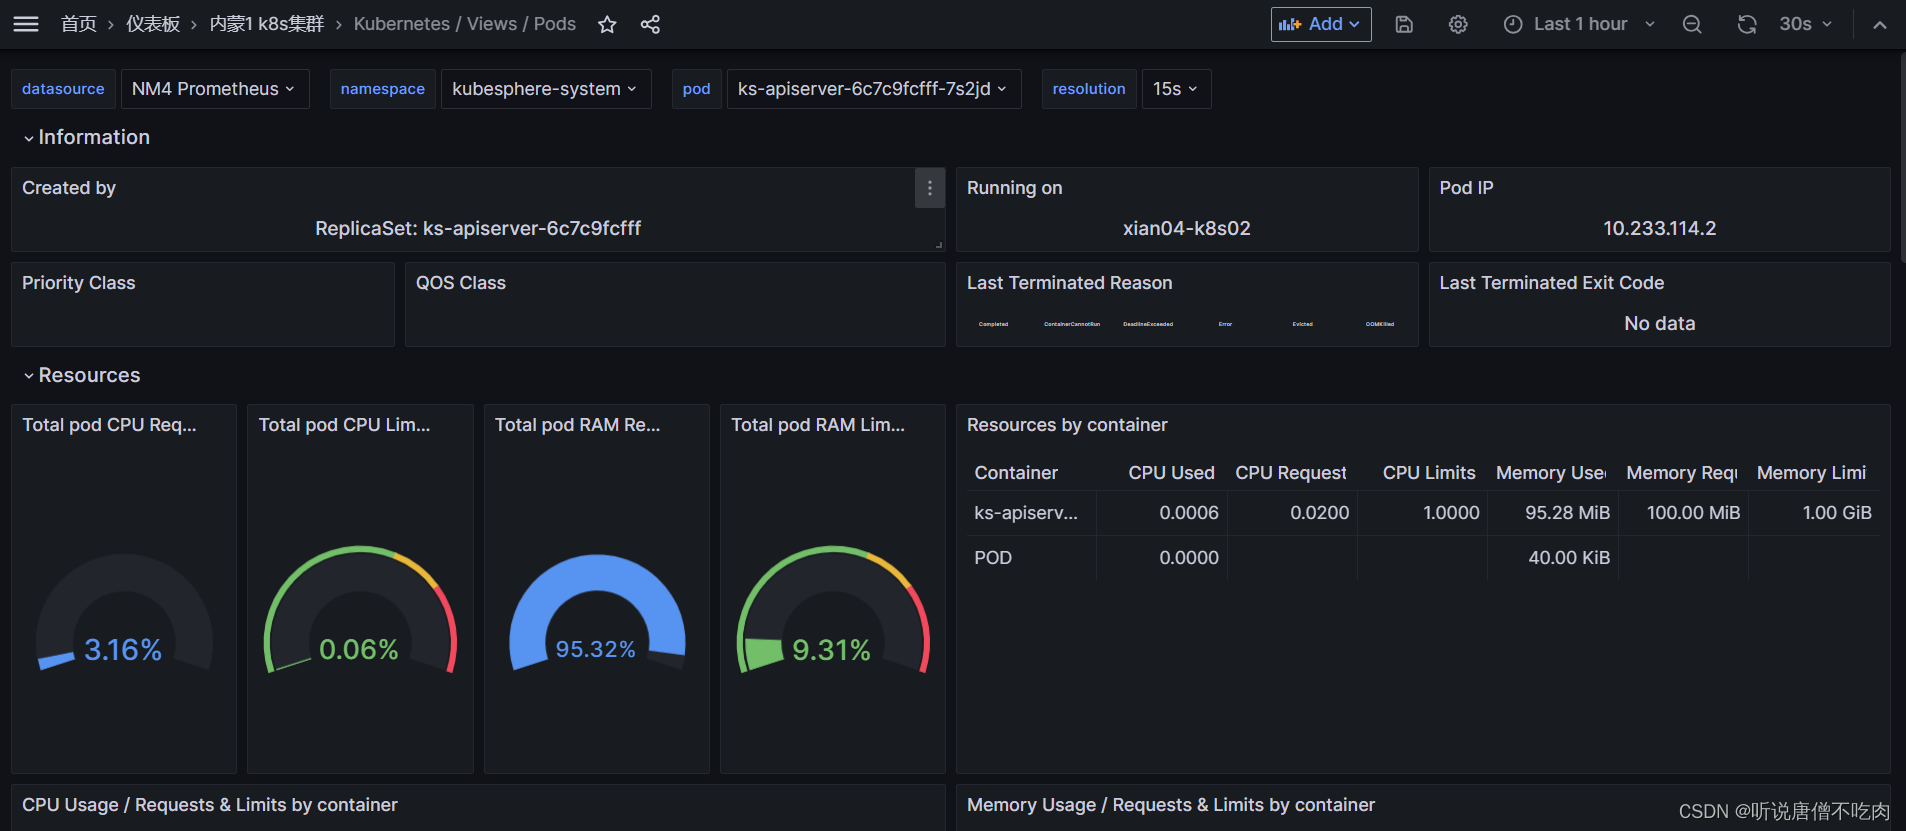
大盘信息即可完全展示~