dockercompose_prometheusgrafana_0">docker-compose 部署prometheus+grafana
Prometheus
Prometheus 是有 SoundCloud 开发的开源监控系统和时序数据库,基于 Go 语言开发。通过基于 HTTP 的 pull 方式采集时序数据,通过服务发现或静态配置去获取要采集的目标服务器,支持多节点工作,支持多种可视化图表及仪表盘。
贴一下官方提供的架构图:
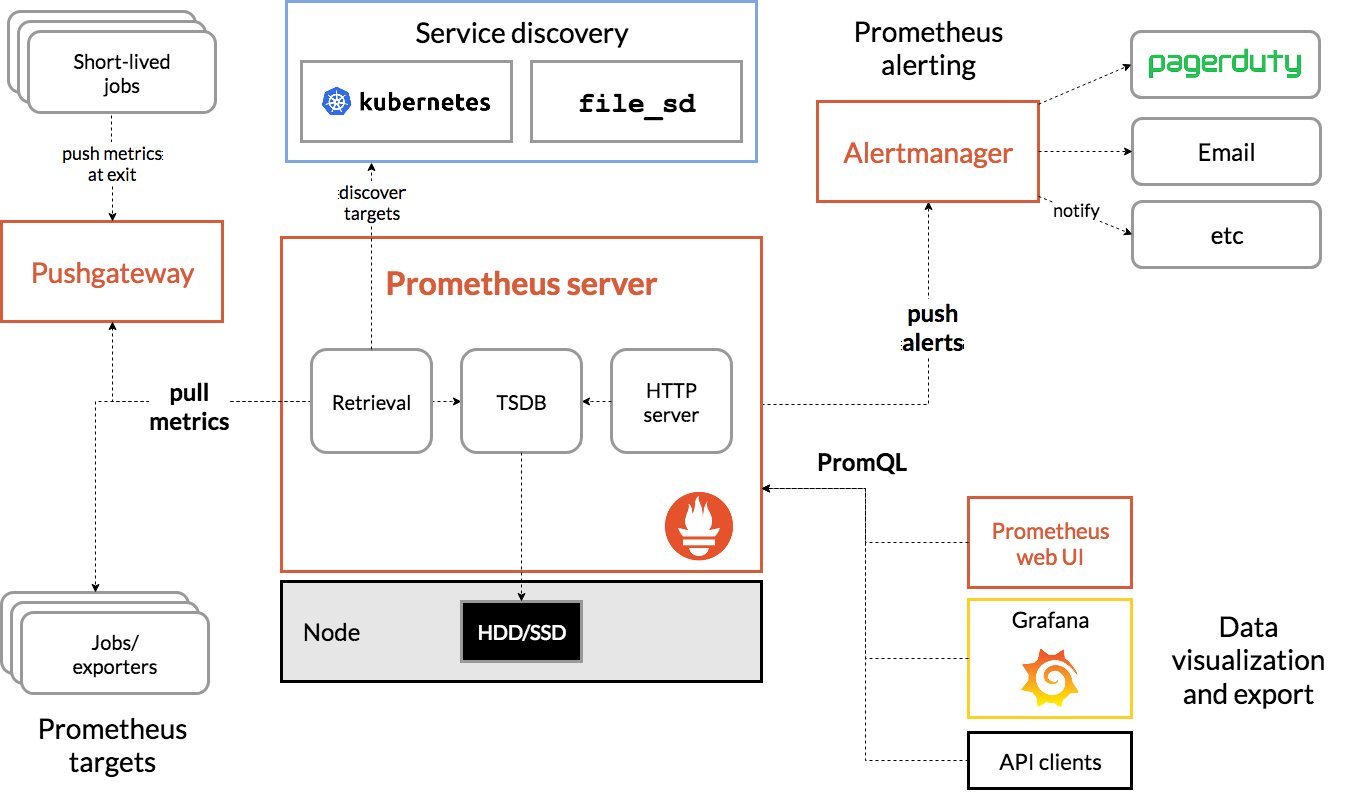
Pormetheus 几个主要模块有,Server,Exporters,Pushgateway,PromQL,Alertmanager,WebUI 等,主要逻辑如下:
Prometheus server 定期从静态配置的 targets 或者服务发现的 targets 拉取数据。
当新拉取的数据大于配置内存缓存区时,Prometheus 会将数据持久化到磁盘(如果使用 remote storage 将持久化到云端)。
Prometheus 配置 rules,然后定时查询数据,当条件触发时,会将 alert 推送到配置的 Alertmanager。
Alertmanager 收到警告时,会根据配置,聚合、去重、降噪等操作,最后发送警告。
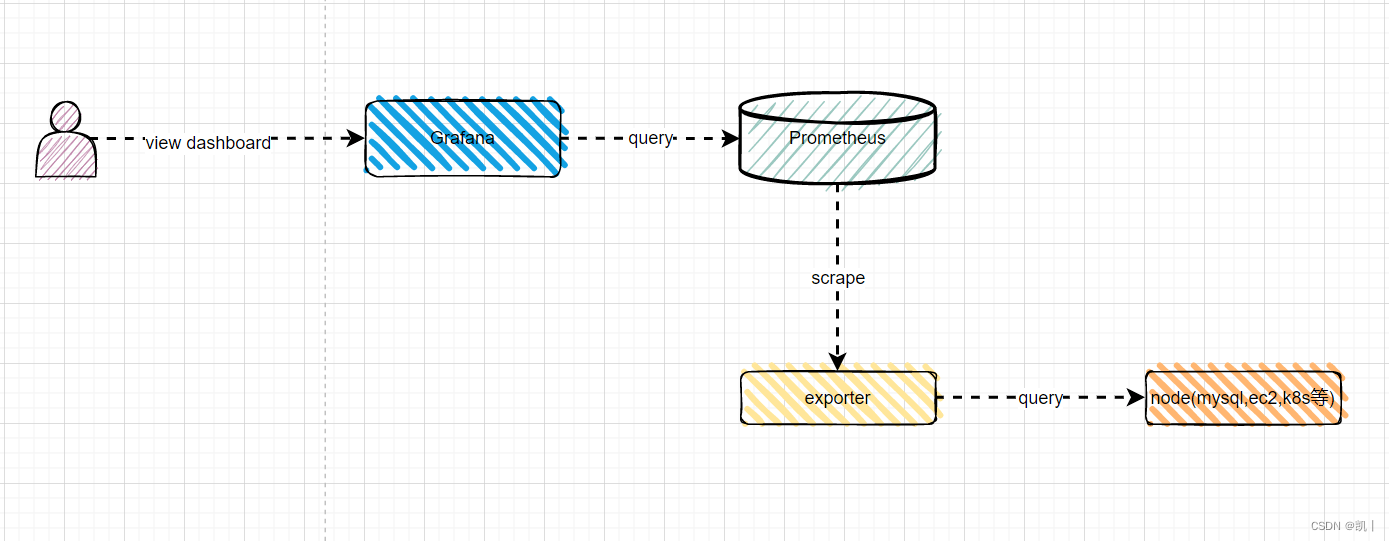
可以使用 API,Prometheus Console 或者 Grafana 查询和聚合数据。
Grafana
Grafana 是一个开源的度量分析及可视化套件。通过访问数据库(如 InfluxDB、Prometheus),展示自定义图表。
Exporter
Exporter 是 Prometheus 推出的针对服务器状态监控的 Metrics 工具。目前开发中常见的组件都有对应的 exporter 可以直接使用。常见的有两大类,一种是社区提供的,包含数据库,消息队列,存储,HTTP 服务,日志等,比如 node_exporter,mysqld_exporter 等;还有一种是用户自定义的 exporter,可以基于官方提供的 Client Library 创建自己的 exporter 程序。
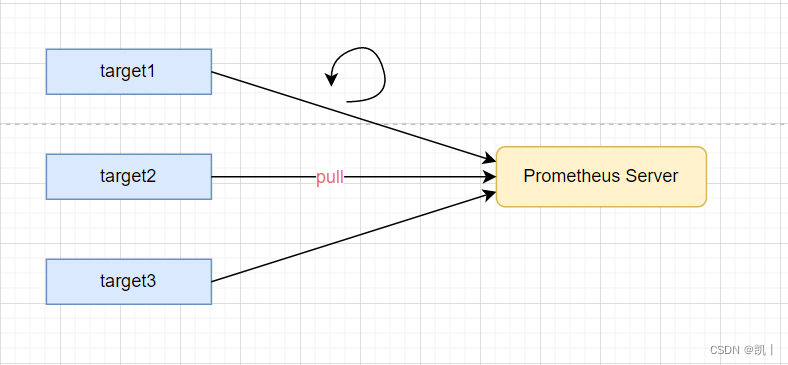
每个 exporter 的一个实例被称为 target,Prometheus 通过轮询的方式定期从这些 target 中获取样本数据。
原理简介
dockercomposeyml_37">直接先看docker-compose.yml
version: "3.8"
services:
  node-exporter:
    image: prom/node-exporter:latest
    container_name: "node-exporter0"
    ports:
      - "9100:9100"
    restart: always
  prometheus:
    image: prom/prometheus:latest
    container_name: "prometheus0"
    user: root
    restart: always
    ports:
      - "9090:9090"
    volumes:
      - "./conf/prometheus/prometheus.yml:/etc/prometheus/prometheus.yml"
      - "./prometheus_data:/prometheus"
    command:
      - '--config.file=/etc/prometheus/prometheus.yml'
      - '--storage.tsdb.path=/prometheus'
      - '--web.console.libraries=/usr/share/prometheus/console_libraries'
      - '--web.console.templates=/usr/share/prometheus/consoles'
  grafana:
    image: grafana/grafana
    container_name: "grafana0"
    user: root
    ports:
      - "3000:3000"
    restart: always
    volumes:
      - "./grafana_data:/var/lib/grafana"
    depends_on:
      -  prometheus

  alertmanager:
    image: prom/alertmanager
    hostname: alertmanager
    container_name: alertmanager
    user: root
    restart: always
    ports:
      - "9093:9093"
    volumes:
      - ./data/prometheus/alertmanager_data:/var/lib/alertmanager
prometheusyml_87">prometheus.yml内容如下
# my global config
global:
  scrape_interval: 15s # Set the scrape interval to every 15 seconds. Default is every 1 minute.
  evaluation_interval: 15s # Evaluate rules every 15 seconds. The default is every 1 minute.
  # scrape_timeout is set to the global default (10s).

# Alertmanager configuration
alerting:
  alertmanagers:
    - static_configs:
        - targets:
          - alertmanager:9093

# Load rules once and periodically evaluate them according to the global 'evaluation_interval'.
rule_files:
  # - "first_rules.yml"
  # - "second_rules.yml"

# A scrape configuration containing exactly one endpoint to scrape:
# Here it's Prometheus itself.
scrape_configs:
  # The job name is added as a label `job=<job_name>` to any timeseries scraped from this config.
  - job_name: "prometheus"

    # metrics_path defaults to '/metrics'
    # scheme defaults to 'http'.

    static_configs:
      - targets: ["localhost:9090"]

  - job_name: "node-exporter"
    # metrics_path defaults to '/metrics'
    # scheme defaults to 'http'.

    static_configs:
      - targets: ["node-exporter:9100"]
 # 服务器1 根据自己情况调整
  - job_name: "node-dw"
    # metrics_path defaults to '/metrics'
    # scheme defaults to 'http'.

    static_configs:
      - targets: ["192.168.1.5:9100"]
   # 服务器2 根据自己情况调整
  - job_name: "node-bj02-online-01"
    # metrics_path defaults to '/metrics'
    # scheme defaults to 'http'.

    static_configs:
      - targets: ["192.168.1.7:9100"]