prometheuspushgateway_1">prometheus-pushgateway安装
一. Pushgateway简介
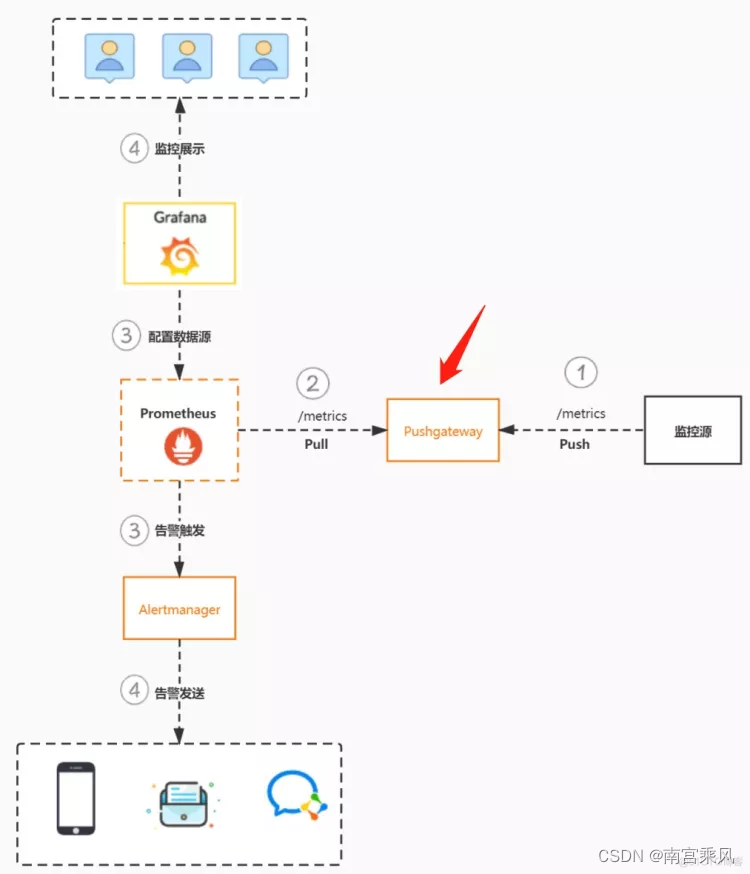
Pushgateway为Prometheus整体监控方案的功能组件之一,并做于一个独立的工具存在。它主要用于Prometheus无法直接拿到监控指标的场景,如监控源位于防火墙之后,Prometheus无法穿透防火墙;目标服务没有可抓取监控数据的端点等多种情况。
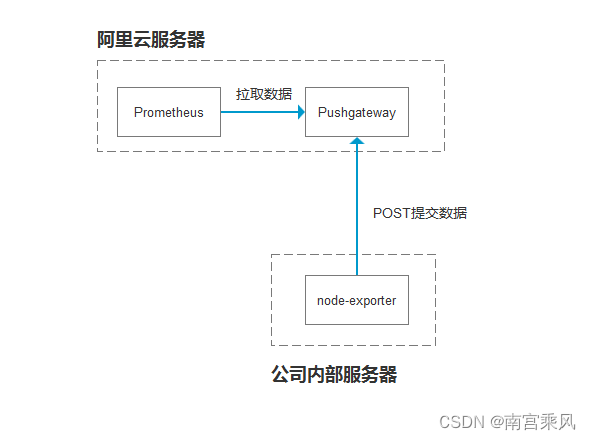
在类似场景中,可通过部署Pushgateway的方式解决问题。当部署该组件后,监控源通过主动发送监控数据到Pushgateway,再由Prometheus定时获取信息,实现资源的状态监控。
简单图
工作流程:
a. 监控源通过Post方式,发送数据到Pushgateway,路径为/metrics。
b. Prometheus服务端设置任务,定时获取Pushgateway上面的监控指标。
c. Prometheus拿到监控指标后,根据配置的告警规则,如果匹配将触发告警到Alertmanager;同时,Grafana可配置数据源调用Prometheus数据,做为数据展示。
d. Alertmanager收到告警后,根据规则转发到对应接收人及接收介质;Grafana方面,用户可登录并根据数据源的监控指标,配置相关的图表展示 。
二. 安装部署
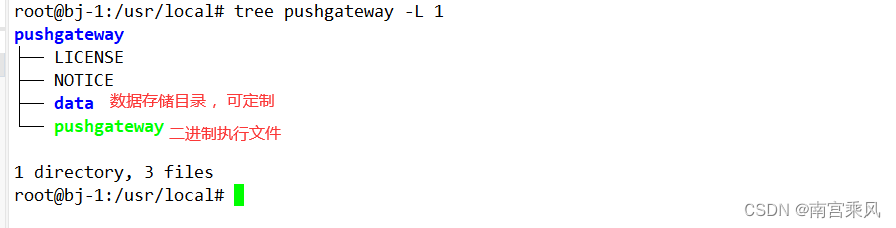
二进制安装
下载安装包
cd /usr/local
wget https://github.com/prometheus/pushgateway/releases/download/v1.4.3/pushgateway-1.4.3.linux-amd64.tar.gz
tar -xf pushgateway-1.4.3.linux-amd64.tar.gz
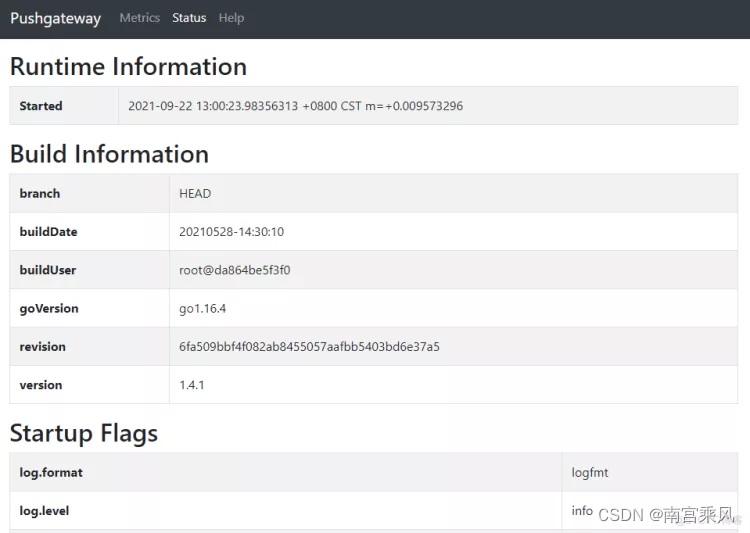
system管理
启动服务,默认端口为9091,可通过–web.listen-address更改监听端口
root@bj-1:/usr/local# cat /usr/lib/systemd/system/pushgateway.service
[Unit]
Description=Prometheus pushgateway
Requires=network.target remote-fs.target
After=network.target remote-fs.target
?
[Service]
Type=simple
User=root
Group=root
ExecStart=/usr/local/pushgateway/pushgateway --persistence.file="/usr/local/pushgateway/data/" --persistence.interval=5m #保存时间5分钟
ExecReload=/bin/kill -HUP $MAINPID
KillMode=process
Restart=on-failure
RestartSec=5s
?
[Install]
WantedBy=multi-user.target
prometheus_71">三.prometheus添加配置
新增job pushgateway
vim /usr/local/prometheus/prometheus.yml
  - job_name: 'pushgateway'
    scrape_interval: 30s
    honor_labels: true  #加上此配置exporter节点上传数据中的一些标签将不会被pushgateway节点的相同标签覆盖
    static_configs:
      - targets: ['10.3.1.11:9091']
        labels:
          instance: pushgateway
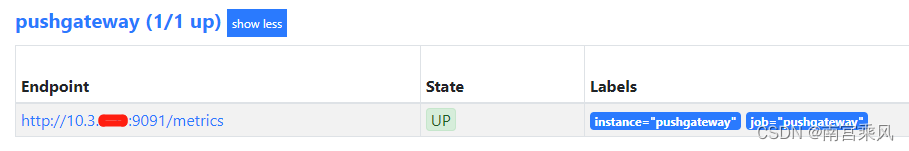
‘’查看target状态:
四. 数据推送Pushgateway
pushgateway的数据推送支持两种方式,Prometheus Client SDK推送和API推送。
1、Client SDK推送
Prometheus本身提供了支持多种语言的SDK,可通过SDK的方式,生成相关的数据,并推送到pushgateway,这也是官方推荐的方案。目前的SDK覆盖语言有官方的
Go
Java or Scala
Python
Ruby
也有许多第三方的,详情可参见此链接:https://prometheus.io/docs/instrumenting/clientlibs/
示例:
本示例以python为例,讲解SDK的使用
from prometheus_client import Counter,Gauge,push_to_gateway
from prometheus_client.core import CollectorRegistry

registry = CollectorRegistry()
data1 = Gauge('gauge_test_metric','This is a gauge-test-metric',['method','path','instance'],registry=registry)
data1.labels(method='get',path='/aaa',instance='instance1').inc(3)

push_to_gateway('10.12.61.3:9091', job='alex-job',registry=registry)
注解:
第一、二行代码:引入相关的Prometheus SDK;
第五行代码:创建相关的指标,类型为Gauge。其中“gauge_test_metric”为指标名称,'This is a gauge-test-metric’为指标注释,[‘method’,‘path’,‘instance’] 为指标相关的label。
第六行代码:添加相关的label信息和指标value 值。
第六行代码:push数据到pushgateway,'10.12.61.3:9091’为发送地址,job指定该任务名称。
以上代码产生的指标数据等同如下 :
# HELP gauge_test_metric This is a gauge-test-metric
# TYPE gauge_test_metric gauge
gauge_test_metric{instance="instance1",method="get",path="/aaa"} 3.0
2、Post推送Node-expoerter组件数据
安装好node_exporter,此处不多介绍
传送监控数据到pushgateway节点
对于传过去的监控项会添加此处定义的标签 job=test instance=10.2.1.11 hostname=ip-10-2-1-11
curl 127.0.0.1:9100/metrics|curl --data-binary @- http://10.3.1.11:9091/metrics/job/test/instance/10.2.1.11/hostname/ip-10-2-1-11
编写脚本
node_date.sh
#!/bin/bash
job_name="Bj"
hostname=$(hostname)
HOST_IP=$(hostname --all-ip-addresses | awk '{print $1}')

/usr/bin/curl 127.0.0.1:9100/metrics|/usr/bin/curl --data-binary @- http://sanming.f3322.net:9091/metrics/job/$job_name/instance/$HOST_IP/hostname/$hostname
crontab定时任务
#Ansible: node_date
* * * * * /bin/bash /usr/local/node_exporter/node_date.sh
批量给node-exporter添加定时任务
Ansible剧本
root@bj-1:/opt/node_date# cat playbook.yml
- hosts: all
  remote_user: root
  gather_facts: no
  tasks:
    - name: 推送磁盘脚本
      copy: src=node_date.sh dest=/usr/local/node_exporter mode=u+x
    - name: 设置定时任务
      cron: name="node_date"  job="/bin/bash /usr/local/node_exporter/node_date.sh" state="present"
    - name: 执行脚本
      shell: /bin/bash /usr/local/node_exporter/node_date.sh
删除某个实例的数据:
curl -X DELETE http://10.3.1.11:9091/metrics/job/test/instance/10.2.1.11/hostname/ip-10-2-1-11
3、pushgateway脚本示例
(1)TCP连接
pushgateway本身没有任何抓取监控数据的功能,它只能被动地等待数据被推送过来,故需要用户自行编写数据采集脚本。
例:采集TCP waiting_connection瞬时数量
mkdir -p /app/scripts/pushgateway

cat <<EOF >/app/scripts/pushgateway/tcp_waiting_connection.sh
#!/bin/bash

# 获取hostname,且host不能为localhost
instance_name=`hostname -f | cut -d '.' -f 1`
if [ $instance_name = "localhost" ];then
  echo "Must FQDN hostname"
  exit 1
fi

# For waiting connections
label="count_netstat_wait_connetions"
count_netstat_wait_connetions=`netstat -an | grep -i wait | wc -l`
echo "$label:$count_netstat_wait_connetions"
echo "$label $count_netstat_wait_connetions" | curl --data-binary @- http://localhost:9091/metrics/job/pushgateway/instance/$instance_name

EOF

chmod +x /app/scripts/pushgateway/tcp_waiting_connection.sh
1)netstat -an | grep -i wait | wc -l该自定义监控的取值方法
2)实际上就是将K/V键值对通过POST方式推送给pushgateway,格式如下:
http://localhost:9091/metricspushgateway url
job/pushgateway数据推送过去的第一个label,即exported_job=“pushgateway”(类似prometheus.yml中定义的job)
instance/$instance_name数据推送过去的第一个label,即exported_instance=“deepin-PC”
2.定时执行脚本
crontab -e

* * * * * /app/scripts/pushgateway/tcp_waiting_connection.sh >/dev/null 2>&1
prometheus默认每15秒从pushgateway获取一次数据,而cron定时任务最小精度是每分钟执行一次,若想没15秒执行一次,则:
方法1:sleep:定义多条定时任务
* * * * * /app/scripts/pushgateway/tcp_waiting_connection.sh >/dev/null 2>&1
* * * * * * sleep 15; /app/scripts/pushgateway/tcp_waiting_connection.sh >/dev/null 2>&1
* * * * * * sleep 30; /app/scripts/pushgateway/tcp_waiting_connection.sh >/dev/null 2>&1
* * * * * * sleep 45; /app/scripts/pushgateway/tcp_waiting_connection.sh >/dev/null 2>&1
方法2:for循环
cat <<EOF >/app/scripts/pushgateway/tcp_waiting_connection.sh
#!/bin/bash
time=15
for (( i=0; i<60; i=i+time )); do
  instance_name=`hostname -f | cut -d '.' -f 1`
  if [ $instance_name = "localhost" ];then
    echo "Must FQDN hostname"
    exit 1
  fi
  label="count_netstat_wait_connetions"
  count_netstat_wait_connetions=`netstat -an | grep -i wait | wc -l`
  echo "$label:$count_netstat_wait_connetions"
  echo "$label $count_netstat_wait_connetions" | curl --data-binary @- http://localhost:9091/metrics/job/pushgateway/instance/$instance_name

  sleep $time
done
exit 0

EOF
此时cron定时任务只需要定义一条:
crontab -e

* * * * * /app/scripts/pushgateway/tcp_waiting_connection.sh >/dev/null 2>&1
注:若解释器使用#!/bin/bash,则调试时使用全路径或相对路径或者bash /app/scripts/pushgateway/tcp_waiting_connection.sh执行脚本;若解释器使用#!/bin/sh,则调试时使用sh /app/scripts/pushgateway/tcp_waiting_connection.sh执行脚本,否则出现错误:Syntax error: Bad for loop variable
3.promethues查看监控值count_netstat_wait_connetions
4.TCP等待连接数:count_netstat_wait_connetions(通过自定义脚本实现,通过node_exporter也可实现)
处于各种wait状态的TCP连接(close_wait,time_wait等)也是日常排查负载(网络负载,服务器负载,数据库负载等)的一个重要指标:一般wait类型的TCP过大时,一定说明系统网络负载(流量负载)出现了问题;原因多样(网络问题,访问请求量,DDOS流量,数据库,CPU等都有可能)
vi count_netstat_wait_connections.sh
#!/bin/bash
instance_name=`hostname -f | cut -d'.' -f1`  #获取本机名,用于后面的的标签
label="count_netstat_wait_connections"  #定义key名
count_netstat_wait_connections=`netstat -an | grep -i wait | wc -l`  #获取数据的命令
echo "$label: $count_netstat_wait_connections"
echo "$label  $count_netstat_wait_connections" | curl --data-binary @- http://server.com:9091/metrics/job/pushgateway_test/instance/$instance_name  #这里pushgateway_test就是prometheus主配置文件里job的名字,需要保持一致,这样数据就会推送给这个job。后面的instance则是指定机器名,使用的就是脚本里获取的那个变量值
参考文档:
Prometheus分布式监控
prometheus-pushgateway安装
Prometheus监控运维实战十一:Pushgateway