1.简介
本文档为prometheus和grafana安装配置手册,prometheus和grafana的内容、和操作过程,详细介绍了服务监控配置、dashboard配置、告警配置等操作。
2.部署说明
Prometheus基于Golang编写(需要安装),编译后的软件包,不依赖于任何的第三方依赖。用户只需要下载对应平台的二进制包,解压并且添加基本的配置即可正常启动Prometheus Server。 Grafana提供离线的rpm安装包,直接安装即可。
2.1环境配置
操作系统版本:
centos7.2
IP地址规划:
prometheus server+grafana:10.3.10.135
node_explorer: 10.3.10.136
Prometheus版本:
prometheus-2.14.0
Grafana版本:
grafana-6.5.1-1
2.2软件介质
Prometheus安装包:
prometheus-2.14.0.linux-amd64.tar.gz
grafana安装包:
grafana-6.5.1-1.x86_64.rpm
node_explorer安装包:
node_exporter-0.18.1.linux-amd64.tar.gz
mysqld_exporte_node安装包:
mysqld_exporter-0.12.1.linux-amd64.tar.gz
3.安装配置
prometheus">3.1 安装Prometheus
添加用户prometheus
# useradd --no-create-home --shell /bin/false prometheus
创建相关目录
# mkdir /etc/prometheus
# mkdir /var/lib/prometheus
改目录权限
# chown prometheus:prometheus /etc/prometheus
# chown prometheus:prometheus /var/lib/prometheus
解压 & 移动到相应目录
# tar xvf prometheus-2.14.0.linux-amd64.tar.gz

# cp prometheus-2.14.0.linux-amd64/prometheus /usr/local/bin/
# cp prometheus-2.14.0.linux-amd64/promtool /usr/local/bin/

# cp -r prometheus-2.14.0.linux-amd64/consoles/ /etc/prometheus/
# cp -r prometheus-2.14.0.linux-amd64/console_libraries/ /etc/prometheus/
# cp prometheus-2.14.0.linux-amd64/prometheus.yml /etc/prometheus/

# chown prometheus:prometheus /usr/local/bin/prometheus
# chown prometheus:prometheus /usr/local/bin/promtool

# chown -R prometheus:prometheus /etc/prometheus/consoles
# chown -R prometheus:prometheus /etc/prometheus/console_libraries
# chown -R prometheus:prometheus /etc/prometheus/prometheus.yml
配置Prometheus service,端口为9090
# vi /etc/systemd/system/prometheus.service
[Unit]
Description=Prometheus
Wants=network-online.target
After=network-online.target

[Service]
User=prometheus
Group=prometheus
Type=simple
ExecStart=/usr/local/bin/prometheus \
    --config.file /etc/prometheus/prometheus.yml \
    --storage.tsdb.path /var/lib/prometheus/ \
    --web.console.templates=/etc/prometheus/consoles \
--web.console.libraries=/etc/prometheus/console_libraries \
--web.enable-lifecycle \
    --web.listen-address=:9090

[Install]
WantedBy=multi-user.target
Prometheus启动参数说明 --config.file -- 指明prometheus的配置文件路径 --web.enable-lifecycle -- 指明prometheus配置更改后可以进行热加载 --storage.tsdb.path -- 指明监控数据存储路径 --storage.tsdb.retention --指明数据保留时间
说明: prometheus在2.0之后默认的热加载配置没有开启, 配置修改后, 需要重启prometheus server才能生效, 这对于生产环境的监控是不可容忍的, 所以我们需要开启prometheus server的配置热加载功能. 在启动prometheus时加上参数 web.enable-lifecycle , 可以启用配置的热加载, 配置修改后, 热加载配置:
curl -X POST http://localhost:9090/-/reload
加载systemd服务 & 启动
# 加载
systemctl daemon-reload
# 开机启动
systemctl enable prometheus.service
# 启动
systemctl start prometheus
# 查看状态
systemctl status prometheus
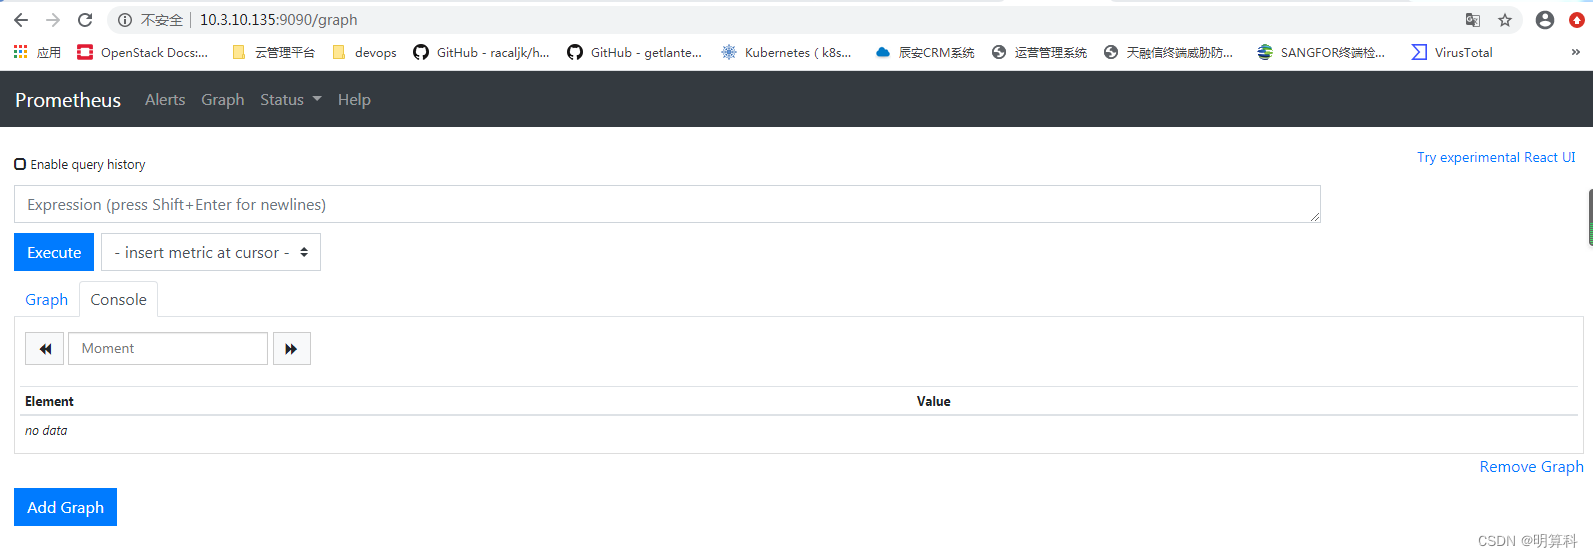
访问URL: http://10.3.10.135:9090/graph
grafana">3.2 安装Grafana
rpm包上传到服务器上后,直接执行:
# yum localinstall grafana-6.5.1-1.x86_64.rpm
安装完之后进行Grafana配置的修改:修改端口 vim /etc/grafana/grafana.ini ,关于配置说明请见:官方文档、Grafana配置和Grafana 配置文件详解
http_port = 3000
加载systemd服务 & 启动
直接启动
# systemctl start grafana-server
#加载
# systemctl daemon-reload
#开启
# systemctl start grafana-server
#查看状态
# systemctl status grafana-server
#开启启动
# systemctl enable grafana-server.service
日志&数据目录 日志目录: 配置为在引导时启动 数据目录:
访问URL: granafa默认端口为3000,可以在浏览器中输入
http://10.3.10.135:3000/ granafa首次登录账户名和密码admin/admin,可以修改
用户名:admin
密码:admin

3.3安装Exporter
在3.1和3.2操作中,已经把Prometheus和Grafana安装完毕,现在开始安装Exporter来采集数据。 Exporter是Prometheus的一类数据采集组件的总称。它负责从目标处搜集数据,并将其转化为Prometheus支持的格式。与传统的数据采集组件不同的是,它并不向中央服务器发送数据,而是等待中央服务器主动前来抓取,默认的抓取地址为 http://CURRENT_IP:9100/metrics
3.3.1 Linux主机监控
node_exporter的作用是用于机器系统数据收集,监控服务器CPU、内存、磁盘、I/O、网络等等信息。
3.3.1.1安装node_exporter
准备介质,上传到服务器
node_exporter-0.18.1.linux-amd64.tar.gz
解压
tar xvf node_exporter-0.18.1.linux-amd64.tar.gz
cp node_exporter-0.18.1.linux-amd64/node_exporter /usr/sbin/
帮助
node_exporter --help
开启,端口:9199
node_exporter --web.listen-address=:9199
添加用户prometheus
useradd --no-create-home --shell /bin/false prometheus
加载systemd服务 & 启动 vi /etc/systemd/system/node_exporter.service
[Unit]
Description=node_exporter
Documentation=https://prometheus.io/
After=network.target
[Service]
Type=simple
User=prometheus
ExecStart=/usr/sbin/node_exporter --web.listen-address=:9199
Restart=on-failure
[Install]
WantedBy=multi-user.target
systemctl 启动
# 加载
systemctl daemon-reload
# 开机启动
systemctl enable node_exporter.service
# 启动
systemctl start node_exporter
# 查看状态
systemctl status node_exporter
启动 node_exporter 服务并设置开机启动
# systemctl daemon-reload
# systemctl enable node_exporter.service
# systemctl start node_exporter.service
# systemctl status node_exporter.service
# systemctl restart node_exporter.service
# systemctl start node_exporter.service
# systemctl stop node_exporter.service
此时,node_exporter启动后已经开始采集指标信息,node_exporter启动成功后, 你就可以通过如下api看到你的监控数据了(将下面的node_exporter_server_ip替换成你的node_exporter的IP地址, 放到浏览器中访问就可以了 ). 可以通过地址访问: http://10.3.10.135:9199/metrics

3.3.1.2可视化监控配置
上面已经安装部署好了Prometheus、Grafana和Exporter,现在需要把这3者联系起来进行数据展示。如已经安装了node_exporter,需要把node_exporter采集的信息配置到Prometheus上。即修改Prometheus配置文件: 为了更好的展示, 接下来我们将这个api 配置到 prometheus server中, 并通过grafana进行展示. 将 node_exporter 加入 prometheus.yml配置中
vi /etc/prometheus/prometheus.yml
  - job_name: 'Linux'
    file_sd_configs:
    - files: ['/etc/prometheus/sd_cfg/Linux.yml']
      refresh_interval: 5s
并在文件/etc/prometheus/sd_cfg/Linux.yml中写入如下内容
- targets: ['IP地址:9100']
  labels:
    name: Linux-node1[这里建议给每个主机打个有意义的标签,方便识别.]
例如:

这样做的好处是, 方便以后配置监控自动化, 规范化, 将每一类的监控放到自己的配置文件中, 方便维护. 当然, 如果你的服务器少, 要监控的组件少的话, 你也可以将配置都写入prometheus的主配置文件prometheus.yml中
重启Prometheus:
systemctl restart Prometheus
重载prometheus配置
curl -X POST http://localhost:9090/-/reload
3.3.1.3查看监控端是否介入

发现 target 中只有 prometheus server, 因为我们还没有加入其他监控, 下面进行介绍, 后续还将介绍如何监控 mysql, redis, RabbitMQ, Kafka, nginx, java等常见服务.
grafana导入linux模板" style="background-color:transparent;">3.3.1.4 Grafana导入Linux模板
Granfana 导入Linux主机监控图表
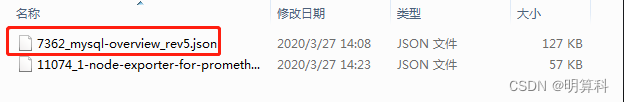
推荐图表ID:https://grafana.com/dashboards/11074
操作步骤:
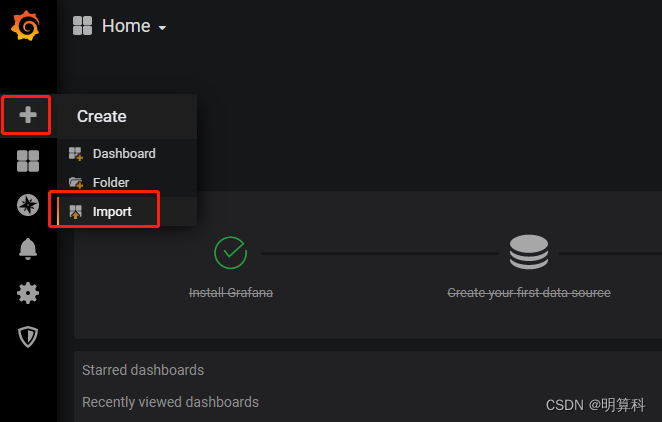
Grafana首页-->左上角图标-->Dashboard-->import

Upload已下载至本地的json文件(或者使用dashboard id,如这里的11074),如下:


数据源选择"prometheus",即添加的数据源name,点击"Import"按钮,如下:

配置完保存后即可看到逼格非常高的系统主机节点监控信息,包括系统运行时间, 内存和CPU的配置, CPU、内存、磁盘、网络流量等信息, 以及磁盘IO、CPU温度等信息。

3.3.2 Mysql数据库监控
mysqld_exporter的作用是用于MySQL数据库数据收集。
3.3.2.1安装mysqld_exporter
准备介质,上传到服务器
mysqld_exporter-0.12.1.linux-amd64.tar.gz
解压
tar xvf mysqld_exporter-0.12.1.linux-amd64.tar.gz
cp mysqld_exporter /usr/sbin/
帮助
mysqld_exporter --help
mysqld_exporter需要连接Mysql,首先为它创建用户并赋予所需要的权限:
登录mysql为exporter创建账号并授权
mysql> set global validate_password_policy=LOW;
# 创建数据库用户。
mysql> CREATE USER 'exporter'@'localhost' IDENTIFIED BY 'exporter';
# 可查看主从运行情况查看线程,及所有数据库。
mysql> GRANT PROCESS, REPLICATION CLIENT, SELECT ON *.* TO 'exporter'@'localhost';
mysql> flush privileges;
2:创建.my.cnf文件,mysql配置文件、运行时可免密码连接数据库
vi /usr/local/mysql_exporter/.my.cnf
[client]
host=10.3.10.136
port=3306
user=root
password=Intel@123456
systemctl启动mysqld_exporter,编辑系统启动文件
vi /etc/systemd/system/mysqld_exporter.service
[Unit]
Description=mysqld_exporter
Documentation=https://prometheus.io/
After=network.target
[Service]
Type=simple
User=prometheus
ExecStart=/usr/sbin/mysqld_exporter --web.listen-address=:9104 --config.my-cnf=/usr/local/mysql_exporter/.my.cnf
Restart=on-failure
[Install]
WantedBy=multi-user.target
启动
# systemctl daemon-reload
# systemctl enable mysqld_exporter
# systemctl restart mysqld_exporter
# systemctl status mysqld_exporter
也可以直接运行:
./mysqld_exporter --config.my-cnf=/usr/local/mysql_exporter/.my.cnf
此时,mysqld_exporter启动后已经开始采集指标信息,可以通过地址访问:
http://10.3.10.136:9104/metrics

3.3.2.2可视化配置
Prometheus配置: 修改prometheus.yml加入MySql节点,将mysqld_exporter加入 prometheus.yml配置中
vi /etc/prometheus/prometheus.yml
  - job_name: 'Mysql'
    file_sd_configs:
    - files: ['/etc/prometheus/sd_cfg/Mysql.yml']
      refresh_interval: 5s

并在文件/etc/prometheus/sd_cfg/Mysql.yml中写入如下内容
- targets: ['10.3.10.136:9104']
  labels:
    instance: node_exporter_mysql_10.3.10.136
检查并重启服务
promtool check config /etc/prometheus/prometheus.yml
重启prometheus生效
# systemctl restart prometheus
# systemctl status prometheus
3.3.2.3 查看监控端是否介入

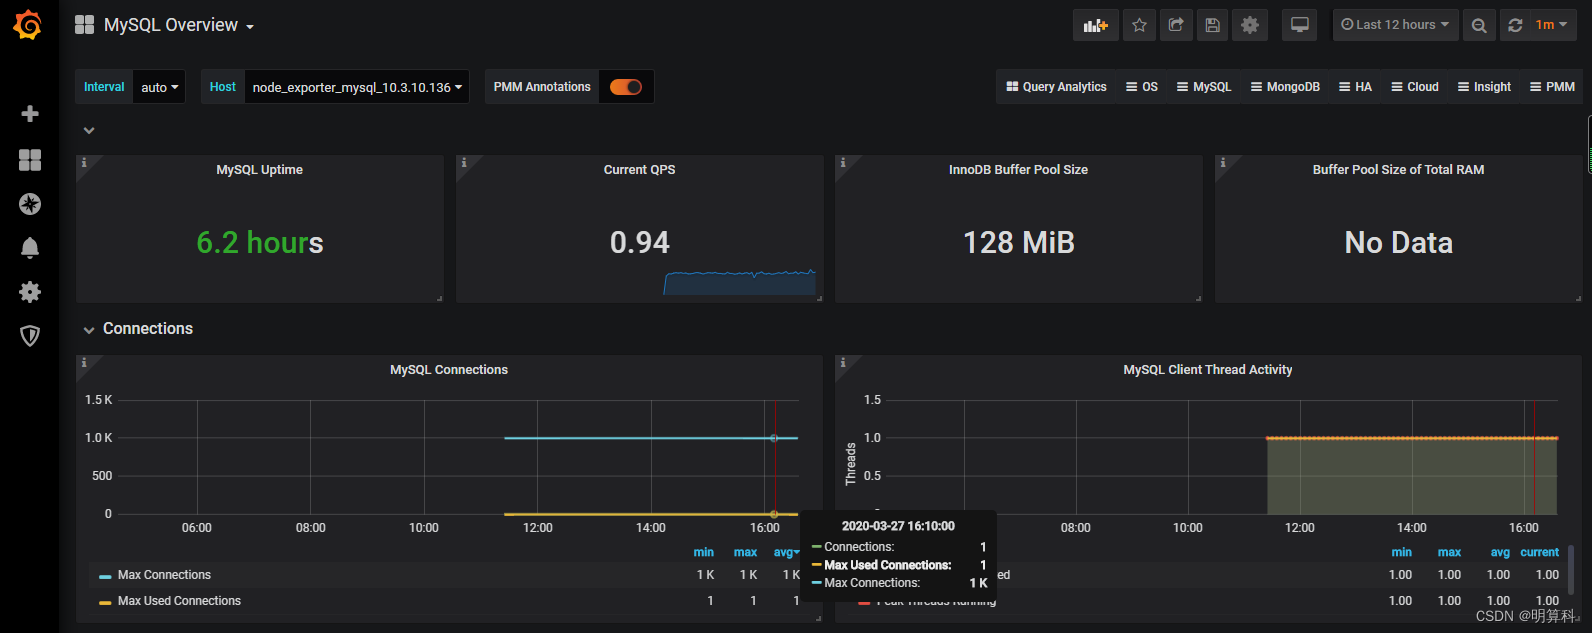
3.3.2.4 Granfana 导入Mysql 监控图表
Granfana 导入Mysql监控图表
推荐图表ID:https://grafana.com/dashboards/7362
操作步骤:
Grafana首页-->左上角图标-->Dashboard-->import
Upload已下载至本地的json文件(或者使用dashboard id,如这里的7362),如下:
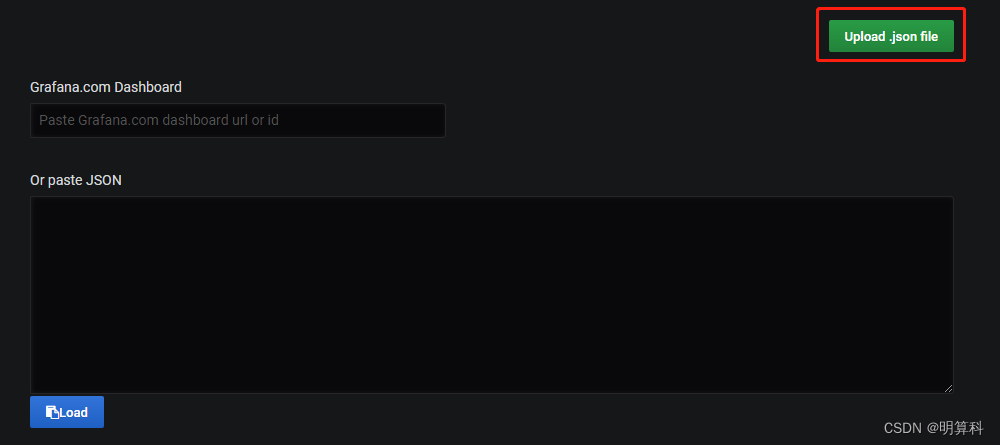
数据源选择"prometheus",即添加的数据源name,点击"Import"按钮,如下:

Mysql监控展示