可观测性
可观测性是指通过从各种IT服务或组件中收集并积累监控数据、系统日志、运行指标等数据,来了解当前系统或应用程序整个架构服务的当前状态,通过可指标化或图形化监视、查看整个系统服务的任意节点、任意时间期间的运行结果,从而对系统服务的运行健康状况有全面的了解与把控;
通过跟踪ID或在分布式系统(尤其是容器化应用程序或微服务架构)的所有节点中,追踪请求到响应的整个过程,并通过技术手段收集整个过程中的日志、指标、Trace等数据,形成一个完整的数据链路,从而为可观测性分析与展示提供基础数据。
通过可观测性指标的跟踪,可以快速分析和观察系统,从而轻松发现系统故障、性能瓶颈、节点互连等问题,确保服务的可靠、性能和安全等。也是现在IT业务建设过程中,必不可少的运维与监控技术方案之一;
推荐一篇好文章,快速了解可观测性:初学指南:什么是可观测性? - 知乎
运行环境
虚拟主机linux * 1 ,ip: 192.168.1.xxx(内网) ,配置:8核 * 16G * 200G硬盘
Grafana、Loki、Tempo、Prometheus等非集群模式,全部单实例部署
注意:本文除了IDEA开发环境外,所有服务均安装在此虚拟主机上;
平台流程

- 向应用、服务、网关发起请求
- 服务所在的环境下,启用agent代理,负责采集metrics、logs、traces等数据
- Agent代理将采集的metrics数据推送到Prometheus服务,logs日志推送到loki服务,traces数据推送到Tempo服务
- Grafana集成Prometheus、Loki、Tempo数据源,通过数据查询和内置功能搜索与展示日志链路;
Loki
简介
Grafana Loki 是一个日志组件服务,与其他日志系统不同,Loki 不会对日志内容进行索引,而只会对有关日志的元数据(日志流的一组标签)进行索引:标签(就像 Prometheus 标签)。
Loki 是一个受Prometheus启发的水平可扩展、高可用、多租户日志聚合系统。Loki 与 Prometheus 的不同之处在于,它关注日志而不是指标,并通过推送而不是拉取来收集日志。
然后,日志数据本身会被压缩并以块的形式存储在对象存储中,例如 Amazon Simple Storage Service (S3) 或 Google Cloud Storage (GCS),甚至存储在本地文件系统中。
Loki 的设计非常经济高效且具有高度可扩展性。小索引和高度压缩的块简化了操作并显着降低了 Loki 的成本。Loki 提供灵活的查询语言:LogQL;
并且通常通过Grafana对 Loki 中存储的日志进行查询并对可视化查询结果展示。配置Grafana中的告警模块,可以设置日志指标并监控日志异常行为;
Loki 与 Grafana、Mimir 和 Tempo 集成,提供完整的可观察性堆栈以及日志、指标和跟踪之间的无缝关联。
下载安装
https://github.com/grafana/loki/releases/download/v2.9.0/loki-linux-amd64.zip
直接解压即可
unzip loki-linux-amd64.zip配置
在安装的目录下,创建:loki-config.yml
vim loki-config.yml并配置文件内容如下:
# 不开启鉴权
auth_enabled: false

# http和grpc端口
server:
  http_listen_port: 3100
  grpc_listen_port: 9096

# 数据索引和块存储配置
common:
  path_prefix: /tmp/loki
  storage:
    filesystem:
      chunks_directory: /tmp/loki/chunks
      rules_directory: /tmp/loki/rules
  replication_factor: 1
  ring:
    instance_addr: 127.0.0.1
    kvstore:
      store: inmemory

# 缓存管理
query_range:
  results_cache:
    cache:
      embedded_cache:
        enabled: false

# 数据存储管理
schema_config:
  configs:
    - from: 2023-09-01
      store: boltdb-shipper
      object_store: filesystem
      schema: v11
      index:
        prefix: index_
        period: 24h

# 告警推送接口
#ruler:
#  alertmanager_url: http://localhost:9093

# 数据块的存储策略
chunk_store_config:
  max_look_back_period: 240h

# 保存创建数据索引和块等信息的表存储策略
table_manager:
  retention_deletes_enabled: true
  retention_period: 240h

# 数据块压缩配置
compactor:
  working_directory: /tmp/loki/retention
  shared_store: filesystem
  compaction_interval: 10m
  retention_enabled: true
  retention_delete_delay: 2h
  retention_delete_worker_count: 150
启动
# run loki
nohup ./loki-linux-amd64 --config.file=loki-config.yml > /tmp/null 2>&1 &
Tempo
简介
Grafana Tempo 是一个开源、易于使用且大容量的分布式链路跟踪后端(Trace)。Tempo可将数据存储在对象存储或本地文件中。
Tempo 与 Grafana、Mimir、Prometheus 和 Loki 深度集成。可以将 Tempo 与开源跟踪协议结合使用: Jaeger、Zipkin 或 OpenTelemetry。
Tempo 与许多现有的开源工具集成良好:
- Grafana使用内置Tempo 数据源提供对 Tempo 的本机支持。
- Grafana Loki具有强大的查询语言LogQL v2,允许您过滤您关心的请求,并使用Grafana 中的派生字段支持跳转到跟踪。
- Prometheus 示例可让您通过单击记录的示例从 Prometheus 指标跳转到 Tempo 跟踪。
Tempo完全支持OpenTelemetry数据采集和标准规范,因此可以将Tempo做为OpenTelemetry协议数据的收集(collector)与存储(存储依赖其它服务或本地文件)中心,无需额外在部署OpenTelemetry相关服务;
安装
https://github.com/grafana/tempo/releases/download/v2.2.3/tempo_2.2.3_linux_amd64.tar.gz
直接解压即可
tar -zxvf tempo_2.2.3_linux_amd64.tar.gz配置
在安装的目录下,创建:tempo-config.yml
vim tempo-config.yml并配置文件内容如下:
# http监听端口
server:
  http_listen_port: 3200

# 支持otlp协议数据的本地接收器http和grpc端口,分别默认为4318和4317
distributor:
  receivers: # This configuration will listen on all ports and protocols that tempo is capable of.
      otlp:
        protocols:
          http: # default = 0.0.0.0:4318 http protocol
            endpoint: localhost:4318
          grpc:    # default = 0.0.0.0:4317 http protocol
            endpoint: localhost:4317

# 数据压缩存储有效期48小时
compactor:
  compaction:
    block_retention: 48h   # configure total trace retention here (Default is 14 days (336h))

# 可观测性数据的指标存储配置
metrics_generator:
  registry:
    external_labels:
      source: tempo
      cluster: linux-microservices
  storage:
    path: /tmp/tempo/generator/wal
    remote_write:
    - url: http://localhost:9090/api/v1/write
      send_exemplars: true

# 支持多种存储方式,如:s3、local等
storage:
  trace:
    backend: local     # 本地存储
    #s3:
    #  endpoint: s3.us-east-1.amazonaws.com
    #  bucket: grafana-traces-data
    #  forcepathstyle: true
    #  #set to true if endpoint is https
    #  insecure: true
    #  access_key: # TODO - Add S3 access key
    #  secret_key: # TODO - Add S3 secret key
    wal:
      path: /tmp/tempo/wal      # where to store the the wal locally
    local:
      path: /tmp/tempo/blocks    # 数据存储目录

# 指标类型配置
overrides:
  metrics_generator_processors: [service-graphs, span-metrics]
启动
# run tempo
nohup ./tempo --config.file=./tempo-config.yml > log.out 2>&1 &
Prometheus
简介
Prometheus 是云原生计算基金会项目,是一个系统和服务监控系统。它以给定的时间间隔从配置的目标收集指标,评估规则表达式,显示结果,并可以在观察到指定条件时触发警报。
Prometheus监控系统包括丰富的多维数据模型、简洁而强大的PromQL查询语言、高效的嵌入式时间序列数据库以及与第三方系统的150多个集成
Prometheus 与其他指标和监控系统的区别在于:
- 多维数据模型(由指标名称和键/值维度集定义的时间序列)
- PromQL,一种强大而灵活的查询语言,可以利用这种维度
- 不依赖分布式存储;单个服务器节点是自治的
- 用于时间序列收集的HTTP拉模型
- 通过批处理作业的中间网关支持推送时间序列
- 通过服务发现或静态配置发现目标
- 多种图形和仪表板支持模式
- 支持分层和水平联合
安装
https://github.com/prometheus/prometheus/releases/download/v2.47.0/prometheus-2.47.0.linux-amd64.tar.gz
直接解压即可
tar -zxvf prometheus-2.47.0.linux-amd64.tar.gz配置
在安装的目录下,已存在:prometheus.yml,默认安装下无需变更
# my global config
global:
  scrape_interval: 15s # Set the scrape interval to every 15 seconds. Default is every 1 minute.
  evaluation_interval: 15s # Evaluate rules every 15 seconds. The default is every 1 minute.
  # scrape_timeout is set to the global default (10s).

# Alertmanager configuration
alerting:
  alertmanagers:
    - static_configs:
        - targets:
          # - alertmanager:9093

# Load rules once and periodically evaluate them according to the global 'evaluation_interval'.
rule_files:
  # - "first_rules.yml"
  # - "second_rules.yml"

# A scrape configuration containing exactly one endpoint to scrape:
# Here it's Prometheus itself.
scrape_configs:
  # The job name is added as a label `job=<job_name>` to any timeseries scraped from this config.
  - job_name: "prometheus"

    # metrics_path defaults to '/metrics'
    # scheme defaults to 'http'.

    static_configs:
      - targets: ["localhost:9090"]
启动
# run prometheus & tsdb data timeout 2 day
nohup ./prometheus --config.file=./prometheus.yml --storage.tsdb.retention.time=2d --web.enable-remote-write-receiver > log.out 2>&1 &
启动参数说明
- --storage.tsdb.retention.time=2d 默认tsdb存储数据是15天,按需更改即可
- --web.enable-remote-write-receiver 表示启用远程写入服务,支持第三方组件推送并写入远程数据
其它命令参数可通过./prometheus -h 查看帮助信息
Grafana
简介
Grafana 开源是开源可视化和分析软件。它允许您查询、可视化、警报和探索您的指标、日志和跟踪,无论它们存储在何处。它为您提供了将时间序列数据库 (TSDB) 数据转换为富有洞察力的图表和可视化的工具。
Grafana支持非常多的数据源,同时又有强大的可视化、告警等非常强大的功能,因此在数据分析、指标追踪和数据查询等方面,需多的公司在运维指标、日志分析、大屏展示等有实际应用;在项目监控、运维、服务器指标等业务上,是一个强大可靠的分析平台;
安装
wget https://dl.grafana.com/enterprise/release/grafana-enterprise-10.1.2.linux-amd64.tar.gz
直接解压即可
tar -zxvf grafana-enterprise-10.1.2.linux-amd64.tar.gz启动
#start grafana server
nohup ./grafana-server > /tmp/null 2>&1 &
配置Prometheus

配置Loki

在数据源中对派生字段进行配置
Derive fields
- name:TraceID //字段名称
- Regex:((?:traceID|trace_id)=(\w+)) // 正则提取规则
- Query:${__value.raw} //Grafana内置字段,表示Loki日志中查询的数据行对象
- Internal link: Tempo //内置链接,当数据带有TraceID日志链路跟踪ID时,会出现一个"Tempo“按钮,可直接跳转到Tempo跟踪链接数据展示模块;
配置Tempo
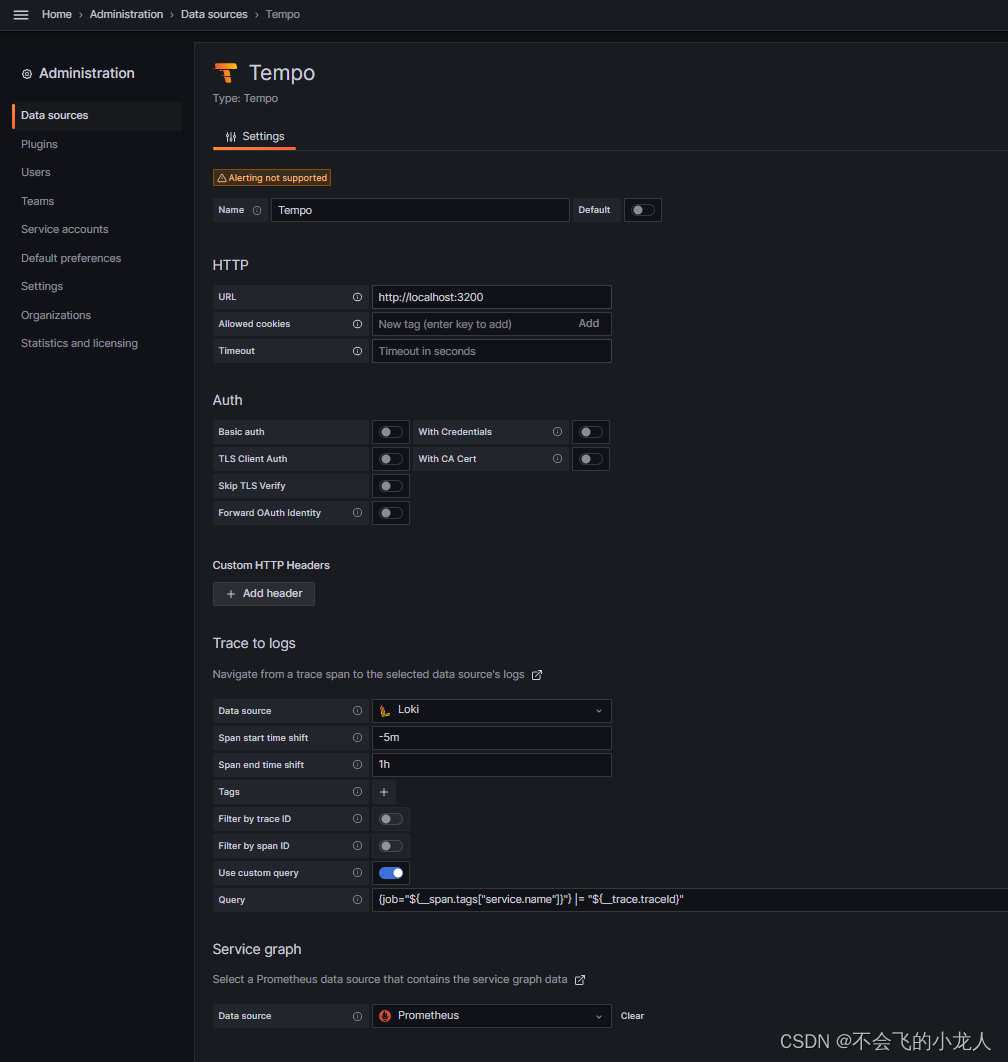
核心配置
HTTP
- url: http://localhost:3200
Trace to logs
- Data source: Loki
- Span start time shift: -5m //用于Tempo中通过TraceID查询loki日志用,开始时间前移5分钟
- Span end time shift: 1h /用于Tempo中通过TraceID查询loki日志用,结束时间前移1小时
- Use custom query: 开启
- Query: {job="${__span.tags["service.name"]}"} |= "${__trace.traceId}" //job名称是loki中日志里的标签,通过agent采集器配置上传
注:Query自定义变量,__trace.traceId为跟踪ID,service.name为通过opentelemetry配置采集的otel.service.name值,如:-javaagent:./opentelemetry-javaagent.jar -Dotel.service.name=test_demo
自定义变量,参见文档:Traces | Grafana Cloud documentation
TraceID查询Loki日志时间配置用法,如:假设日志打印时间为2023-01-01 10:05:00,应用-5m和1h配置后,点击TraceId跳转到Loki中查询时,将时间范围变更为:2023-01-01 10:00:00到2023-01-01 11:05:00;其中的开始时前移5分钟,此处根据业务需要配置,通常查一个埋点位置前后30分钟内的就足够了(前分分别设置-30m和30m);
Service graph
- Data source: Prometheus
Loki search
- Data source: Loki
TraceID query
- Use time range in query: 开启
- Time shift for start of search: 30m
- Tiime shift for end of search: 30m
注意事项
在配置数据源过程中,有些Data source选项依赖另一个来源,如果此时Data source无此数据源,可以先默认不选择,待所有Data source安装完毕后,再重新修改数据配置;如:Tempo中的Trece To Logs依赖Loki,如果先安装Tempo,后安装Loki,那么在Tempo此配置中无法找到Loki选项,待Loki安装后,再返回修改Tempo配置即可;
Agent
简介
Grafana Agent 是一个独立、支持多节点的数据收集器。它的设计灵活、高性能,并且与 Prometheus 和 OpenTelemetry 等多个生态系统兼容。
Grafana Agent由以下几个子系统模块组成:
- 指标 子系统围绕 Prometheus 收集 Prometheus 指标并通过 Prometheusremote_write协议转发它们。
- 日志子系统围绕 Grafana Promtail 收集日志并将其转发给 Grafana Loki。
- 跟踪子系统围绕OpenTelemetry Collector,用于收集跟踪并将其转发到 Grafana Tempo 或任何与 OpenTelemetry 兼容的端点。
安装
https://github.com/grafana/agent/releases/download/v0.36.1/grafana-agent-linux-amd64.zip
直接解压即可
unzip grafana-agent-linux-amd64.zip配置
在安装的目录下,创建:agent-config.yml
vim agent-config.yml并配置文件内容如下:
# 本地agent的日志打印级别
server:
  log_level: info

# 抓取指标,完全兼容prometeus
metrics:
  global:
    scrape_interval: 1m
    remote_write:
      # 推送到prometeus服务的地址,注:prometeus需启用--web.enable-remote-write-receiver
      - url: http://192.168.1.3:9090/api/v1/write
  configs:
    - name: default
      scrape_configs:
        - job_name: agent
          static_configs:
            - targets: ['127.0.0.1:12345']

# loki日志代理采集配置,完全兼容Promtail配置
logs:
  configs:
  - name: default
    positions:
      filename: /tmp/agent/positions.yaml
    scrape_configs:
      - job_name: varlogs
        static_configs:
          - targets: [localhost]
            labels:
              job: varlogs
              __path__: /data/log/catalina.log
    clients:
      - url: http://192.168.1.3:3100/loki/api/v1/push

# trace 链路追踪配置(可观察性)
traces:
  configs:
  - name: default
    # 代理接收其它应用的traces数据,替代opentelemetry-collector接收器
    receivers:
      jaeger:
        protocols:
          grpc: # listens on the default jaeger grpc port: 14250
      otlp:
        protocols:
          http:  # default = 0.0.0.0:4318 http protocol
            endpoint: 0.0.0.0:14318
          grpc:  # default = 0.0.0.0:4317 grpc protocol
            endpoint: 0.0.0.0:14317
    # 将otlp数据发送到远程服务
    remote_write:
      - endpoint: 192.168.1.3:4317
        insecure: true  # only add this if TLS is not required
    batch:
      timeout: 5s
      send_batch_size: 100
    automatic_logging:
      backend: stdout
      #backend: logs_instance
      #logs_instance_name: default
      roots: true
    service_graphs:
      enabled: true

# 节点指标配置,用于采集中间件的模块配置
integrations:
  agent:
    enabled: true
  # linux采集指标
  node_exporter:
    enabled: true
    disable_collectors: # 禁用一些高基数的指标
      - ipvs
      - btrfs
      - infiniband
      - xfs
      - zfs
  # windows采集指标
#  windows_exporter:
#    enabled: true
#    # 采集部份指标
#    enabled_collectors: "cpu,cs,logical_disk,net,os,service,system,tcp,process"
启动
# run agent
nohup ./grafana-agent-linux-amd64 --config.file=agent-config.yml > /tmp/null 2>&1 &
注意:本文后续演示示例部份,将在windows环境下安装Agent代理,实际和linux环境上的使用与配置一样
注意事项
Agent支持非常多服务指标采集,如:mysql,kafka,mogodb,linux,wdinwos等节点或服务指标采集,在windows下的默认采集指标非常多,可以通过部署日志查看,也可以通过官方文档查找对应的配置说明
ts=2023-09-19T11:52:28.1277995Z caller=windows_exporter_windows.go:43 level=info integration=windows_exporter msg="enabled windows_exporter collectors" collectors=ad,adcs,adfs,cache,container,cpu,cpu_info,cs,dfsr,dhcp,diskdrive,dns,exchange,fsrmquota,hyperv,iis,logical_disk,logon,memory,mscluster_cluster,mscluster_network,mscluster_node,mscluster_resource,mscluster_resourcegroup,msmq,mssql,net,netframework_clrexceptions,netframework_clrinterop,netframework_clrjit,netframework_clrloading,netframework_clrlocksandthreads,netframework_clrmemory,netframework_clrremoting,netframework_clrsecurity,os,process,remote_fx,scheduled_task,service,smtp,system,tcp,teradici_pcoip,terminal_services,textfile,thermalzone,time,vmware,vmware_blast其中很多高基数指标,可以根据业务需要,采集部份指标即可
enabled_collectors: "cpu,cs,logical_disk,net,os,service,system,tcp,process"示例
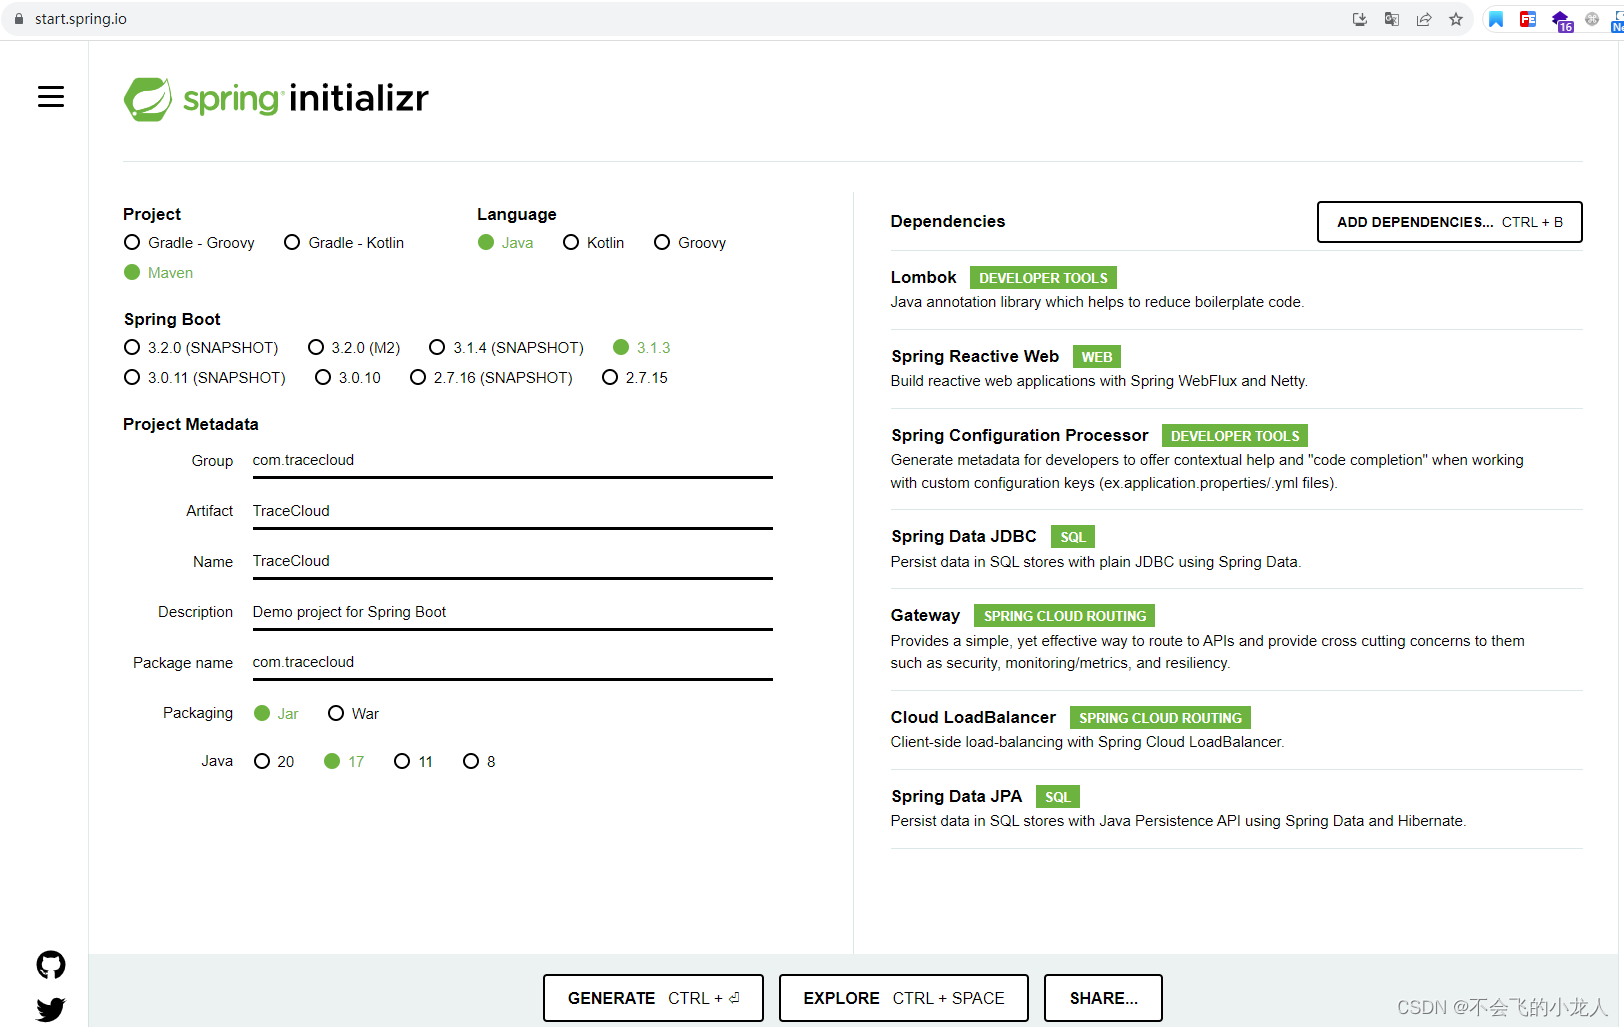
SpringBoot工程
创建一个Java演示工具,用于采集应用的日志、监控数据等;以springCloud项目为例;
- 项目:TraceCloud
- 子模块:customer,gateway,producer
- Spring框架:springBoot 3.1.3 和 springCloud 2022.0.4
- JDK:17+
- Mysql: 8.0+

工程是通过spring官方的 spring initializr页面建的;
工程代码就不单独贴了,我上传到GitCode里,自行下载下来看吧
GitCode下载地址:不会飞的小龙人 / TraceCloud · GitCode
Agnet配置
此段内容前面的Agent下载安装,是以linux环境为例,为了配合本地电脑的IDEA开发与调试,本章节以windows下的Grafana Agent为例,文章前面描述的agent-config.yml配置则可以通用,和操作平台无关;
在Github的grafana agent项目的相同打包界面,下载windows版本解压即可使用;
我们对前面的Agent配置进行更改,修改为抓取当前演示工程的日志。无需更改metrics和traces(注意IP和端口,根据实际服务部署修改),主要更改 logs 配置项,并去掉integrations.node_exporter配置,保留只采集windows节点指标,改动如下:
#...略
# loki日志代理采集配置,完全兼容Promtail配置
logs:
  configs:
  - name: default
    positions:
      filename: /tmp/agent/positions.yaml
    scrape_configs:
      - job_name: customer
        static_configs:
          - targets: [localhost]
            labels:
              group: traceCloud
              job: customer
              __path__: D:\Workspaces\TraceCloud\logs\customer-info.log
      - job_name: gateway
        static_configs:
          - targets: [localhost]
            labels:
              group: traceCloud
              job: gateway
              __path__: D:\Workspaces\TraceCloud\logs\gateway-info.log
      - job_name: producer
        static_configs:
          - targets: [localhost]
            labels:
              group: traceCloud
              job: producer
              __path__: D:\Workspaces\TraceCloud\logs\producer-info.log
    clients:
      - url: http://192.168.1.3:3100/loki/api/v1/push

# 节点指标配置,用于采集中间件的模块配置
integrations:
  agent:
    enabled: true
  # windows采集指标
  windows_exporter:
    enabled: true
    # 采集部份指标
    enabled_collectors: "cpu,cs,logical_disk,net,os,service,system,tcp,process"
# ...略
cmd命令行启动
grafana-agent-windows-amd64.exe --config.file=agent-config.ymlopentelemetry探针
介绍
OpenTelemetry是CNCF的一个可观测性项目,旨在提供可观测性领域的标准化方案,解决观测数据的数据模型、采集、处理、导出等的标准化问题。
OpenTelemetry是工具、API 和 SDK 的集合。使用它来检测、生成、收集和导出遥测数据(指标、日志和跟踪),以帮助您分析软件的性能和行为。
OpenTelemetry在Java语言领域采用javaagent探针注入并收集应用程序的数据;javaagent是基于Java字节码进行操作的一种探针技术,使得javaagent可以在JVM执行编译的字节码程序之前进行动态修改;
而OpenTelemetry-javaagent.jar就是基于探针技术而实际,因此可以非常方便的在Java应用程序的打印日志中配置TraceID和SpanID数据注入。
下载
https://github.com/open-telemetry/opentelemetry-java-instrumentation/releases/download/v1.29.0/opentelemetry-javaagent.jar
启动配置
本地以IDEA环境运行,使用opentelemetry-javaagent.jar需要配置到本地IDEA的Run/Debug Configurations里,在VM options参数里加入;
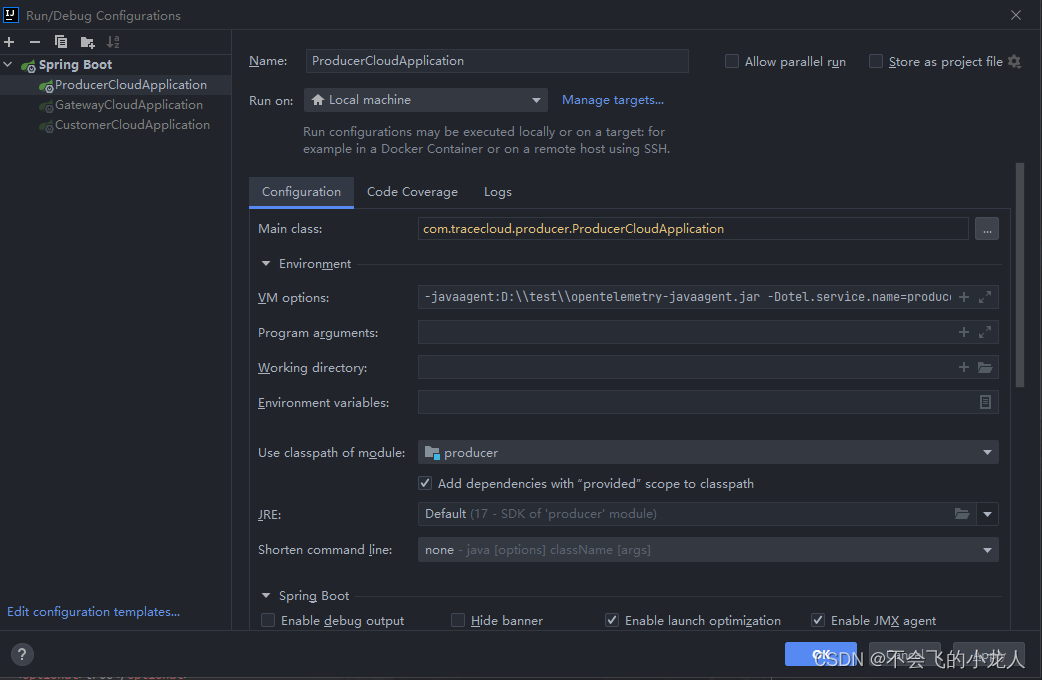
producer配置
-javaagent:D:\\test\\opentelemetry-javaagent.jar -Dotel.service.name=producer -Dotel.traces.exporter=otlp -Dotel.exporter.otlp.endpoint=http://localhost:14317 -Dotel.metrics.exporter=none -Dotel.exporter.otlp.insecure=truegateway配置
-javaagent:D:\\test\\opentelemetry-javaagent.jar -Dotel.service.name=gateway -Dotel.traces.exporter=otlp -Dotel.exporter.otlp.endpoint=http://localhost:14317 -Dotel.metrics.exporter=none -Dotel.exporter.otlp.insecure=truecustomer配置
-javaagent:D:\\test\\opentelemetry-javaagent.jar -Dotel.service.name=customer -Dotel.traces.exporter=otlp -Dotel.exporter.otlp.endpoint=http://localhost:14317 -Dotel.metrics.exporter=none -Dotel.exporter.otlp.insecure=true配置日志跟踪ID
TraceId为日志打印过程中的重要跟踪ID,有的人称为日志埋点ID,表示一次请求事件中,此TraceId会在当前线程执行过程中,出现在日志打印里,如果当前服务有调用下一个http请求,则opentelemetry-javaagent.jar已经适配了多种http请求组件,如:okHttp、apache-httpclient等,会将该TraceId写入请求头部,带到下一个服务中,下一个服务如使用了opentelemetry-javaagent.jar代理的探针模式,会捕获此TraceId继续在此服务日志中打印,从而通过此跟踪ID形成一个完整的请求事件到下游服务之间的链路唯一标识ID;后续通过loki和tempo可以很方便的查询到所有和该TraceId相关的日志与监控数据;
因此在log4j2或springboot默认logging配置里添加 traceID=%X{trace_id} 到日志格式中就行,traceID也是我们在Grafana上集成loki时的伪链接重要查询参数,详情可以看上面的"配置Loki"集成;
log4j2配置
<Property name="LOG_PATTERN">%d{yyyy-MM-dd HH:mm:ss.SSS} %level traceID=%X{trace_id} [%thread] [%class{36}:%L] - %msg%xEx%n</Property>SpringBoot默认日志配置
注:customer、gateway、producer三个模块的application.yml中分别都需添加
# 配置日志
logging:
  level:
    reactor.util: info
    org.springframework.boot: info
  pattern:
    file: "%d{yyyy-MM-dd HH:mm:ss.SSS} ${LOG_LEVEL_PATTERN:-%5p} ${PID:- } traceID=%X{trace_id} --- [%t] %-40.40logger{39} : %m%n%wEx"
    console: "%clr(%d{yyyy-MM-dd HH:mm:ss.SSS}){faint} %clr(${LOG_LEVEL_PATTERN:-%5p}) %clr(${PID:- }){magenta} %clr(traceID=%X{trace_id}){cyan} %clr(---){faint} %clr([%15.15t]){faint} %clr(%-40.40logger{39}){cyan} %clr(:){faint} %m%n%wEx"
  file:
    # 注意name名,根据不同的模块更改日志文件名称
    name: ./logs/producer-info.log
完成上述所有操作和配置后,分别启动customer、gateway、producer三个模块入口程序 XXXXCloudApplication.java,让演示服务保持在线;
HTTP请求
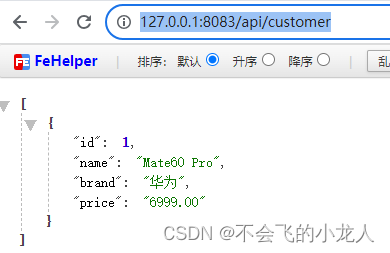
从浏览器中向customer服务发起Http请求,请求ULR:http://127.0.0.1:8083/api/customer

经过上述从浏览器》消费者》网关》生产者一个请求链路,最终获得生产者提供的数据,如下:
控制台日志打印
完成上面一环节点消费者的http请求后,IDEA中三个服务的控制台分别打印了此次请求的日志信息;
消费者(customer)
2023-09-20 11:36:58.593 - INFO 32276 traceID=6fbb0d7230d12c30ed0757ceae560c59 --- [ctor-http-nio-3] c.t.customer.CustomerCloudApplication : http request customer ...网关(gateway)
2023-09-20 11:36:58.942 - INFO 35184 traceID=6fbb0d7230d12c30ed0757ceae560c59 --- [ctor-http-nio-2] c.t.gateway.filter.RouteLogFilter : route customer to producer,route id: producer, http request url http://127.0.0.1:8081/api/producer生产者(producer)
2023-09-20 11:36:59.294 - INFO 16496 traceID=6fbb0d7230d12c30ed0757ceae560c59 --- [ctor-http-nio-2] c.t.producer.ProducerCloudApplication : http request producer ...发现三个服务的TraceID一致,traceID=6fbb0d7230d12c30ed0757ceae560c59 ; 表示此traceID为本次请求的追踪过程的唯一标识ID;
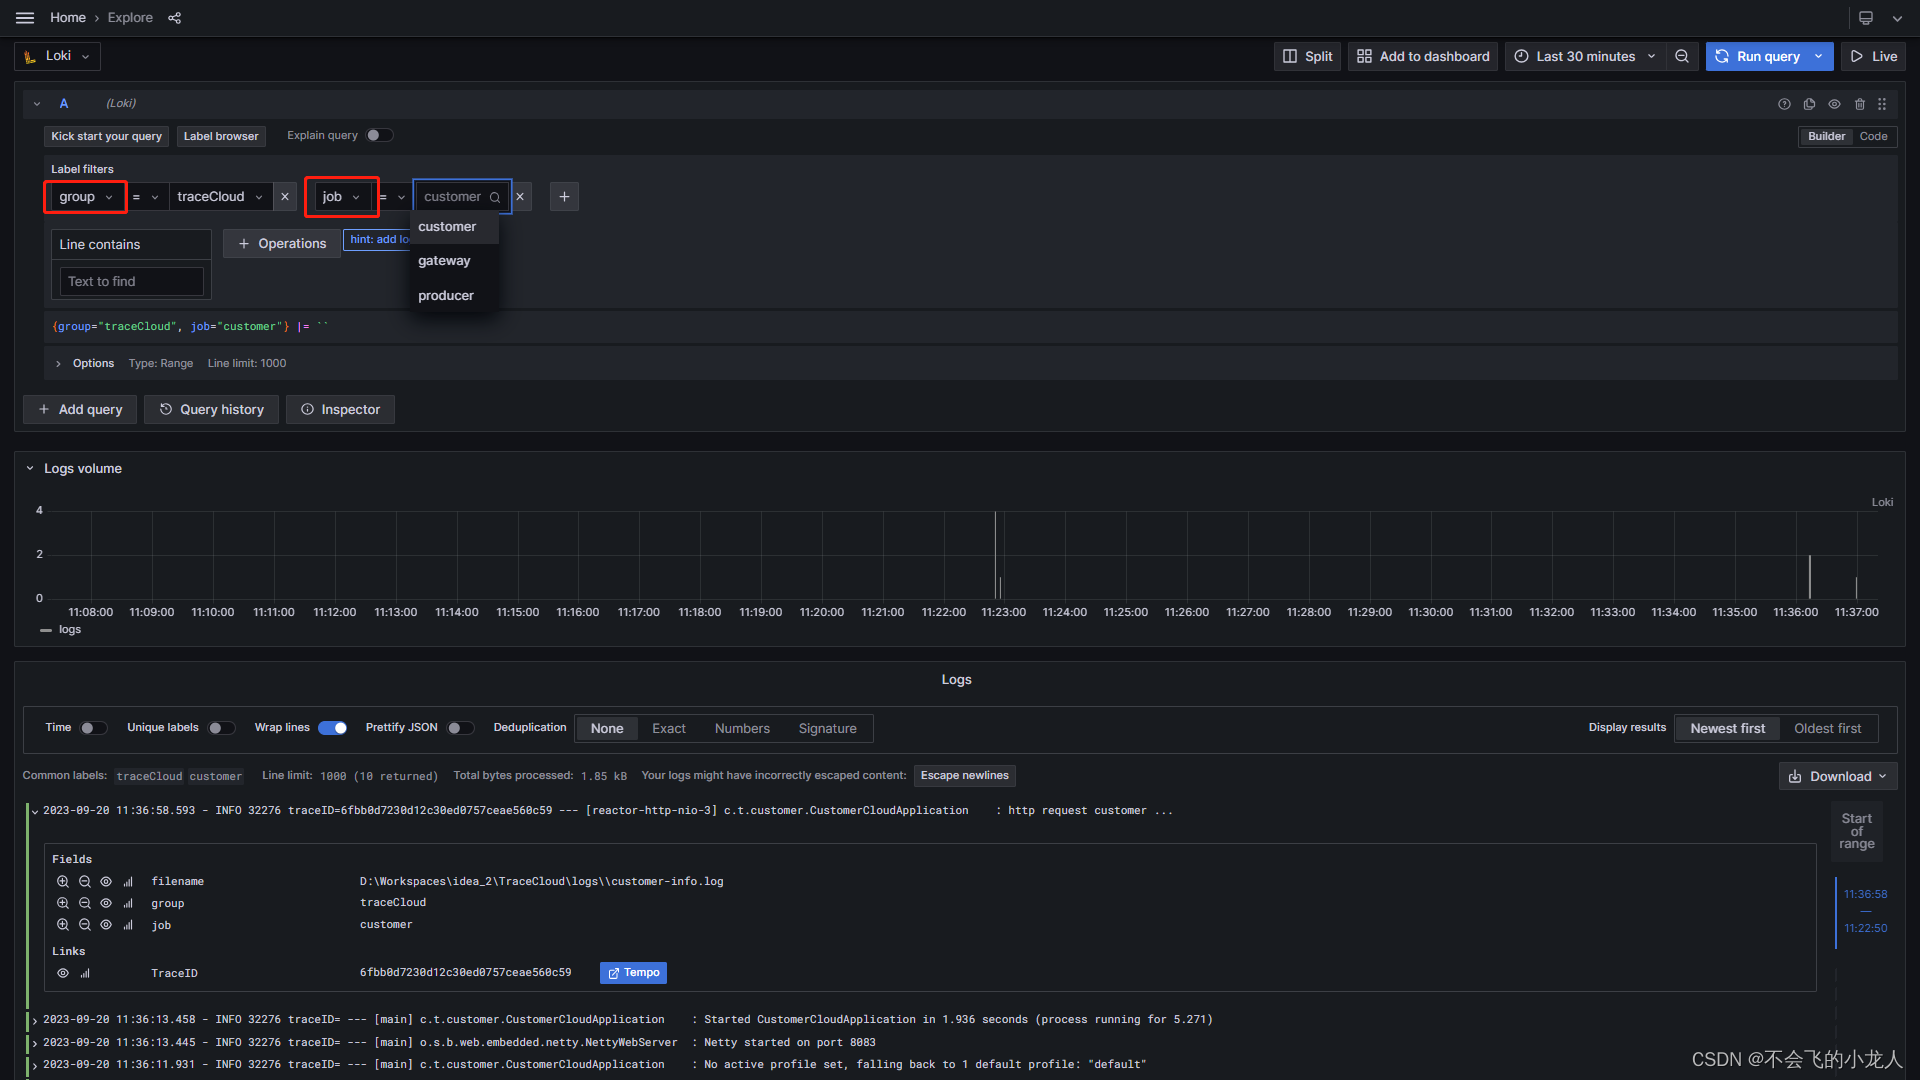
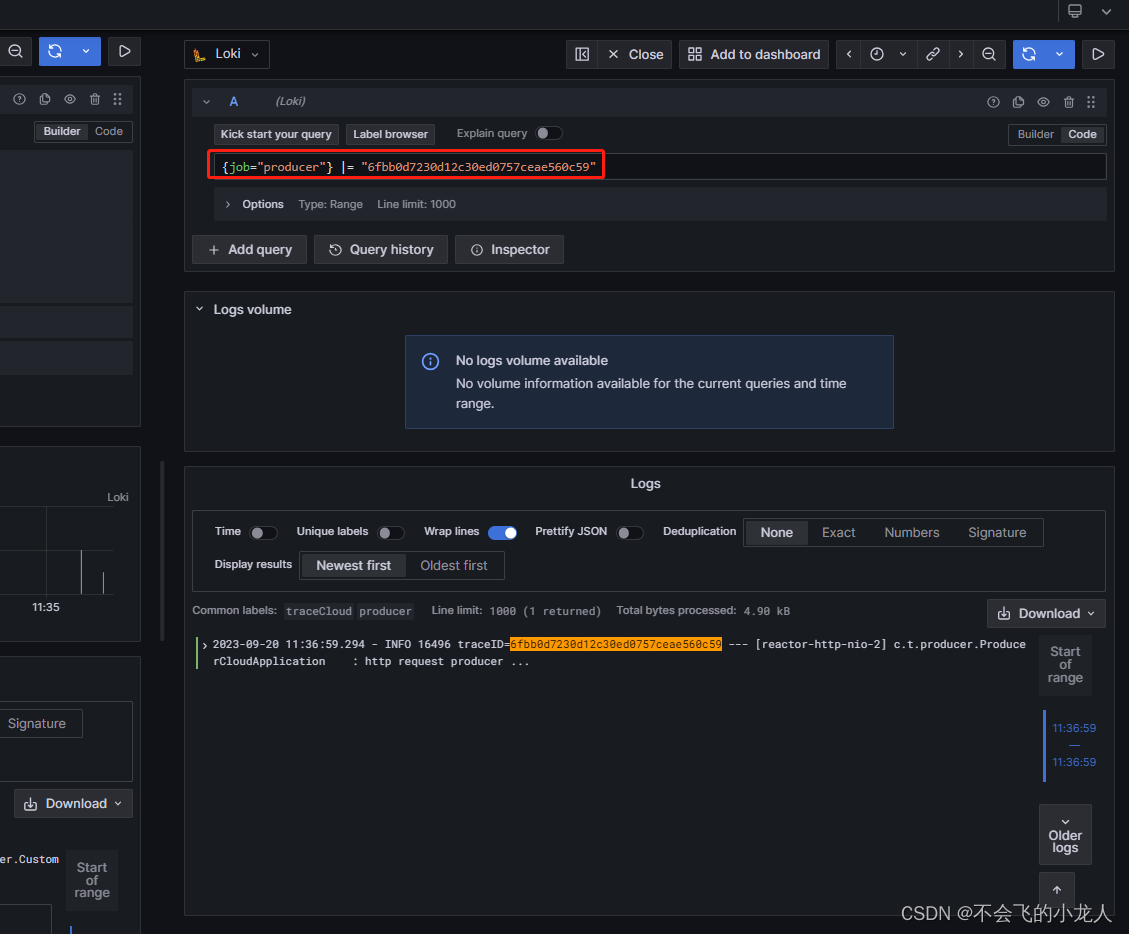
日志搜索
在“Grafana》Explore》Loki”中搜索日志,其中的自定义标签已正常加载,默认搜索:group=traceCloud,job=customer
链路跟踪
点击Loki中搜索的日志行(注意:需要带traceID=xxxx的行),展开区域中有一个Tempo按钮,点击Tempo按钮,打开Tempo链路跟踪分屏页,完整的显示了当前“消费者》网关》生产者” 全流程的请求链路和耗时信息;
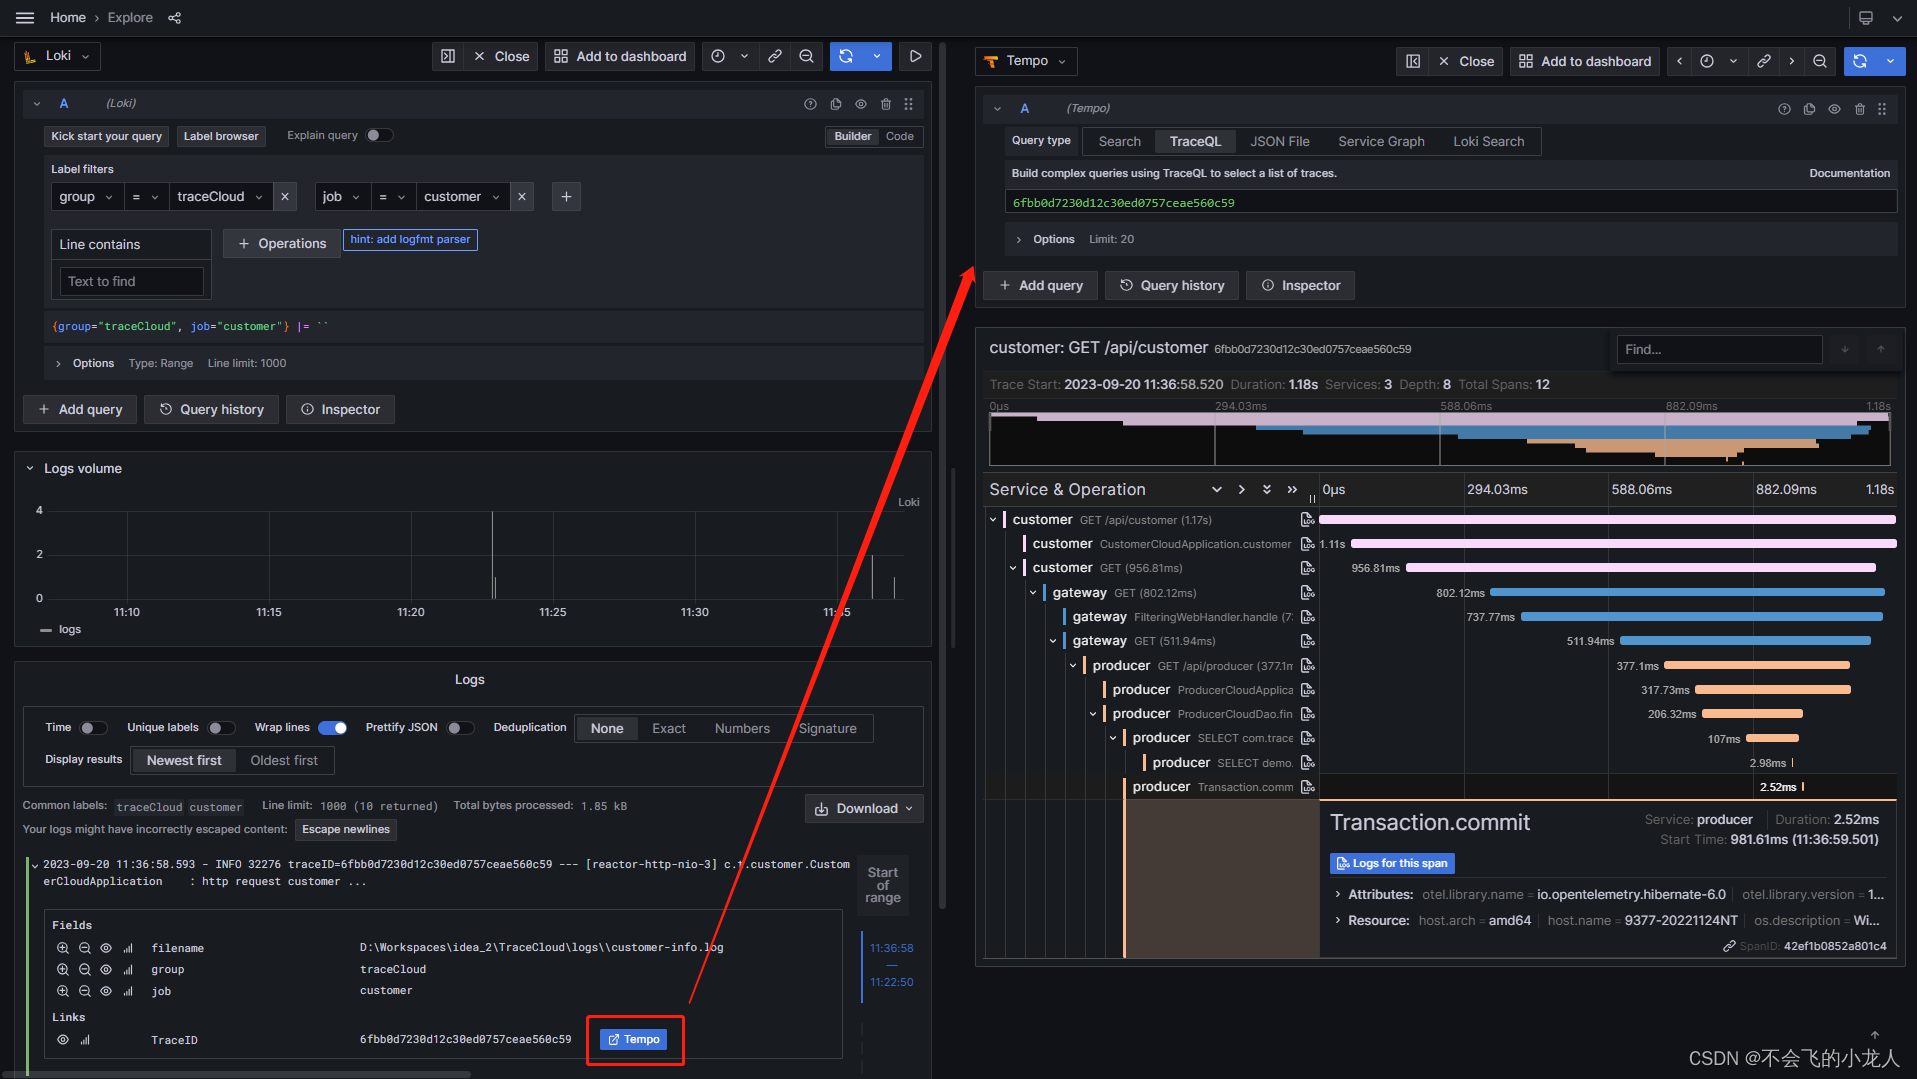
可能点击Tempo分屏页中的Service&Operation列表中的任务节点,点击展示区域的"Logs for this span"可以继续通过此点节信息返回到Loki中查询日志信息;点击后展示如下:
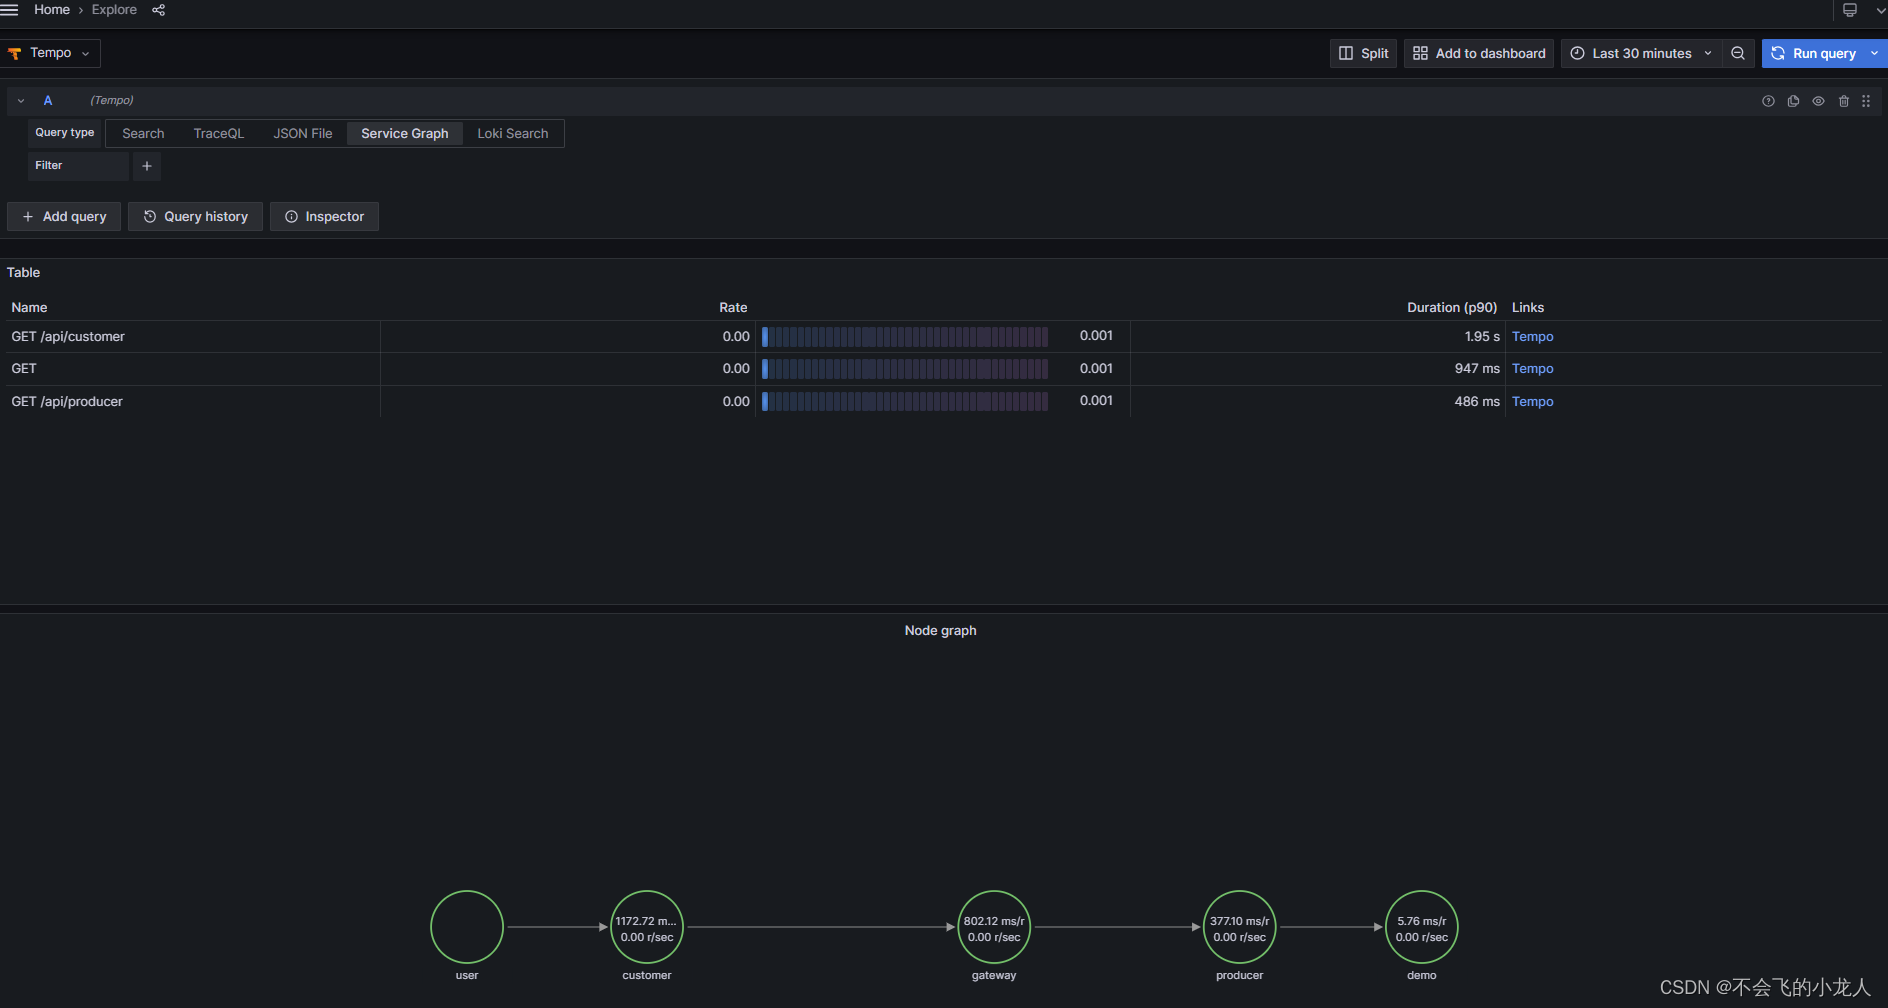
可以通过“Grafana》Explore》Tempo”中的Search功能,查询Agent上报给Tempo跟踪ID(TraceID)来查询详细链路请求和耗时信息;

可以通过“Grafana》Explore》Tempo”中的Service Graph功能,查询节点之前的请求拓扑关系结构,显示一个请求在多个服务之间的调用路线;
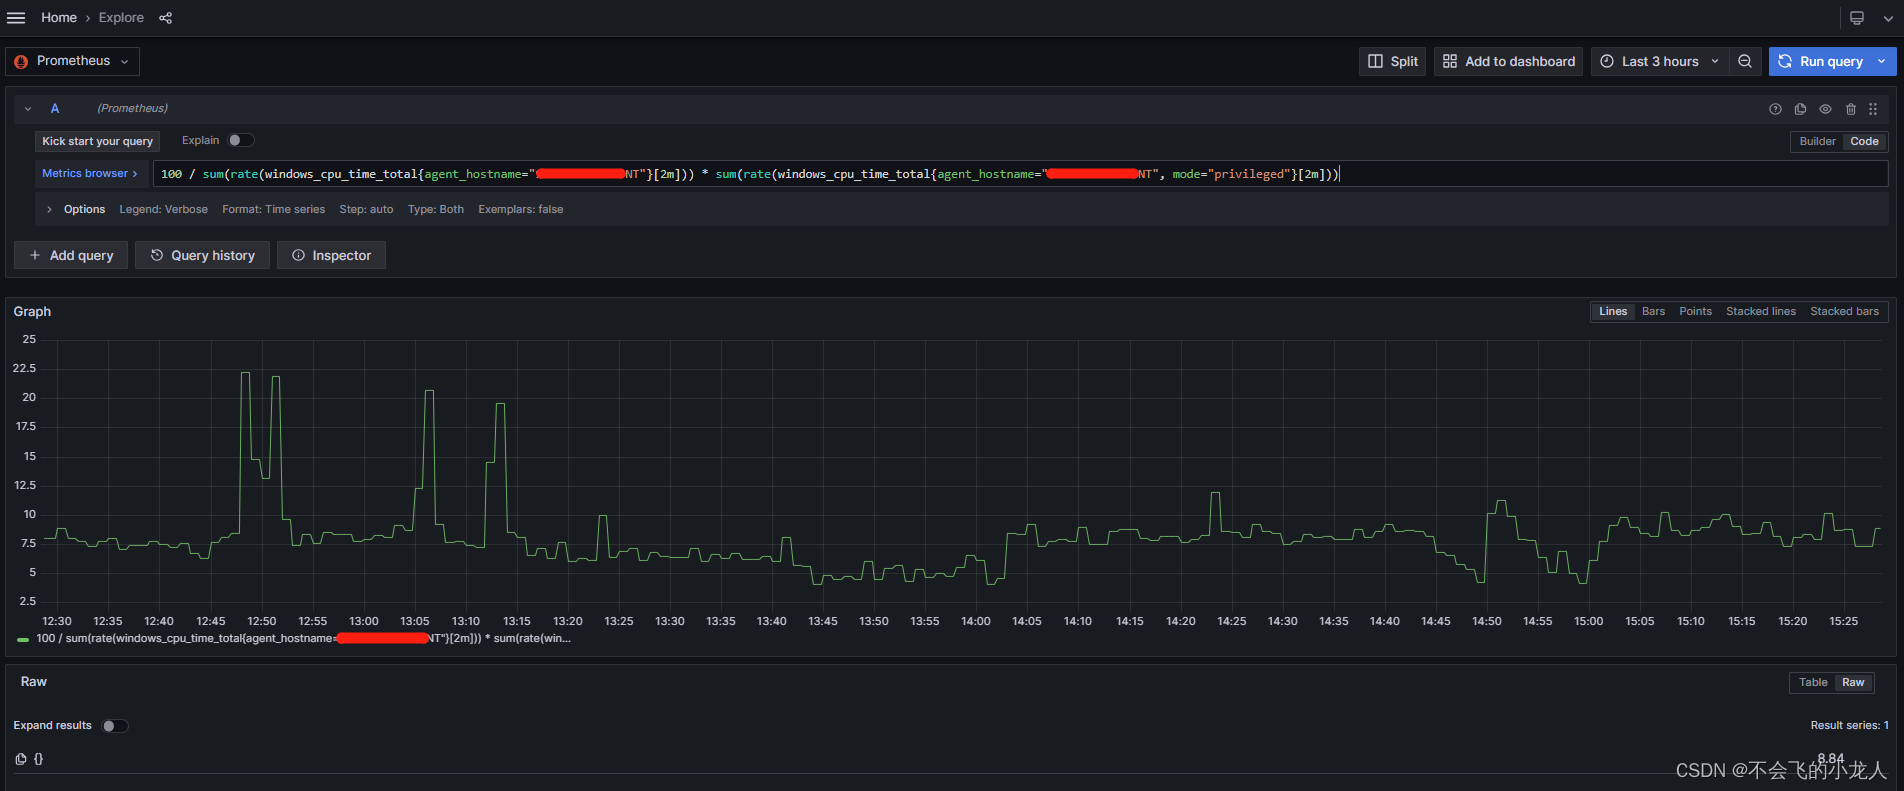
服务指标
查询监控节点的CPU使用率;
100 / sum(rate(windows_cpu_time_total{agent_hostname="xxx-windows"}[2m])) * sum(rate(windows_cpu_time_total{agent_hostname="xxx-windows", mode="privileged"}[2m]))在“Grafana》Explore》Prometheus”中,切换到Code模块下查询;
总结
本文描述的快速搭建日志链路监控平台的整个过程就结束了,通过本文能够快速了解到日志链路监控平台的作用和配置使用过程;增加程序开发人员和系统运维人员,对应用服务的请求过程和日志查询、性能监控等分析能力,也提升了线上故障快速排错与性能瓶颈定位能力;同时保障服务的可靠性、安全性,以及工具化管理服务,减少生产服务器环境上排查问题的操作风险;
参考或后续方案
SpringBoot+Prometheus采集Metrics指标数据
SpringBoot+Prometheus采集Metrics指标数据_prometheus采集数据_不会飞的小龙人的博客-CSDN博客
Loki 日志块使用 MinIO 对象存储
Loki 日志块使用 MinIO 对象存储_minio 日志_不会飞的小龙人的博客-CSDN博客
共享仪表盘
Dashboards | Grafana Labs
grafana官方文档
What's new in Grafana | Grafana documentation
Tempo官方文档
Tempo data source | Grafana documentation
tempo官方完整配置
https://github.com/grafana/intro-to-mltp/blob/main/tempo/tempo.yaml