文章目录
- 一、云耀云服务器介绍
- 二、安装Prometheus
- 创建prometheus.service配置文件
- 启动prometheus服务
- 查看prometheus服务进程
- 三、安装node_exporter
- 下载node_exporter组件包
- 创建node_exporter.service配置文件
- 启动node_exproter服务
- 配置prometheus.yml文件
- 访问Prometheus
- 四、安装Grafana
- 下载并安装Grafana
- 访问Grafana
- 五、参考链接
一、云耀云服务器介绍
- 云耀云服务器的优势

- 多种产品规格,满足广大开发者的需求

- 拥有丰富的应用场景,和简洁的部署方式

二、安装Prometheus
# 下载
[root@hcss-ecs-2d95 ~]# wget https://github.com/prometheus/prometheus/releases/download/v2.45.0/prometheus-2.45.0.linux-amd64.tar.gz

# 解压
[root@hcss-ecs-2d95 ~]# tar -zxvf prometheus-2.45.0.linux-amd64.tar.gz -C /usr/local/

# 更名
cd /usr/local/  &&  mv prometheus-2.45.0.linux-amd64 prometheus  &&  cd prometheus
prometheusservice_29">创建prometheus.service配置文件
[root@hcss-ecs-2d95 ~]# cat > /usr/lib/systemd/system/prometheus.service << EOF
[Unit]
Description=prometheus
After=network.target
[Service]
Type=simple
User=root
ExecStart=/usr/local/prometheus/prometheus --config.file=/usr/local/prometheus/prometheus.yml --storage.tsdb.path=/data/prometheus --storage.tsdb.retention=15d --log.level=info
Restart=on-failure
[Install]
WantedBy=multi-user.target
EOF
prometheus_46">启动prometheus服务
[root@hcss-ecs-2d95 ~]# systemctl daemon-reload && systemctl start prometheus && systemctl enable prometheus && systemctl status prometheus
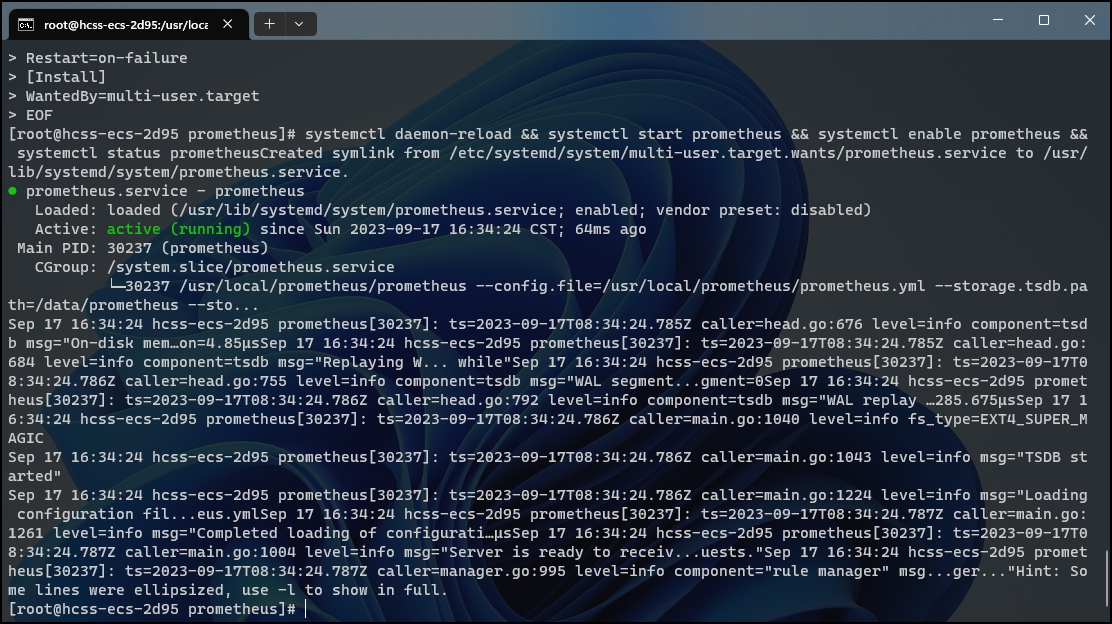
prometheus_54">查看prometheus服务进程
[root@hcss-ecs-2d95 ~]# netstat -lntp | grep prometheus
[root@hcss-ecs-2d95 prometheus]# netstat -lntp | grep prometheus
tcp6       0      0 :::9090                 :::*                    LISTEN      30237/prometheus
三、安装node_exporter
下载node_exporter组件包
# 下载
[root@hcss-ecs-2d95 ~]# wget https://github.com/prometheus/node_exporter/releases/download/v1.6.1/node_exporter-1.6.1.linux-amd64.tar.gz

# 解压
[root@hcss-ecs-2d95 ~]# tar -zxvf node_exporter-1.6.1.linux-amd64.tar.gz -C /usr/local/

# 更名
[root@hcss-ecs-2d95 ~]# cd /usr/local && mv node_exporter-1.6.1.linux-amd64 node_exporter && cd node_exporter
创建node_exporter.service配置文件
[root@hcss-ecs-2d95 ~]# cat > /usr/lib/systemd/system/node_exporter.service << EOF
[Unit]
Description=node_exporter
Documentation=https://prometheus.io/
After=network.target

[Service]
Type=simple
User=root
ExecStart=/usr/local/node_exporter/node_exporter
Restart=on-failure

[Install]
WantedBy=multi-user.target
EOF
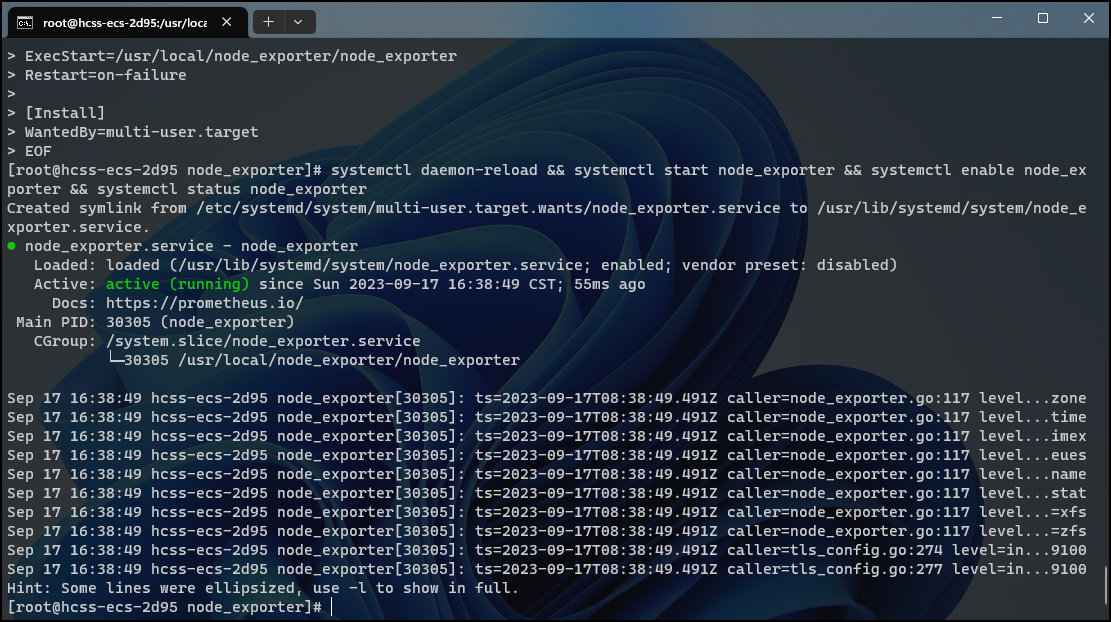
启动node_exproter服务
[root@hcss-ecs-2d95 ~]# systemctl daemon-reload && systemctl start node_exporter && systemctl enable node_exporter && systemctl status node_exporter
prometheusyml_112">配置prometheus.yml文件
- 修改Prometheus.yml
[root@hcss-ecs-2d95 ~]# cat prometheus.yml
# my global config
global:
  scrape_interval:     15s # Set the scrape interval to every 15 seconds. Default is every 1 minute.
  evaluation_interval: 15s # Evaluate rules every 15 seconds. The default is every 1 minute.
  # scrape_timeout is set to the global default (10s).

# Alertmanager configuration
alerting:
  alertmanagers:
  - static_configs:
    - targets:
       - 127.0.0.1:9093
      # - alertmanager:9093

# Load rules once and periodically evaluate them according to the global 'evaluation_interval'.
rule_files:
  - "rules/*.yml"
# - "first_rules.yml"
# - "second_rules.yml"

# A scrape configuration containing exactly one endpoint to scrape:
# Here it's Prometheus itself.
scrape_configs:
# The job name is added as a label `job=<job_name>` to any timeseries scraped from this config.
  - job_name: 'prometheus'

    # metrics_path defaults to '/metrics'
    # scheme defaults to 'http'.

    static_configs:
    - targets: ['localhost:9090']  # 如果对本机node_exporter监控,加入,'localhost:9100'

  - job_name: '云耀云服务器监控'
  #重写了全局抓取间隔时间,由15秒重写成5秒。
    scrape_interval: 5s
    static_configs:
    - targets: ['121.37.153.196:9100']
- 检验prometheus.yml配置是否有效
./promtool check config prometheus.yml
输出内容如下:
[root@hcss-ecs-2d95 prometheus]# ./promtool check config prometheus.yml
Checking prometheus.yml
 SUCCESS: prometheus.yml is valid prometheus config file syntax
- 重启prometheus服务
systemctl daemon-reload && systemctl restart prometheus && systemctl status prometheus
- 重启node_exporter服务
systemctl daemon-reload && systemctl restart prometheus && systemctl status prometheus
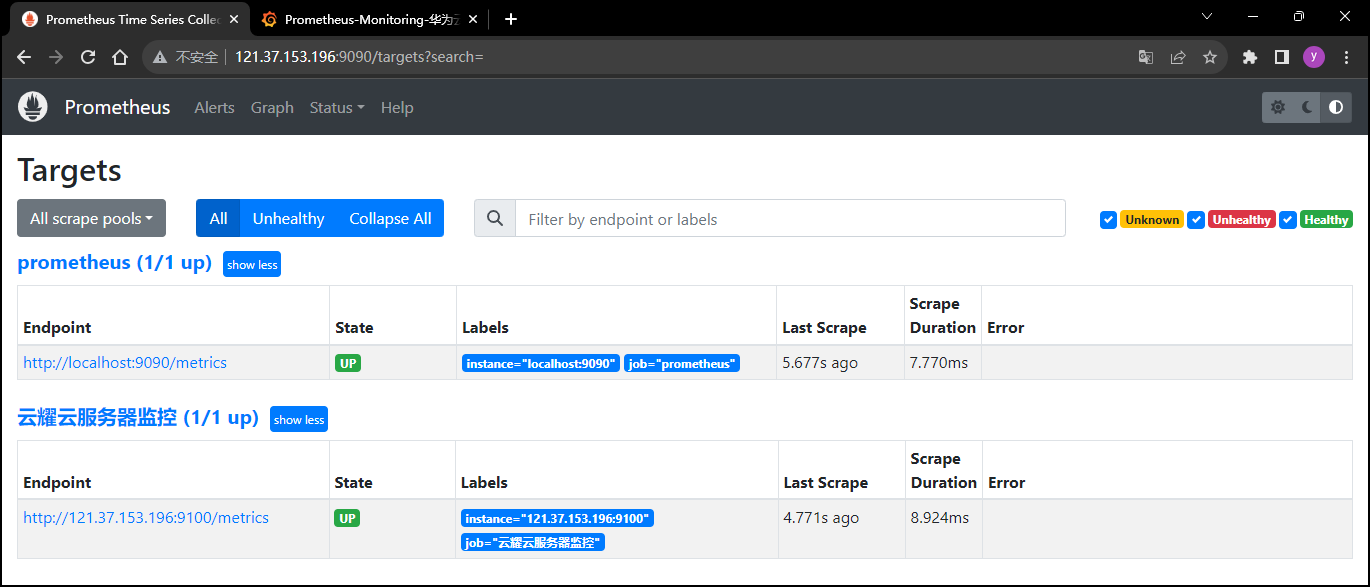
访问Prometheus
- http://IP地址:9090/targets
注意:访问相应的服务时,需要找到对应的云主机,在安全组内开启相应的端口,允许放行。
四、安装Grafana
下载并安装Grafana
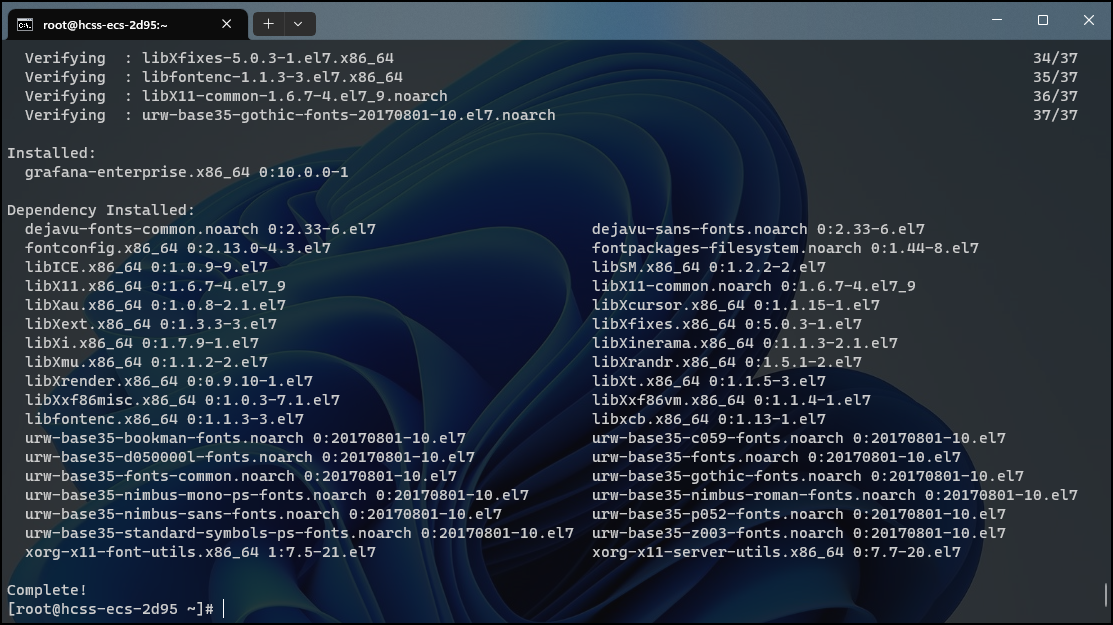
# 下载
wget https://dl.grafana.com/enterprise/release/grafana-enterprise-10.0.0-1.x86_64.rpm

# 安装
yum install -y grafana-enterprise-10.0.0-1.x86_64.rpm
- 启动grafana服务
systemctl start grafana-server.service && systemctl enable grafana-server.service && systemctl status grafana-server.service
- 查看grafana进程
netstat -lntp | grep grafana
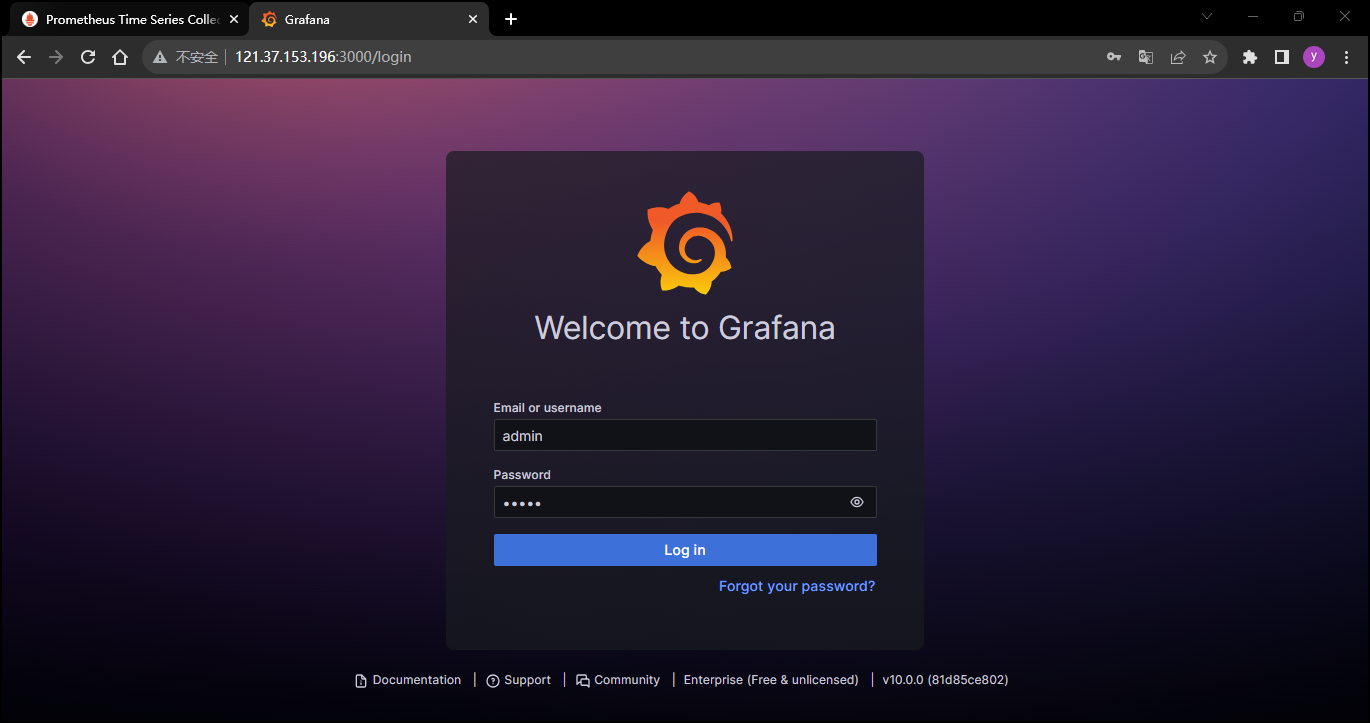
访问Grafana
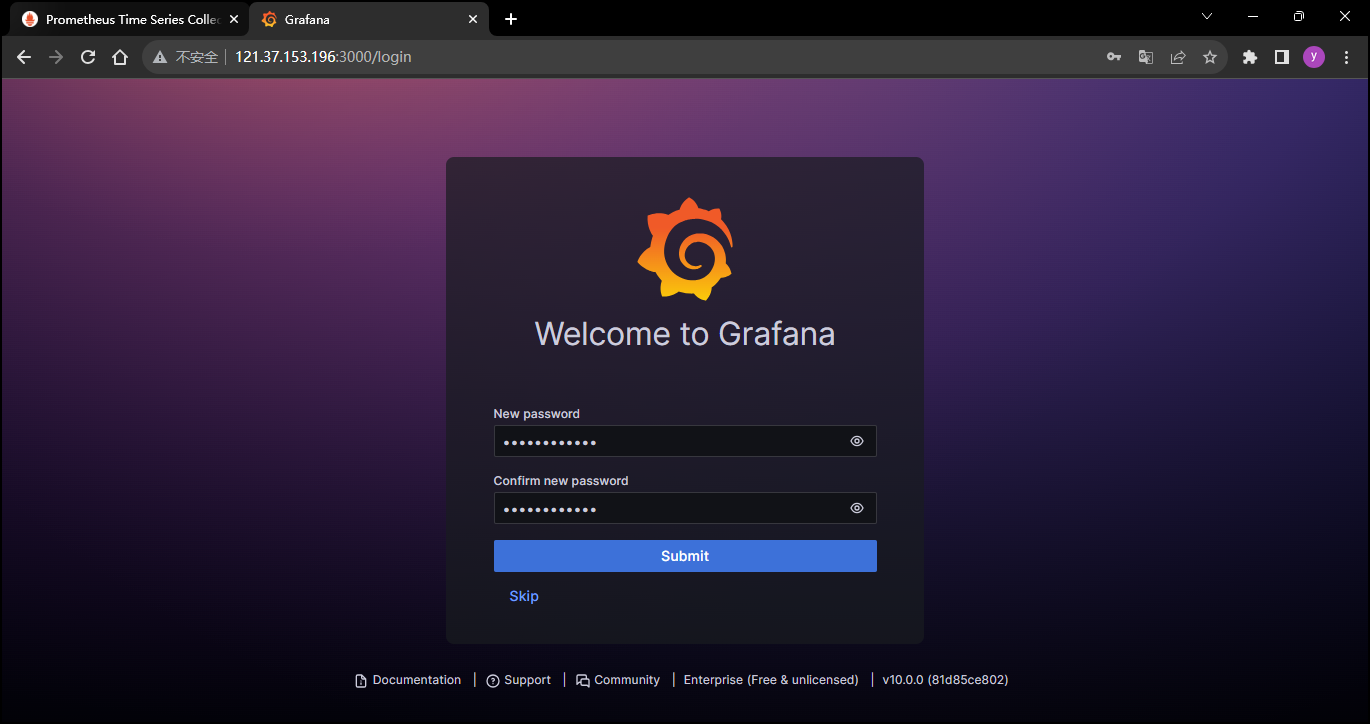
- 访问Grafana网页,即访问http://BastionIP地址:3000。注意:需要开启对应云主机安全组内的端口,允许放行此端口,才可以访问。
- 输入用户名和密码(初始密码:admin)
- 修改新密码
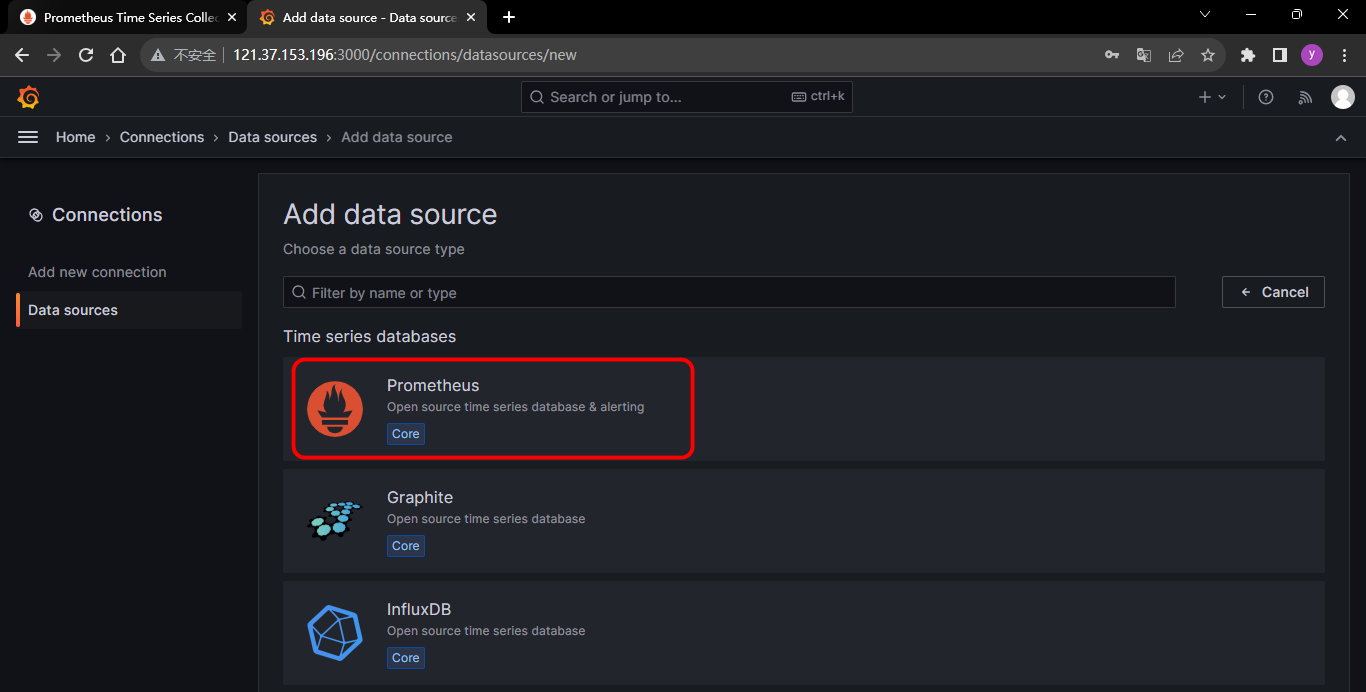
- 添加数据源Prometheus
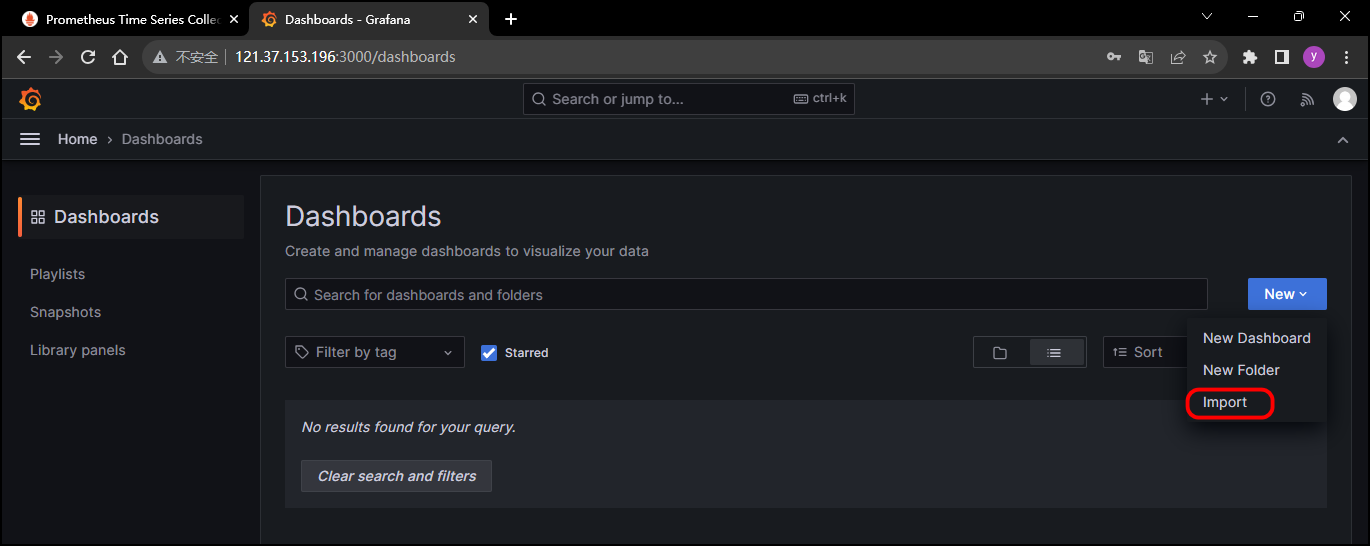
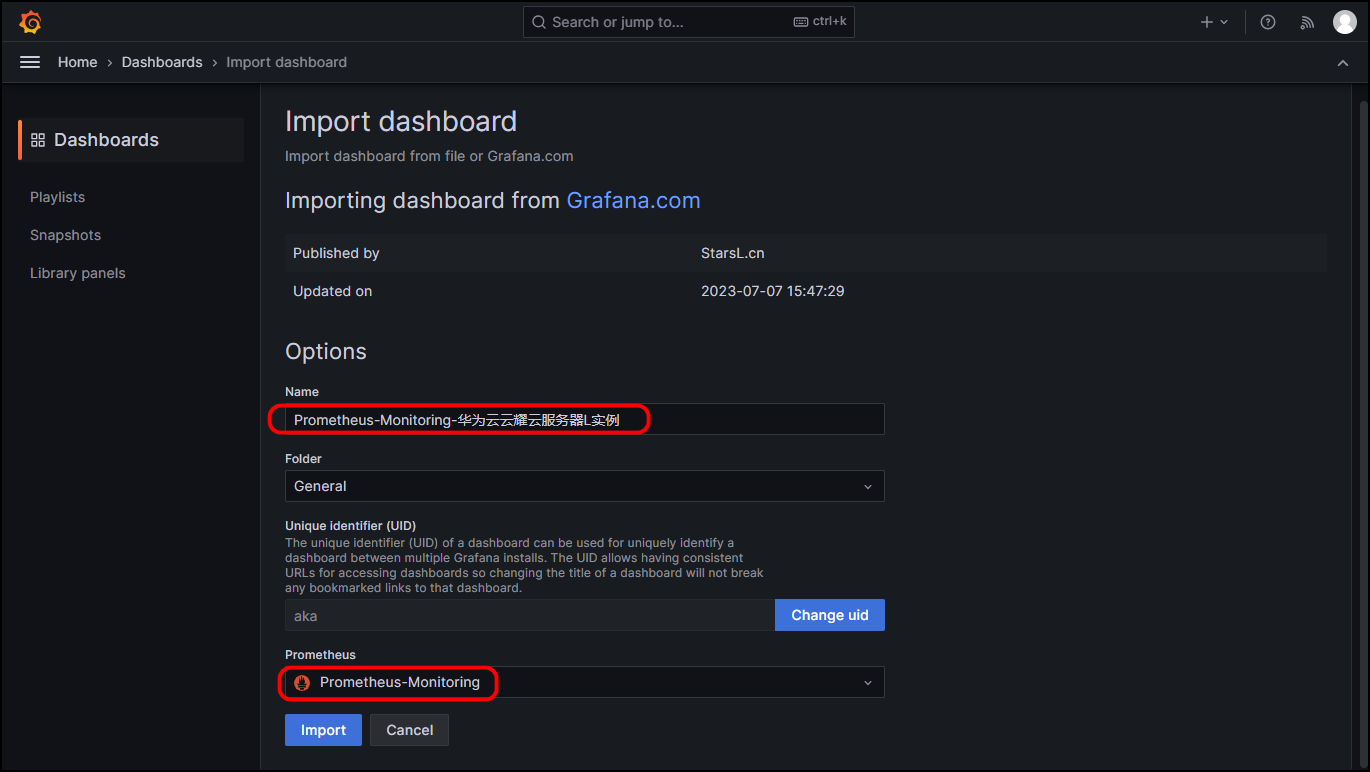
- 导入仪表盘
- 输入仪表盘编号
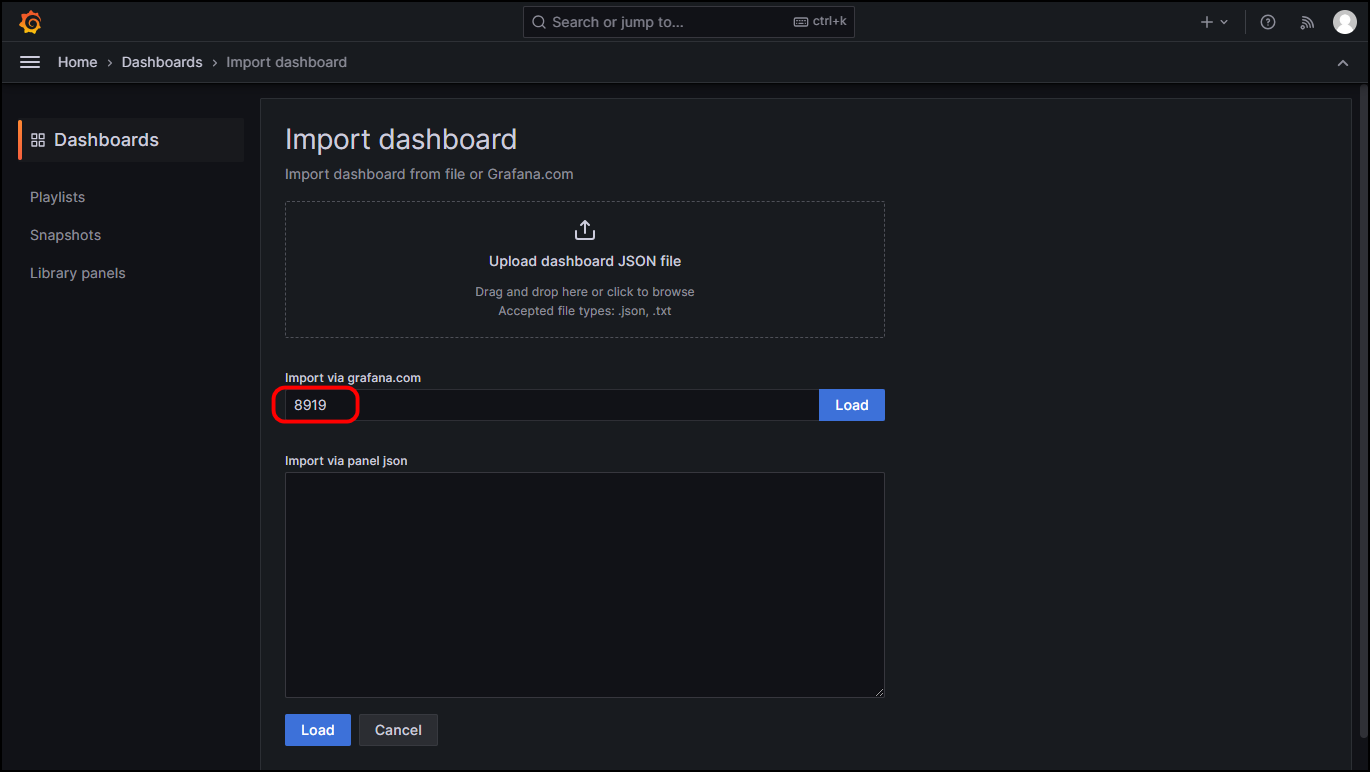
- 选择数据源,点击
import
- Grafana可视化数据展示完成。
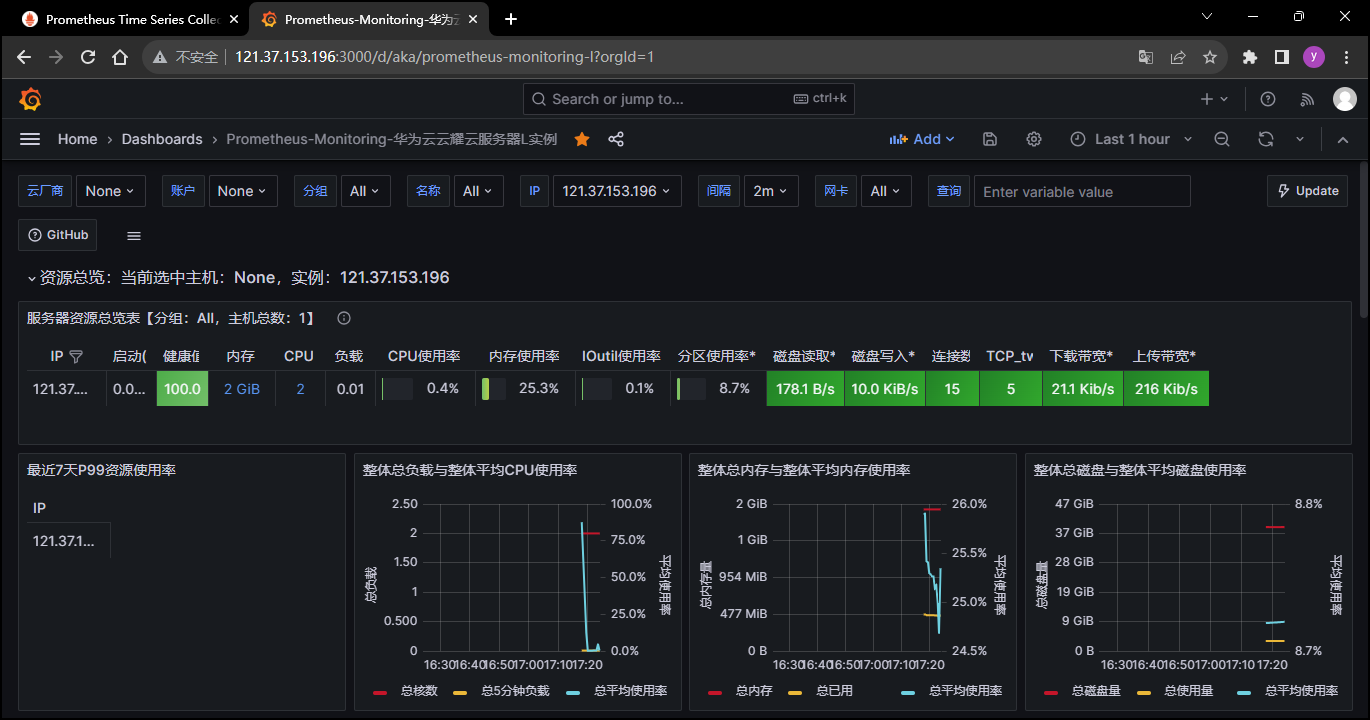
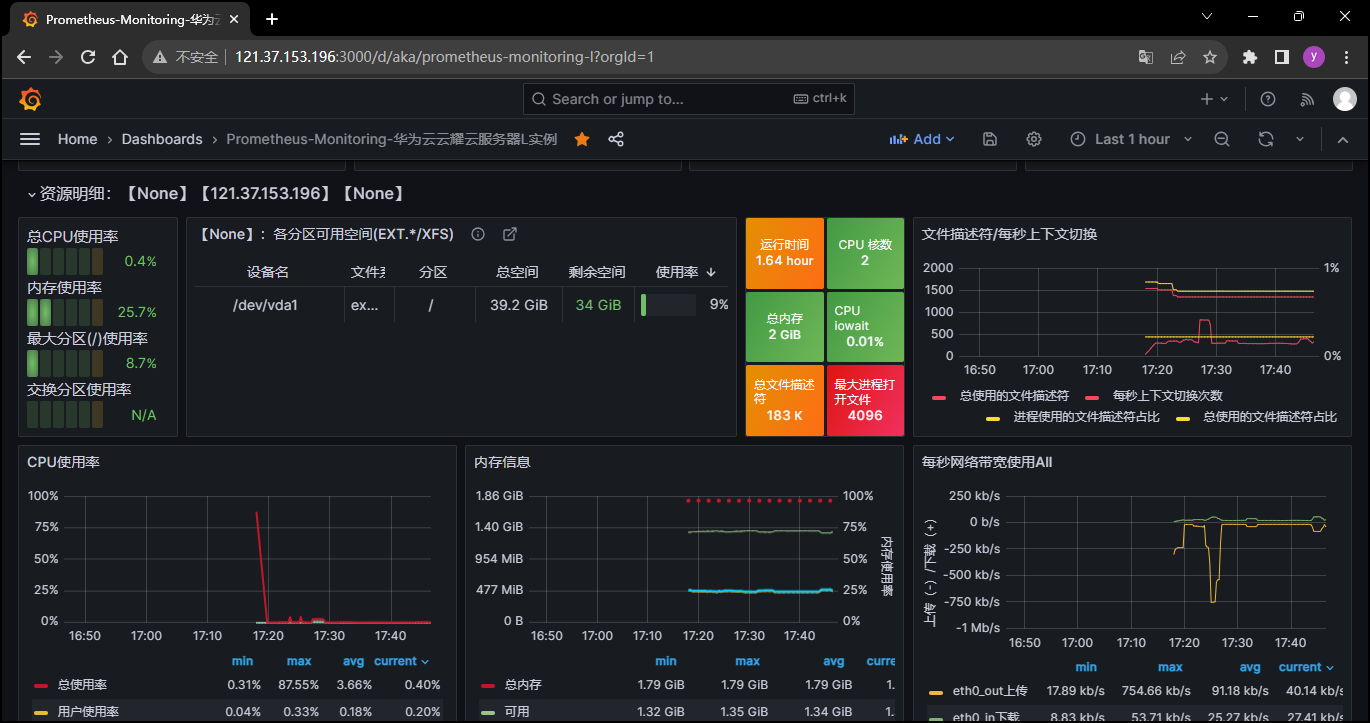
本实验基于华为云云耀云服务器,采用Prometheus+Grafana的安装部署方式实现对Linux系统主机的统一监控,Prometheus自带有监控功能,但不能简洁直观的反映出被监控端的详细信息。这时,采用grafana中提供的丰富的Dashboard页面,简洁直观的显示系统的各个参数的详细情况,给人焕然一新的感觉,便于维护管理。
五、参考链接
🔴https://grafana.com/
🟡https://github.com/prometheus/node_exporter/releases
🟢https://prometheus.io/
🔵https://www.huaweicloud.com/product/hecs-light.html