环境:
OS:Centos7
Docker: 20.10.9 - Community
Centos部署Docker
【Kubernetes】Centos中安装Docker和Minikube_云服务器安装docker和minikube_DivingKitten的博客-CSDN博客
一、拉取Prometheus镜像
## 拉取镜像
docker pull prom/prometheus
## 启动promtheus
docker run --name prometheus -p 9090:9090 -d prom/prometheus

## copy 配置文件至本地
docker cp prometheus:/etc/prometheus/prometheus.yml ./
用浏览器访问Prometheus前端:http://192.168.56.110:9090
二、部署node_exporter
1、安装服务
从github下载发行版,通过systemd进行管理。
github:node_exporter
## 从github下载发行版
wget https://github.com/prometheus/node_exporter/releases/download/v1.6.1/node_exporter-1.6.1.linux-amd64.tar.gz

## 解压文件
tar -xf node_exporter-1.6.1.linux-amd64.tar.gz

## 创建软链接方便以后升级
ln -s ./node_exporter-1.6.1.linux-amd64 ./node_exporter
创建service文件,保存在/usr/lib/systemd/system/目录下
[Unit]
Description=Prometheus Node Exporter
After=network.target

[Service]
Type=simple
User=root
Group=root
ExecStart=/root/docker/prometheus/node_exporter/node_exporter
Restart=on-failure

[Install]
WantedBy=multi-user.target
1、ExecStart表示执行文件位置,根据实际情况具体修改
2、node_exporter默认监控端口是9100,如需修改端口,可以追加启动参数:
–web.listen-address=:8100
启动node_exporter服务,并设置为开机器自动启动
systemctl daemon-reload
systemctl start node-exporter
systemctl enable node-exporter

## 检查端口
$ netstat -nltp | grep 9100
tcp6       0      0 :::9100                 :::*                    LISTEN      23431/node_exporter
## 检查监控可用性
$ curl http://127.0.0.1:9100/metrics
# HELP go_gc_duration_seconds A summary of the pause duration of garbage collection cycles.
# TYPE go_gc_duration_seconds summary
go_gc_duration_seconds{quantile="0"} 3.0135e-05
go_gc_duration_seconds{quantile="0.25"} 3.6243e-05
go_gc_duration_seconds{quantile="0.5"} 3.9298e-05
go_gc_duration_seconds{quantile="0.75"} 4.4272e-05
go_gc_duration_seconds{quantile="1"} 0.000111722
go_gc_duration_seconds_sum 0.080724852
go_gc_duration_seconds_count 1900
# HELP go_goroutines Number of goroutines that currently exist.
# TYPE go_goroutines gauge
go_goroutines 7
# HELP go_info Information about the Go environment.
# TYPE go_info gauge
go_info{version="go1.19.1"} 1
.....
....
2、配置target
在Prometheus配置scrape_configs中追加target
scrape_configs:
  - job_name: "node_exporter"
    static_configs:
      - targets: ["192.168.56.110:9100"]
由于Prometheus运行在容器中,所以不能通过127.0.0.1找到宿主机上的node_exporter,可以通过宿主机的网卡IP进行访问
然后将配置拷贝到容器中,重启Prometheus或者调用接口重载配置
## 覆盖配置
docker cp ./prometheus.yml prometheus:/etc/prometheus/prometheus.yml
## 重启Prometheus
docker restart prometheus
三、部署Blackbox_exporer
1、安装服务
流程和node_exporter部署相同,从github下载发行版,通过systemd进行管理。
github:blackbox_exporter
## 从github下载发行版
wget https://github.com/prometheus/blackbox_exporter/releases/download/v0.23.0/blackbox_exporter-0.23.0.linux-amd64.tar.gz

## 解压文件
tar -xf blackbox_exporter-0.23.0.linux-amd64

## 创建软链接方便以后升级
ln -s ./blackbox_exporter-0.23.0.linux-amd64 ./blackbox_exporter
创建service文件,保存在/usr/lib/systemd/system/目录下
[Unit]
Description=Prometheus blackbox Exporter
After=network.target

[Service]
Type=simple
User=root
Group=root
ExecStart=/root/docker/prometheus/blackbox_exporter/blackbox_exporter --config.file=/root/docker/prometheus/blackbox_exporter/blackbox.yml
Restart=on-failure

[Install]
WantedBy=multi-user.target
1、ExecStart表示执行文件位置,根据实际文件位置修改
2、–config.file根据实际blackbox_exporter配置配置修改
2、node_exporter默认监控端口是9115,如需修改端口,可以追加启动参数:
–web.listen-address=:9195
启动blackbox_exporter服务,并设置为开机器自动启动
systemctl daemon-reload
systemctl start node-exporter
systemctl enable node-exporter

## 检查端口
[root@VM-8-11-centos system]# netstat -nltp | grep 9115
tcp6       0      0 :::9115                 :::*                    LISTEN      10150/blackbox_expo
2、配置target
在Prometheus配置scrape_configs中追加target
scrape_configs:
  - job_name: "blackbox_exporter"
    metrics_path: /probe
    static_configs:
      - targets: ["192.168.56.110:9195"]
    relabel_configs:
      - source_labels: [__address__]
        target_label: __param_target
      - source_labels: [__param_target]
        target_label: instance
由于Prometheus运行在容器中,所以不能通过127.0.0.1找到宿主机上的node_exporter,可以通过宿主机的网卡IP进行访问
然后重启Prometheus或者调用接口重载配置
## 覆盖配置
docker cp ./prometheus.yml prometheus:/etc/prometheus/prometheus.yml
## 重启Prometheus
docker restart prometheus
四、部署Grafana
1、安装服务
拉取镜像并启动
docker pull grafana/grafana-oss

docker run -d -p 3000:3000 --name grafana grafana/grafana-oss
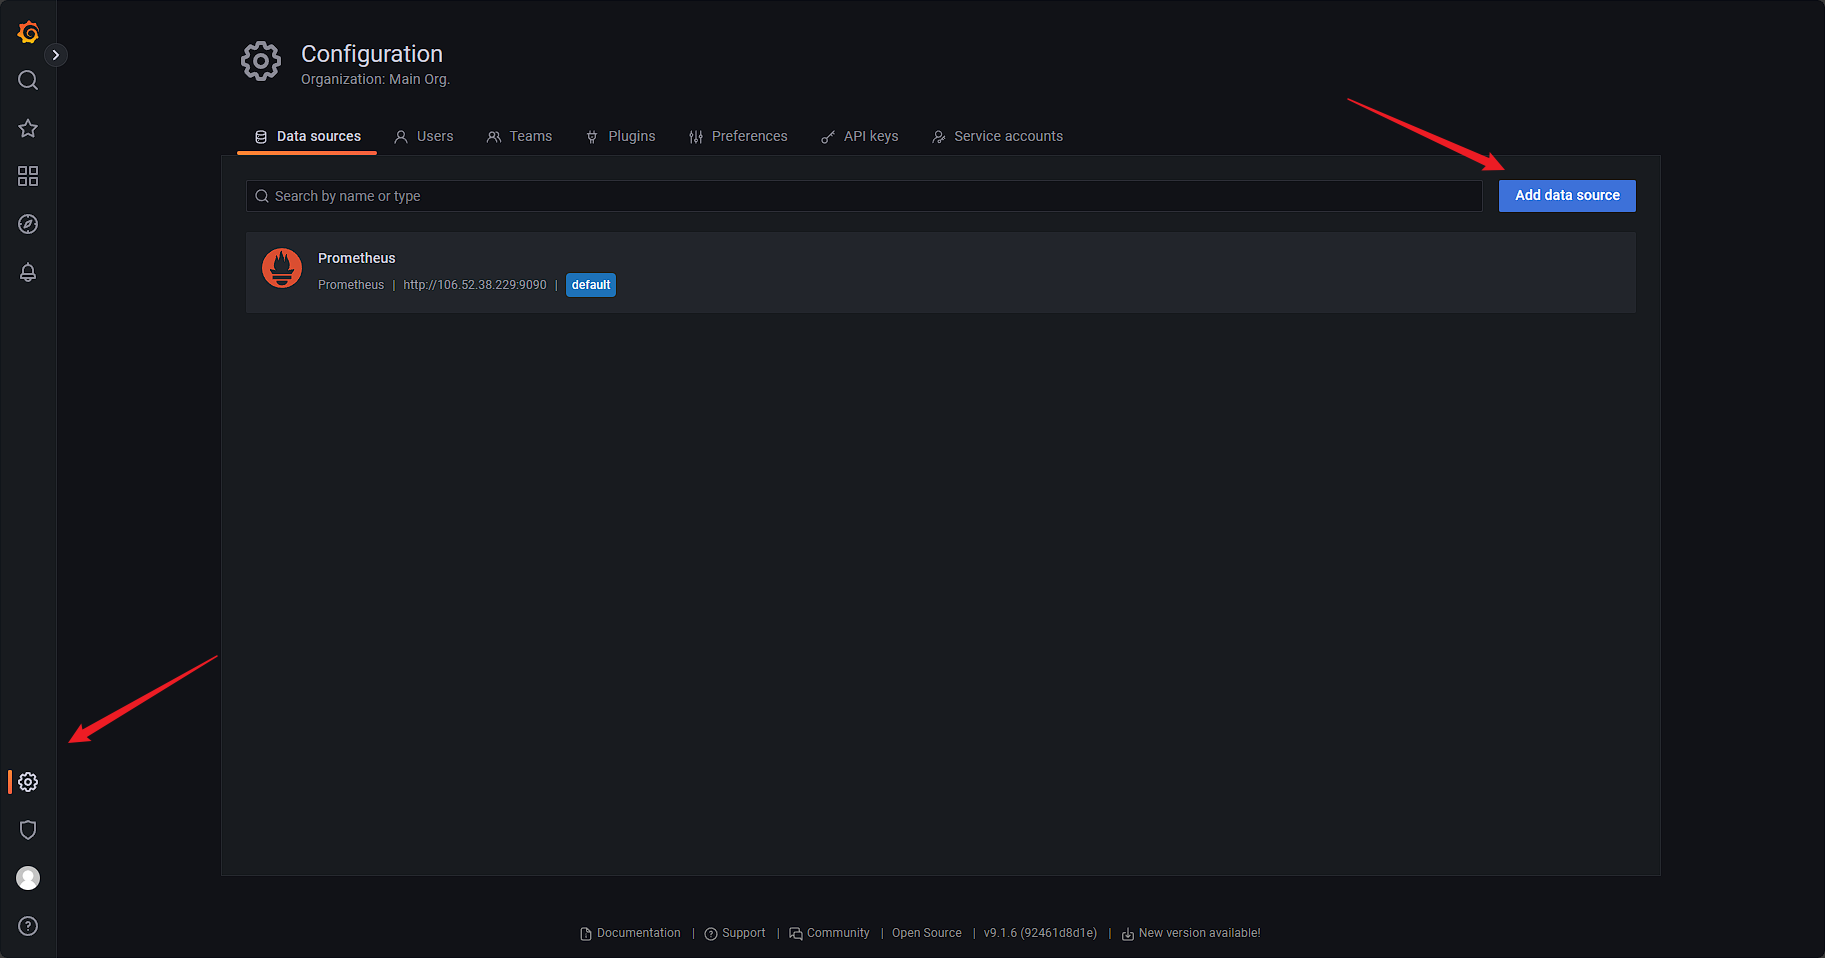
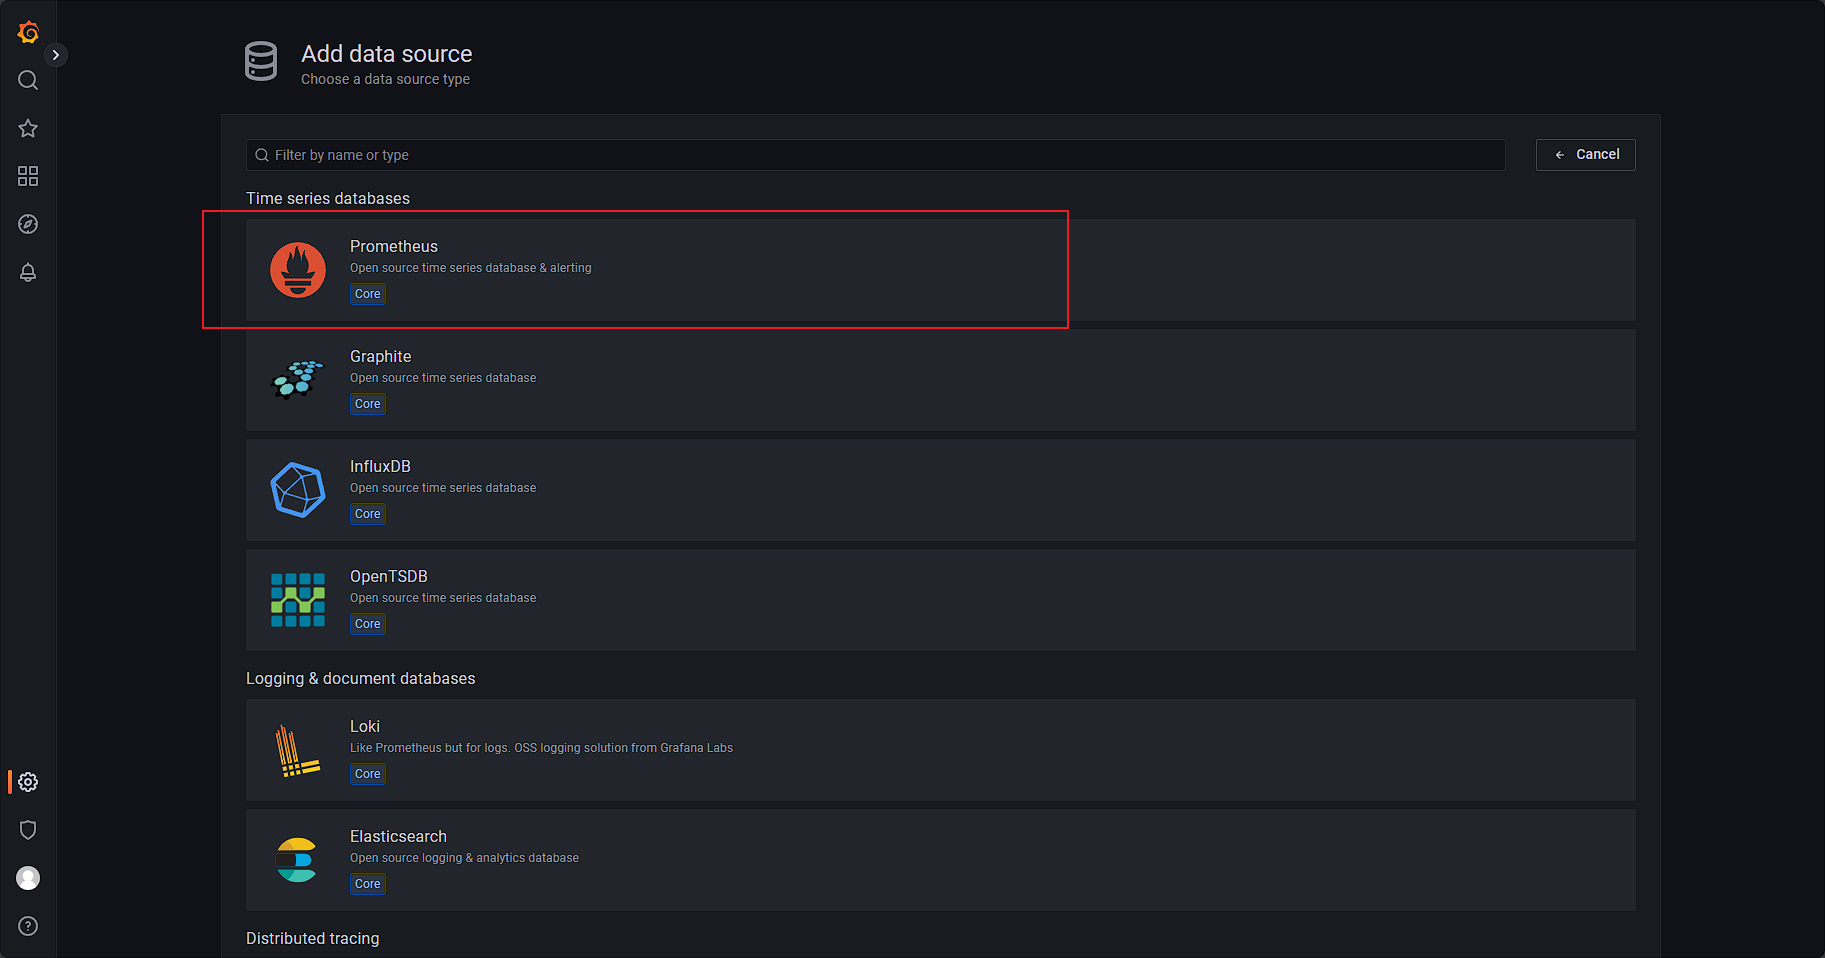
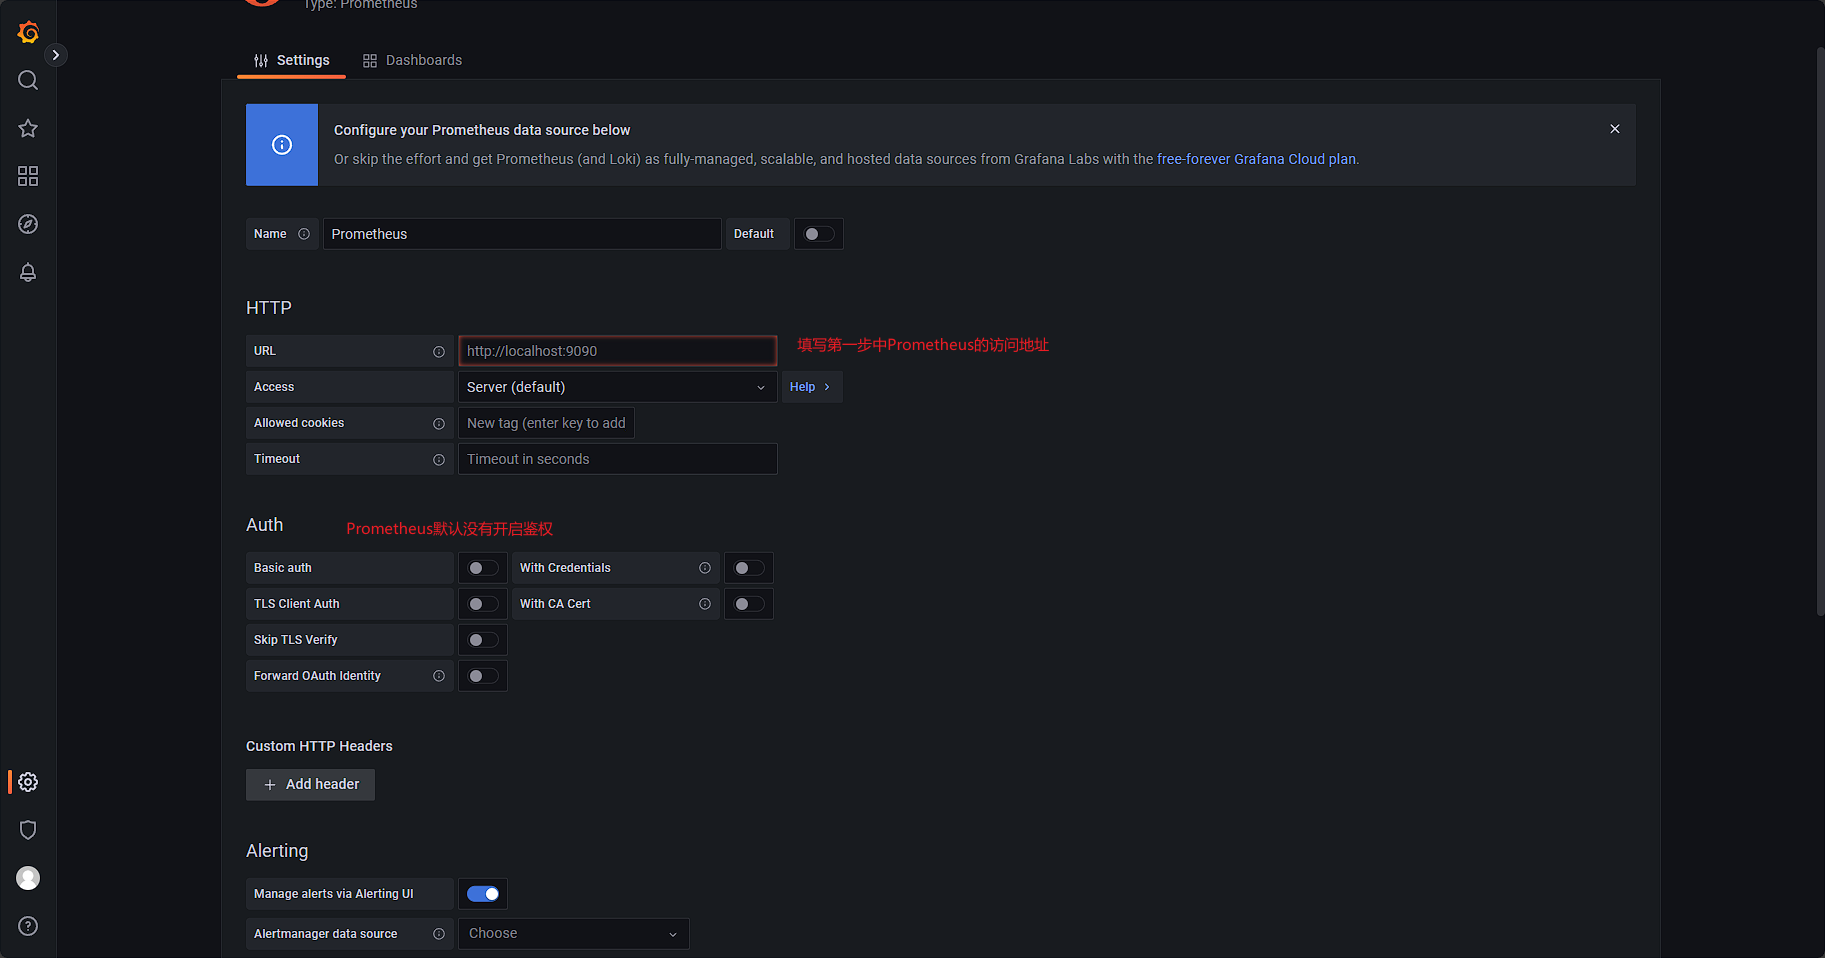
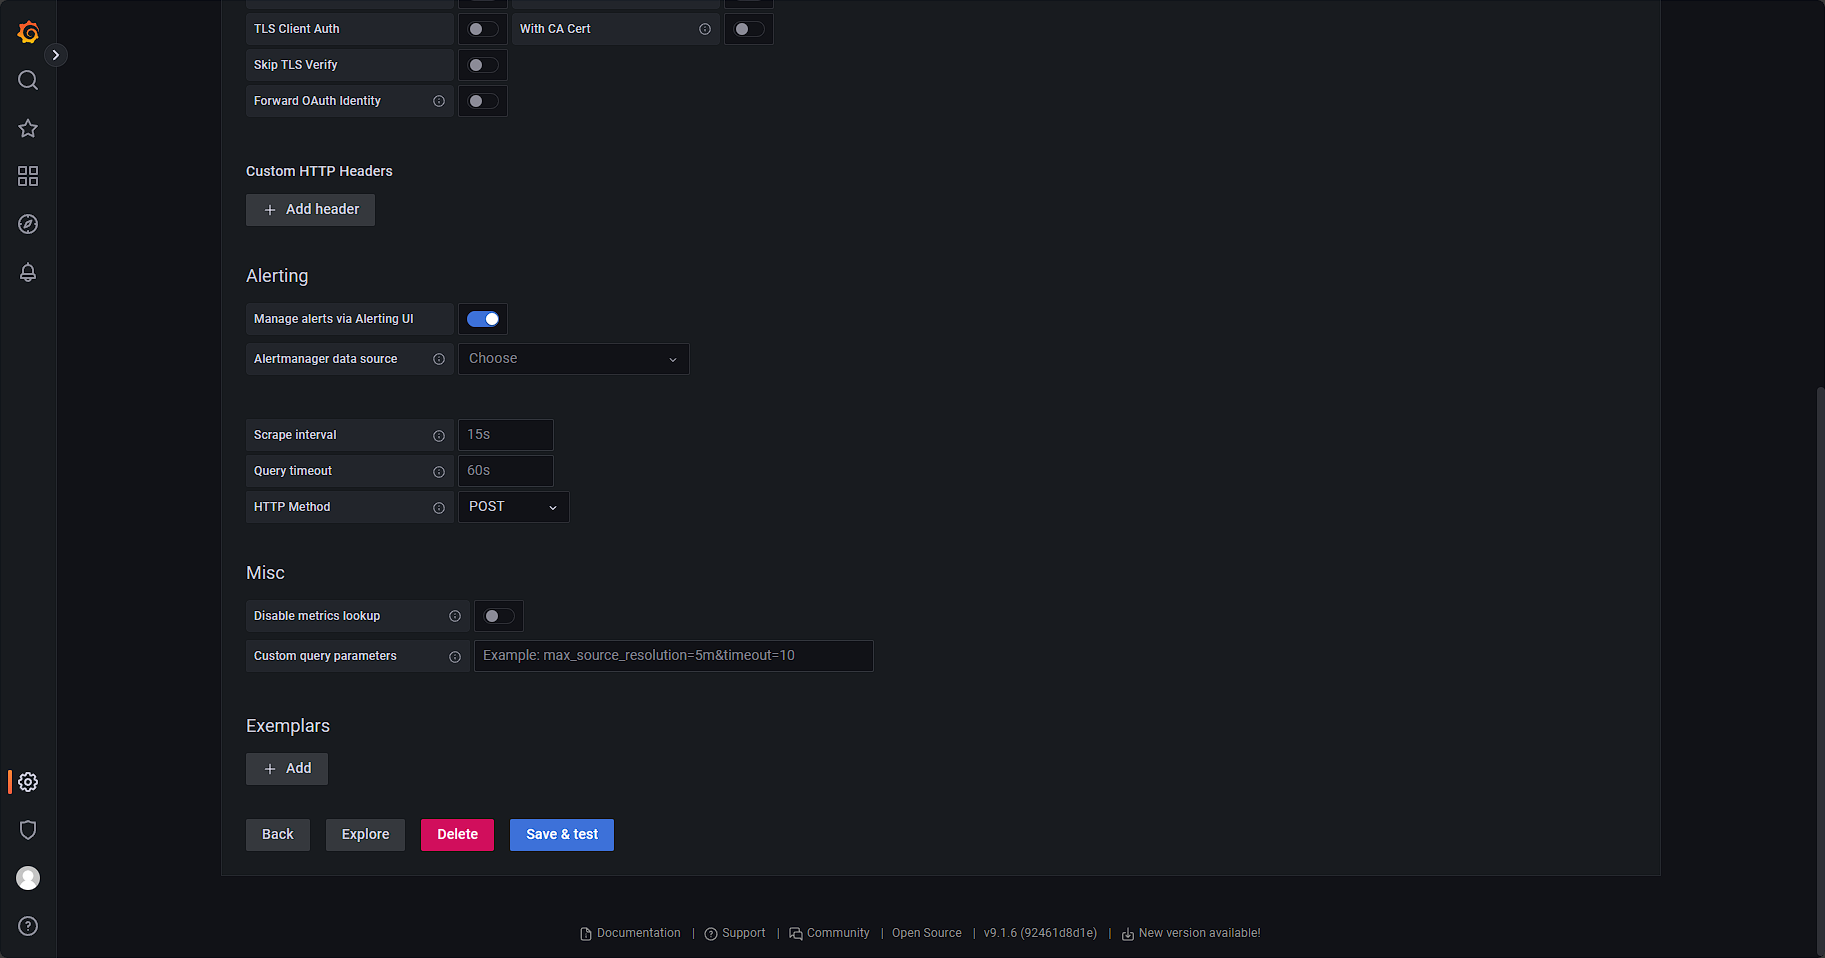
初次登录没有密码,然后设置数据源来自Prometheus,测试通过才会正式保存。
2、添加视图
在grafana的dashboard市场里有很多现成的视图,可以直接导入,node_exporter和blackbox_exporter都有现成的视图
官方dashboard市场:
Dashboards | Grafana Labs
Node_exporter视图:
Node Exporter Full | Grafana Labs
Blackbox_exporter视图:
Prometheus Blackbox Exporter | Grafana Labs
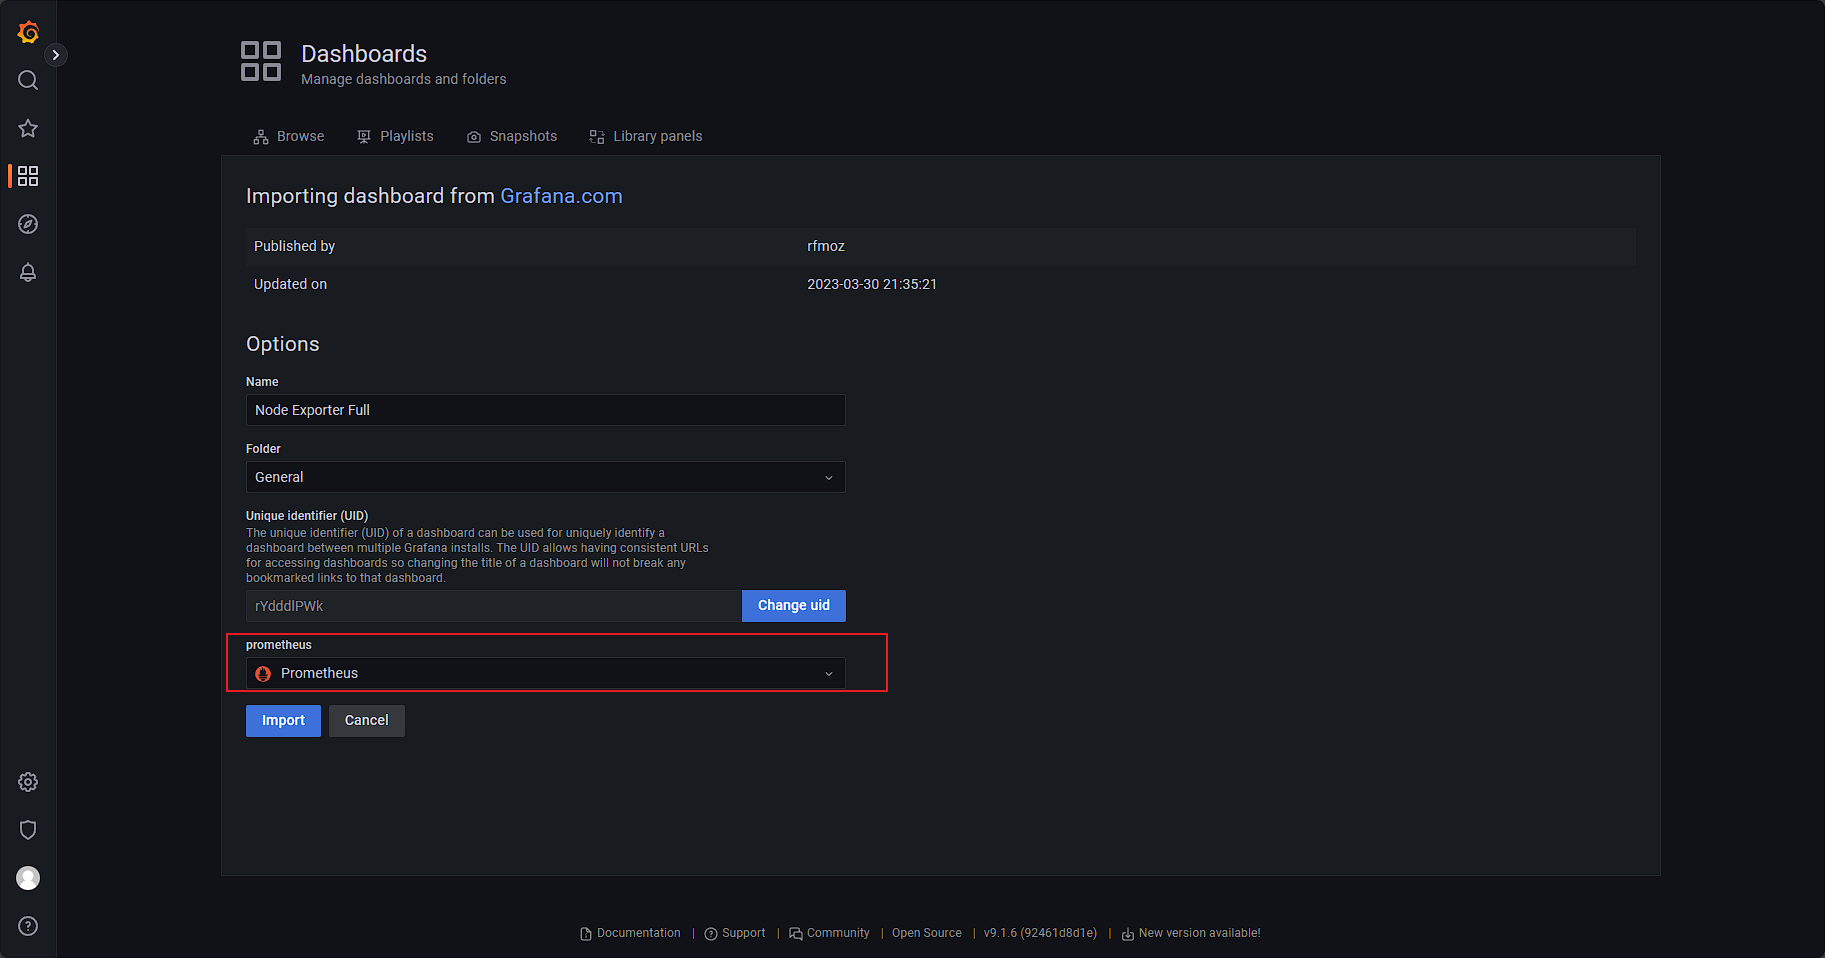
导航到Dashboard–> import ,填入从官网copy的ID,本地的grfana会自动到官网下载对应dashboard的json信息
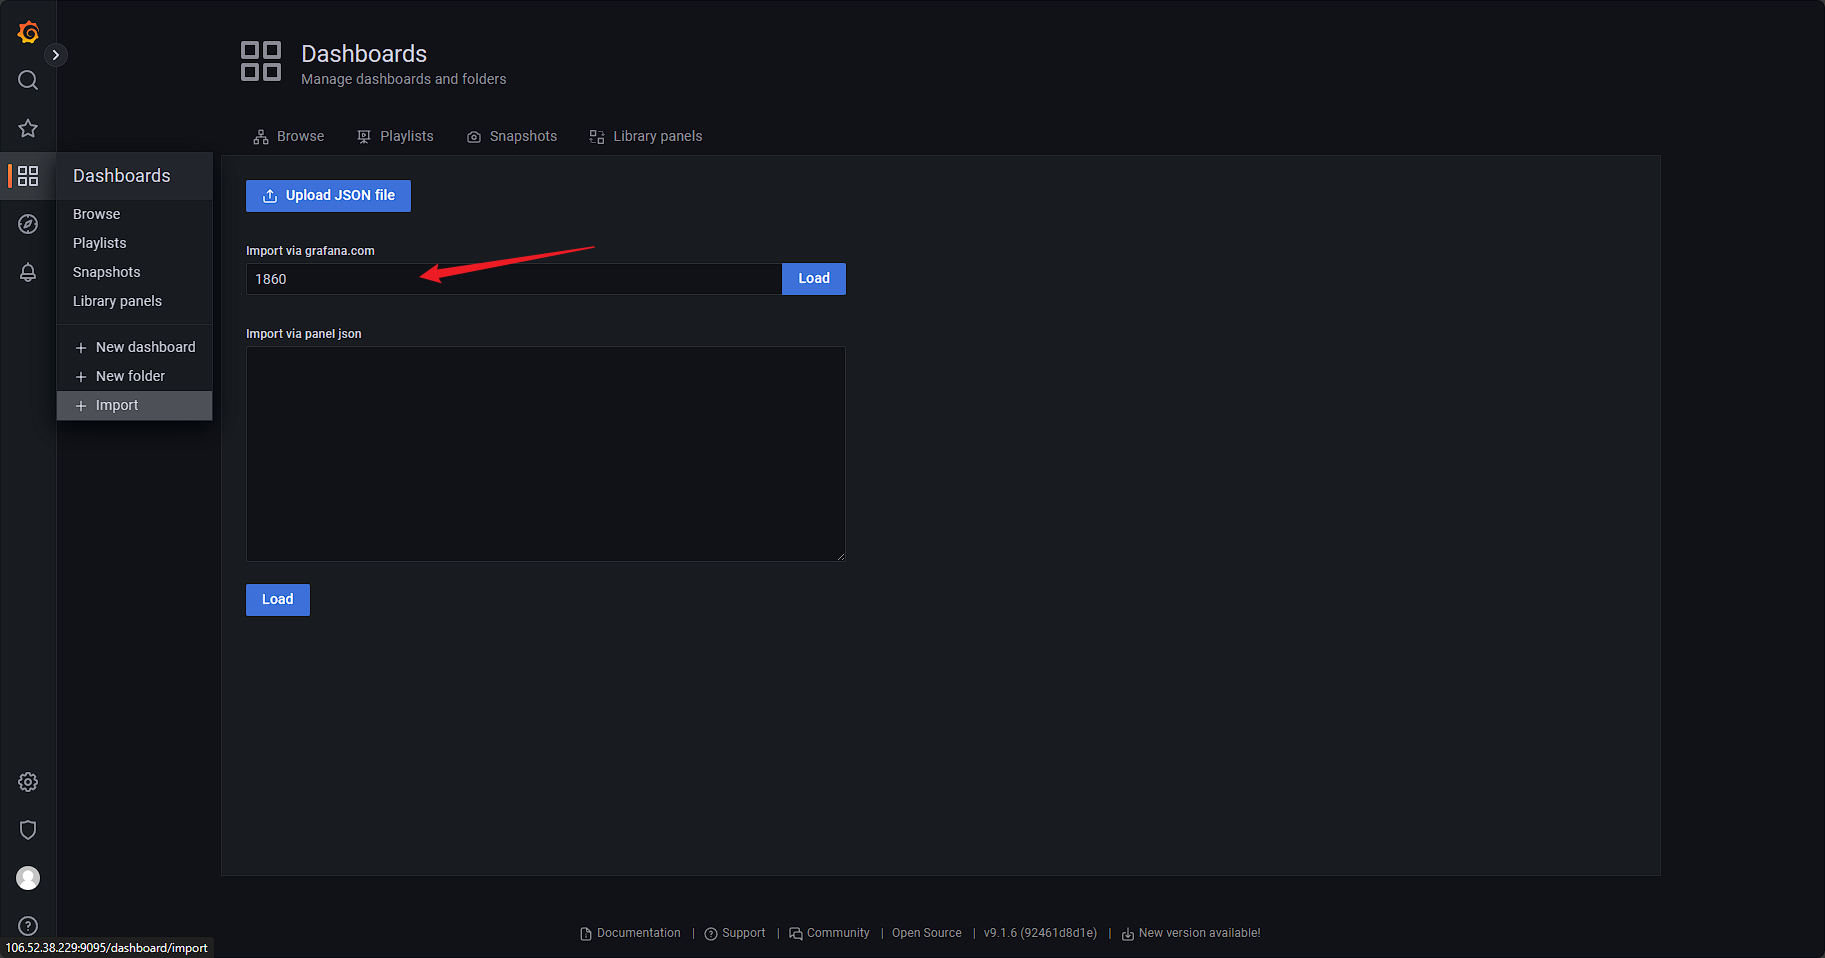
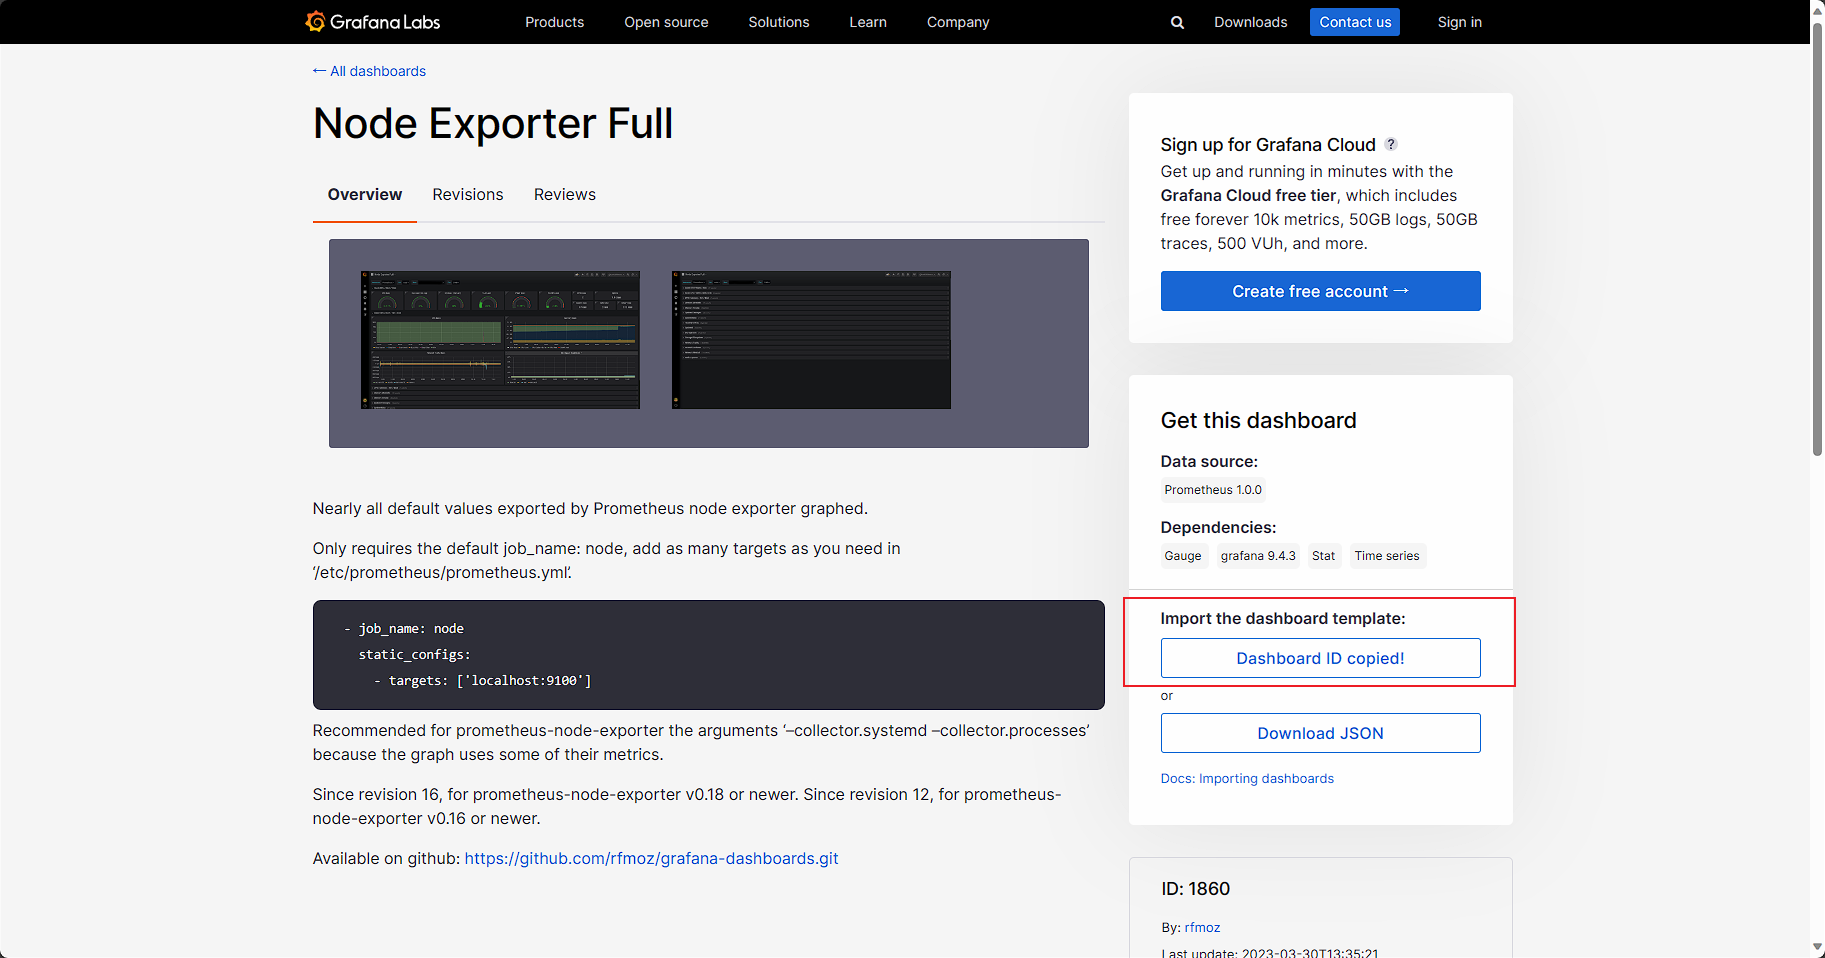
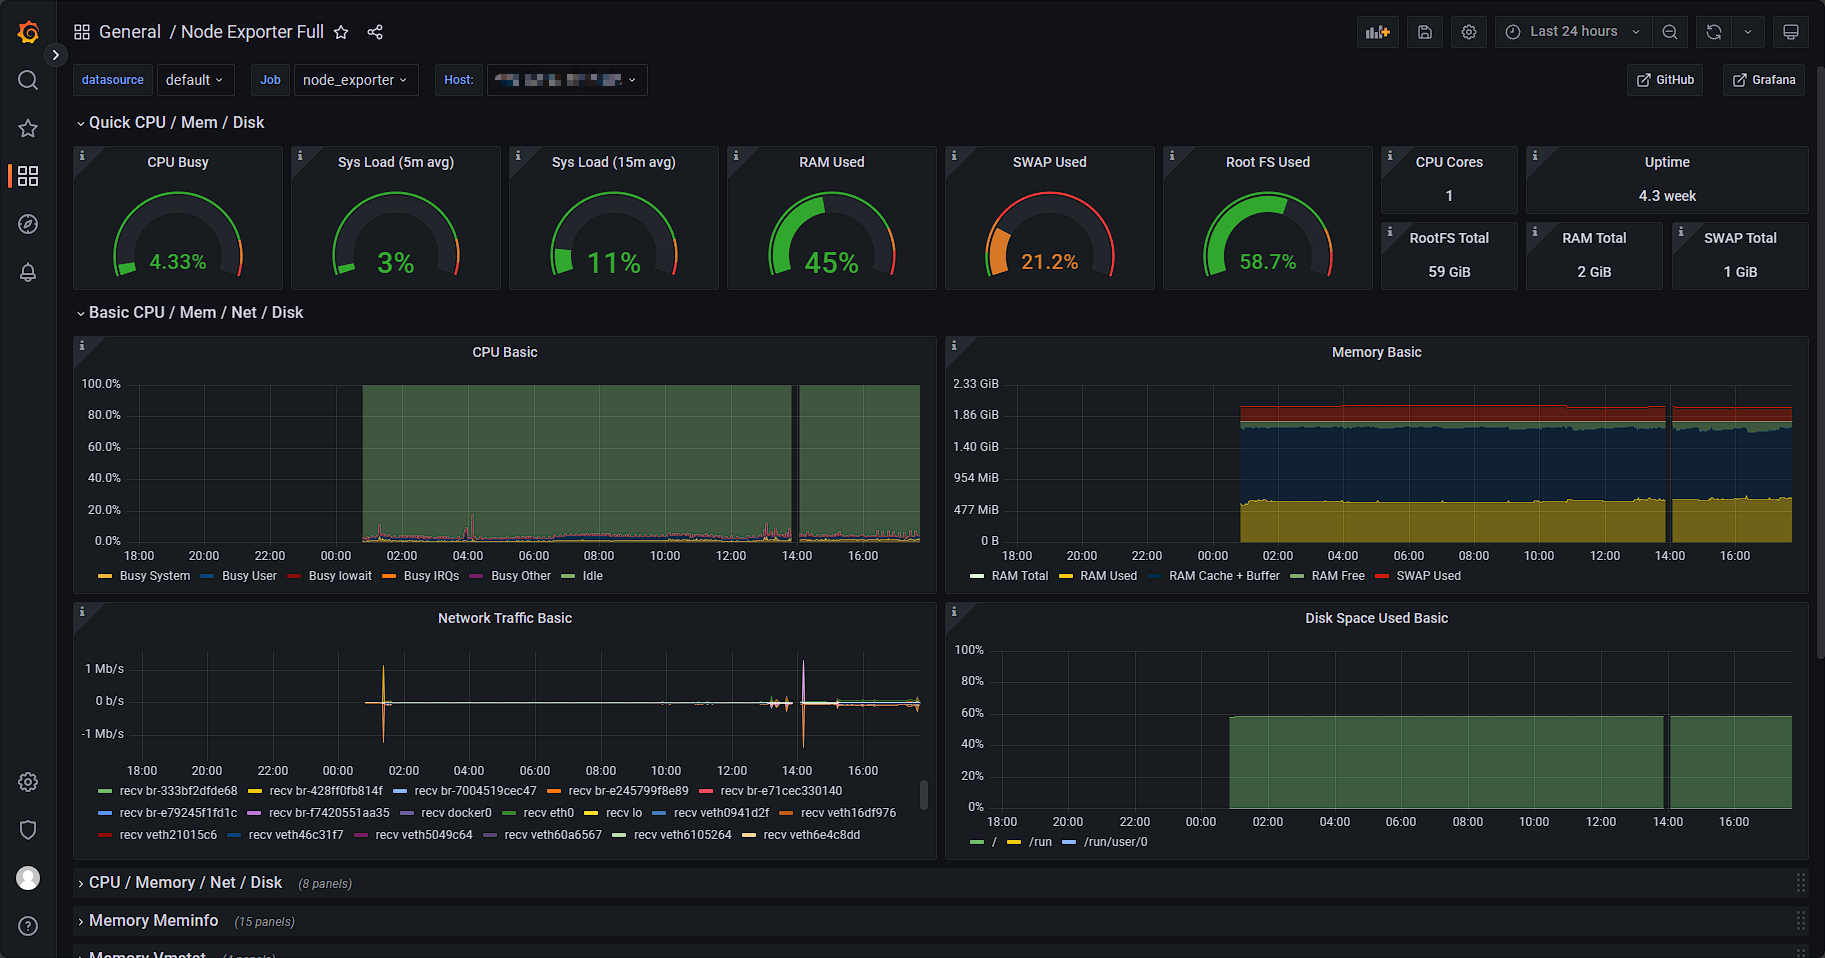
选择好默认的数据源,点击import等待一会儿,就会自动跳转到对应的监控视图上
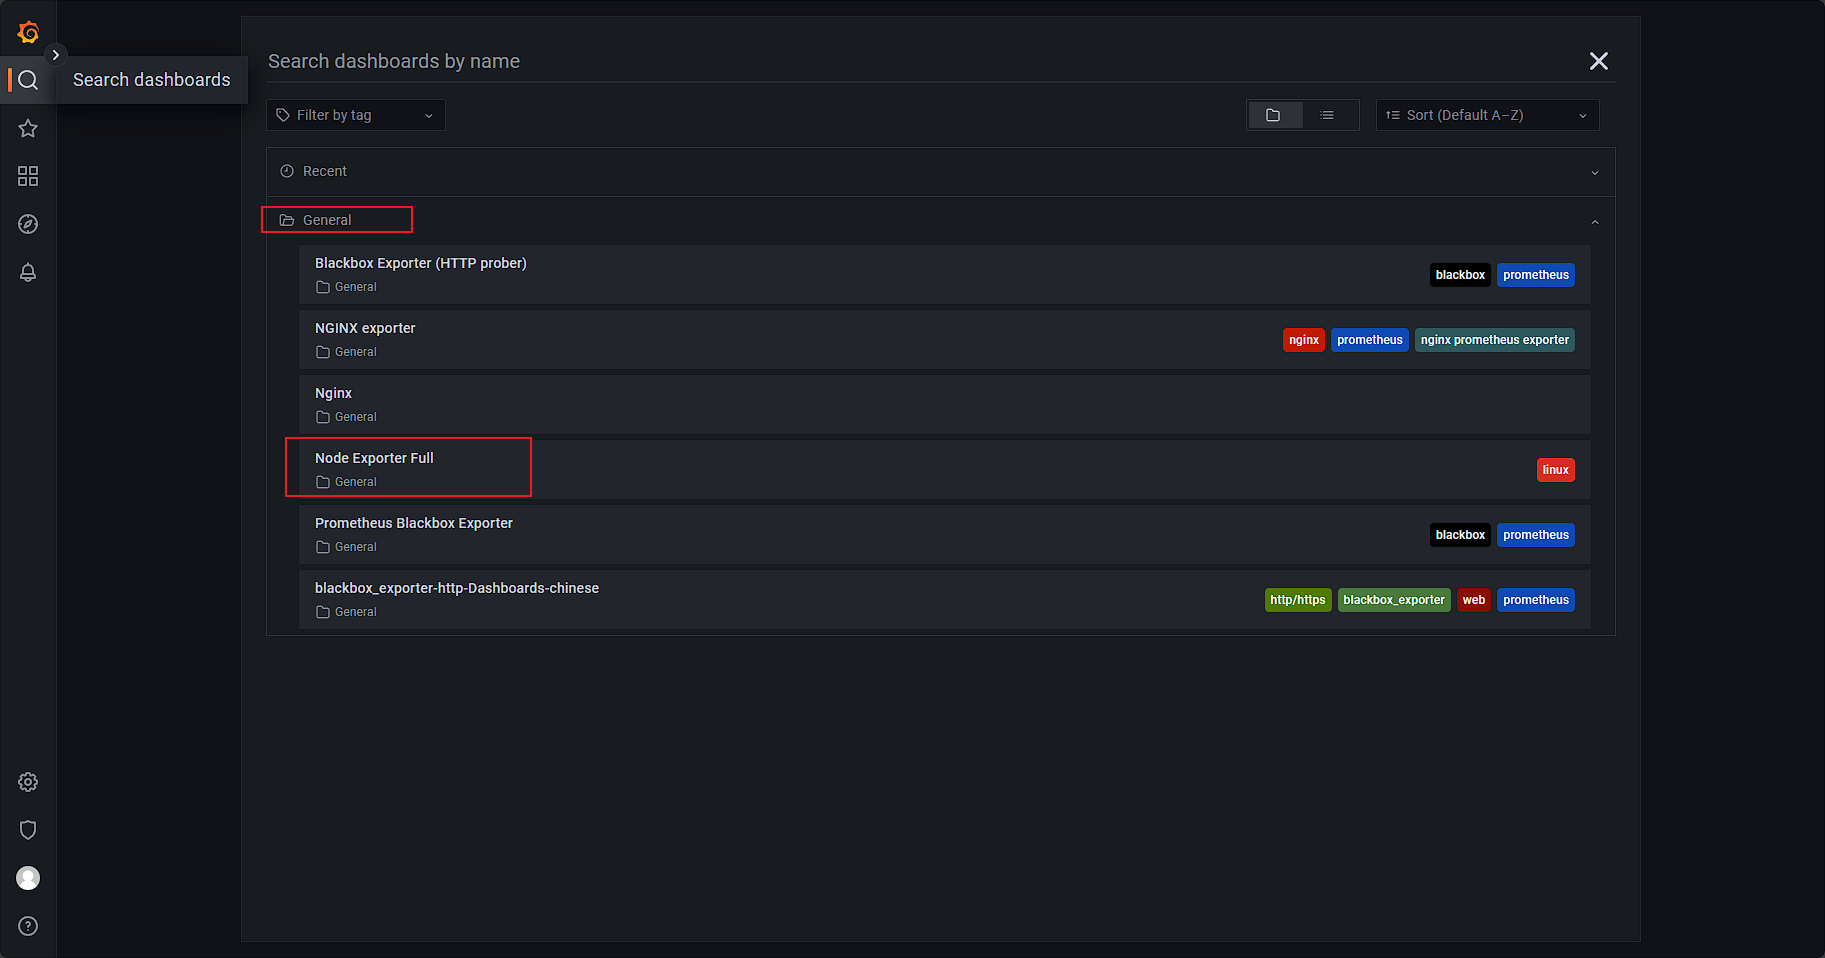
在search dashboard导航里也可以找到刚加的监控视图
五、部署Alertmanager
1、部署服务
alertmanager和Prometheus是独立发布的,使用前需要确认版本兼容关系,一般情况最新版之间都是兼容的
## 拉取镜像
docker pull prom/alertmanager

## 启动容器
docker run --name alertmanager -d -p 9093:9093 prom/alertmanager
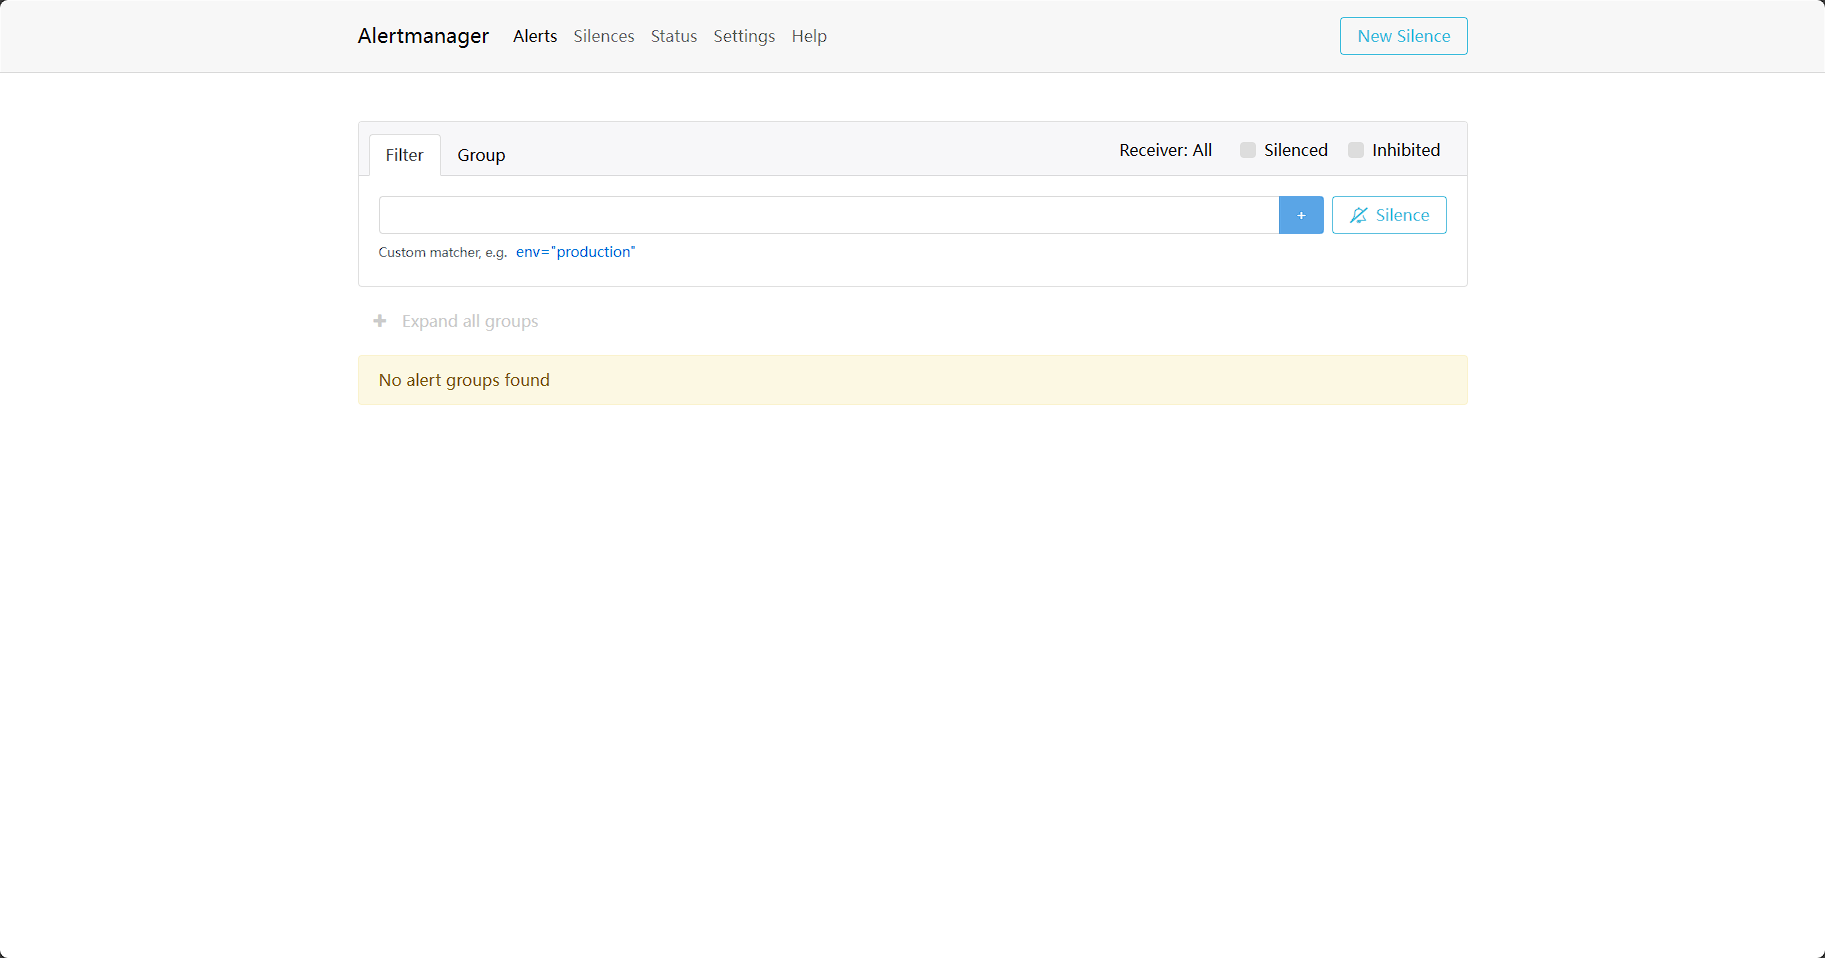
访问前端页面
2、配置Prometheus
在Prometheus配置中修改alertmanager的IP,由于alertmanager也运行在容器当中,因此也通过宿主机IP+端口的方式进行访问
alerting:
  alertmanagers:
    - static_configs:
        - targets:
           - 192.168.56.110:9093
3、添加告警规则
然后添加告警规则,创建rules.yml文件
groups:
- name: Instance
  rules:
  - alert: InstanceDown
    expr: up != 1
    for: 1m
    labels:
      severity: info
    annotations:
      summary: "{{ $labels.instance }}"
      description: "{{ $labels.instance }} of job {{ $labels.job }} has been in an unhealthy state for more than 1 minutes."
然后将rules文件复制到容器中,确认Prometheus已添加rules文件,重启Prometheus
rule_files:
  - "/etc/prometheus/rules.yml"
docker cp ./rules.yml prometheus:/etc/prometheus/rules.yml
docker restart prometheus
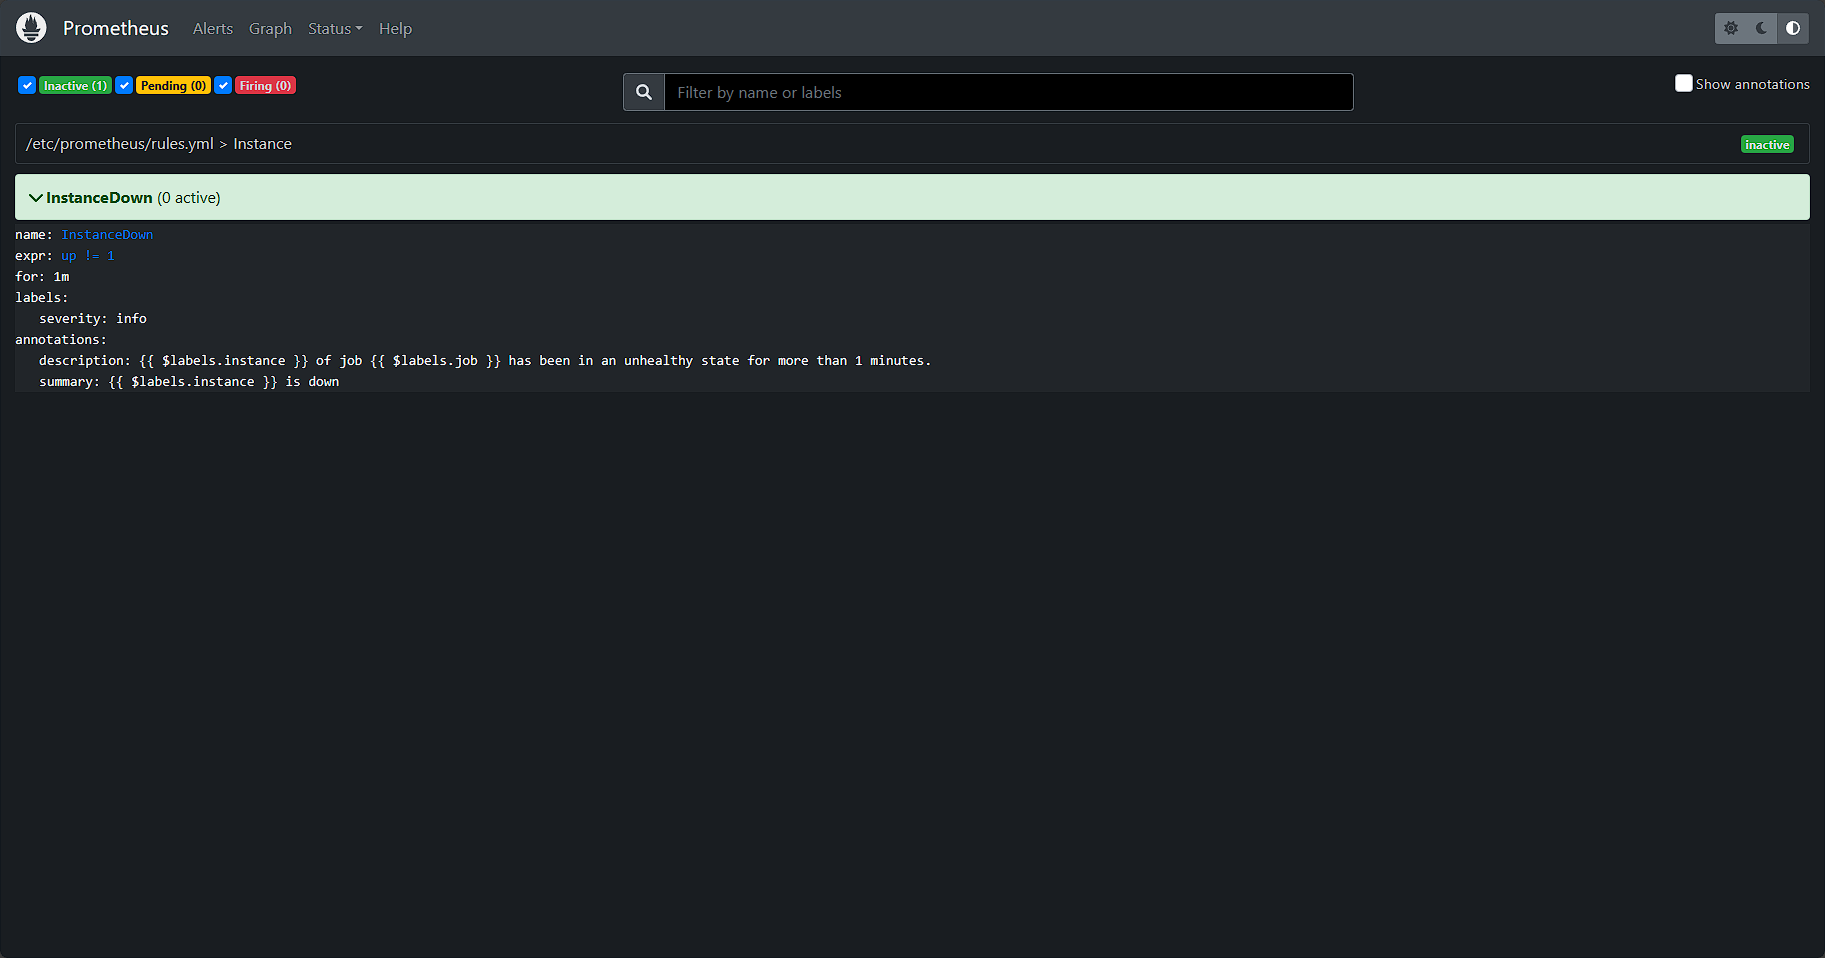
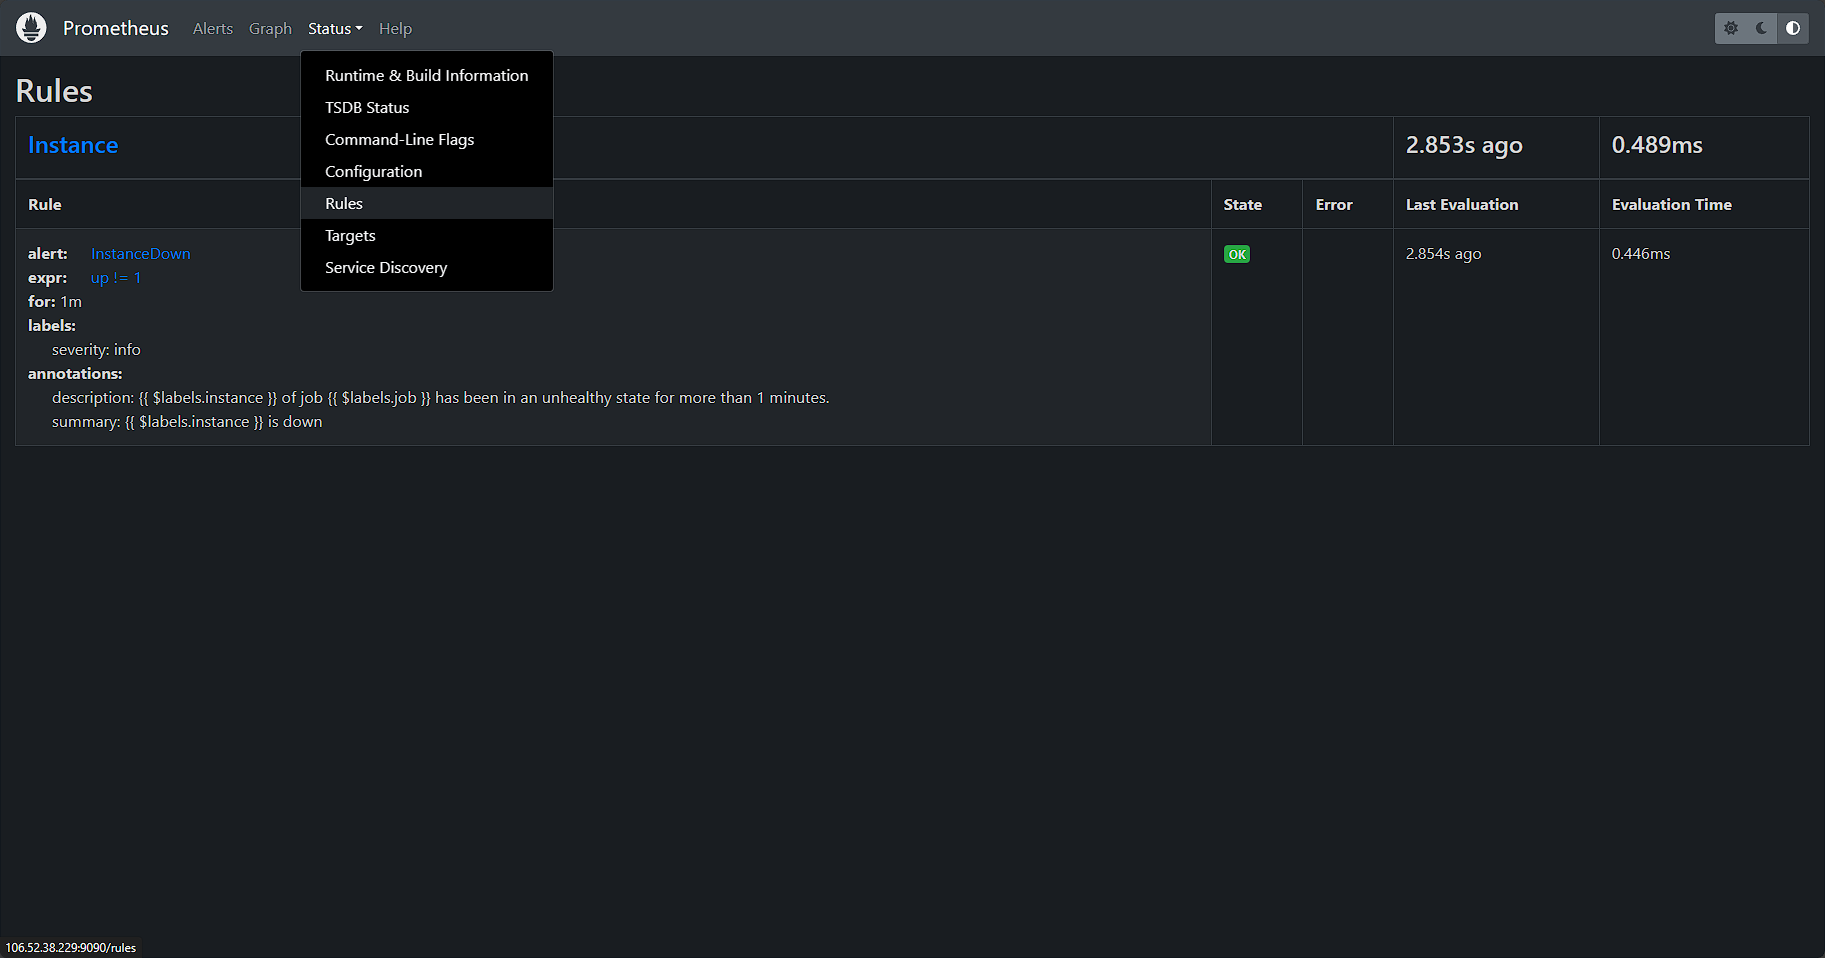
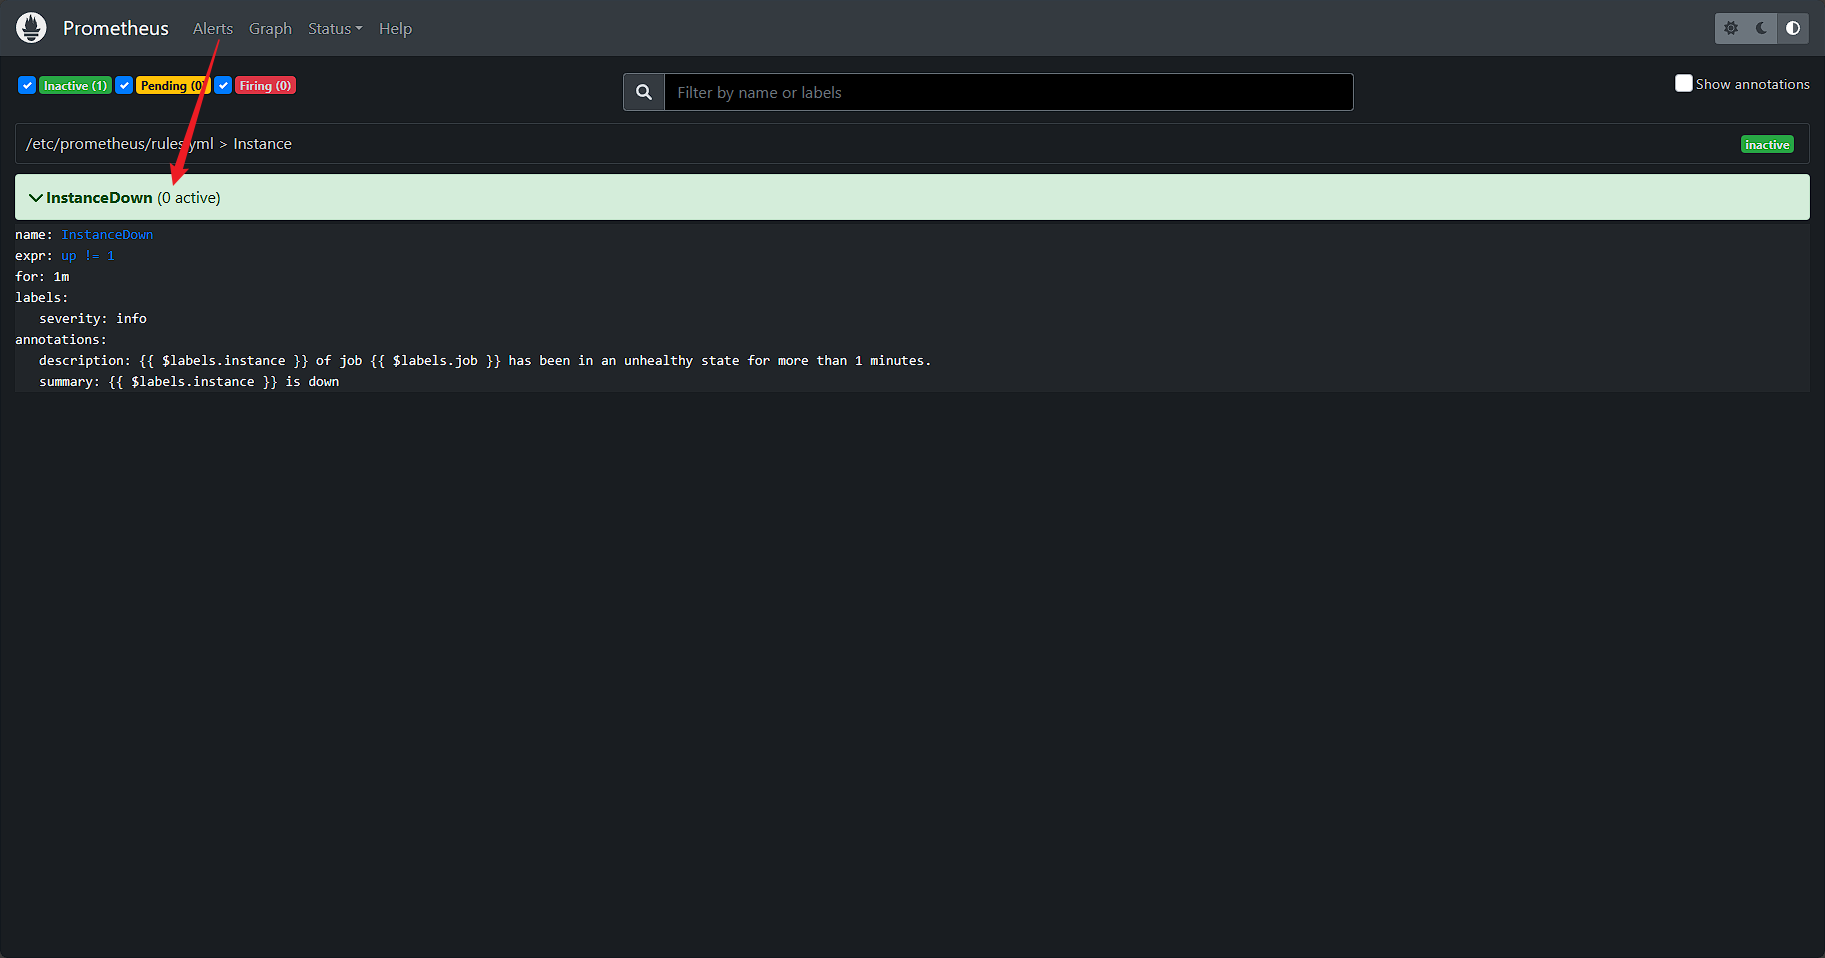
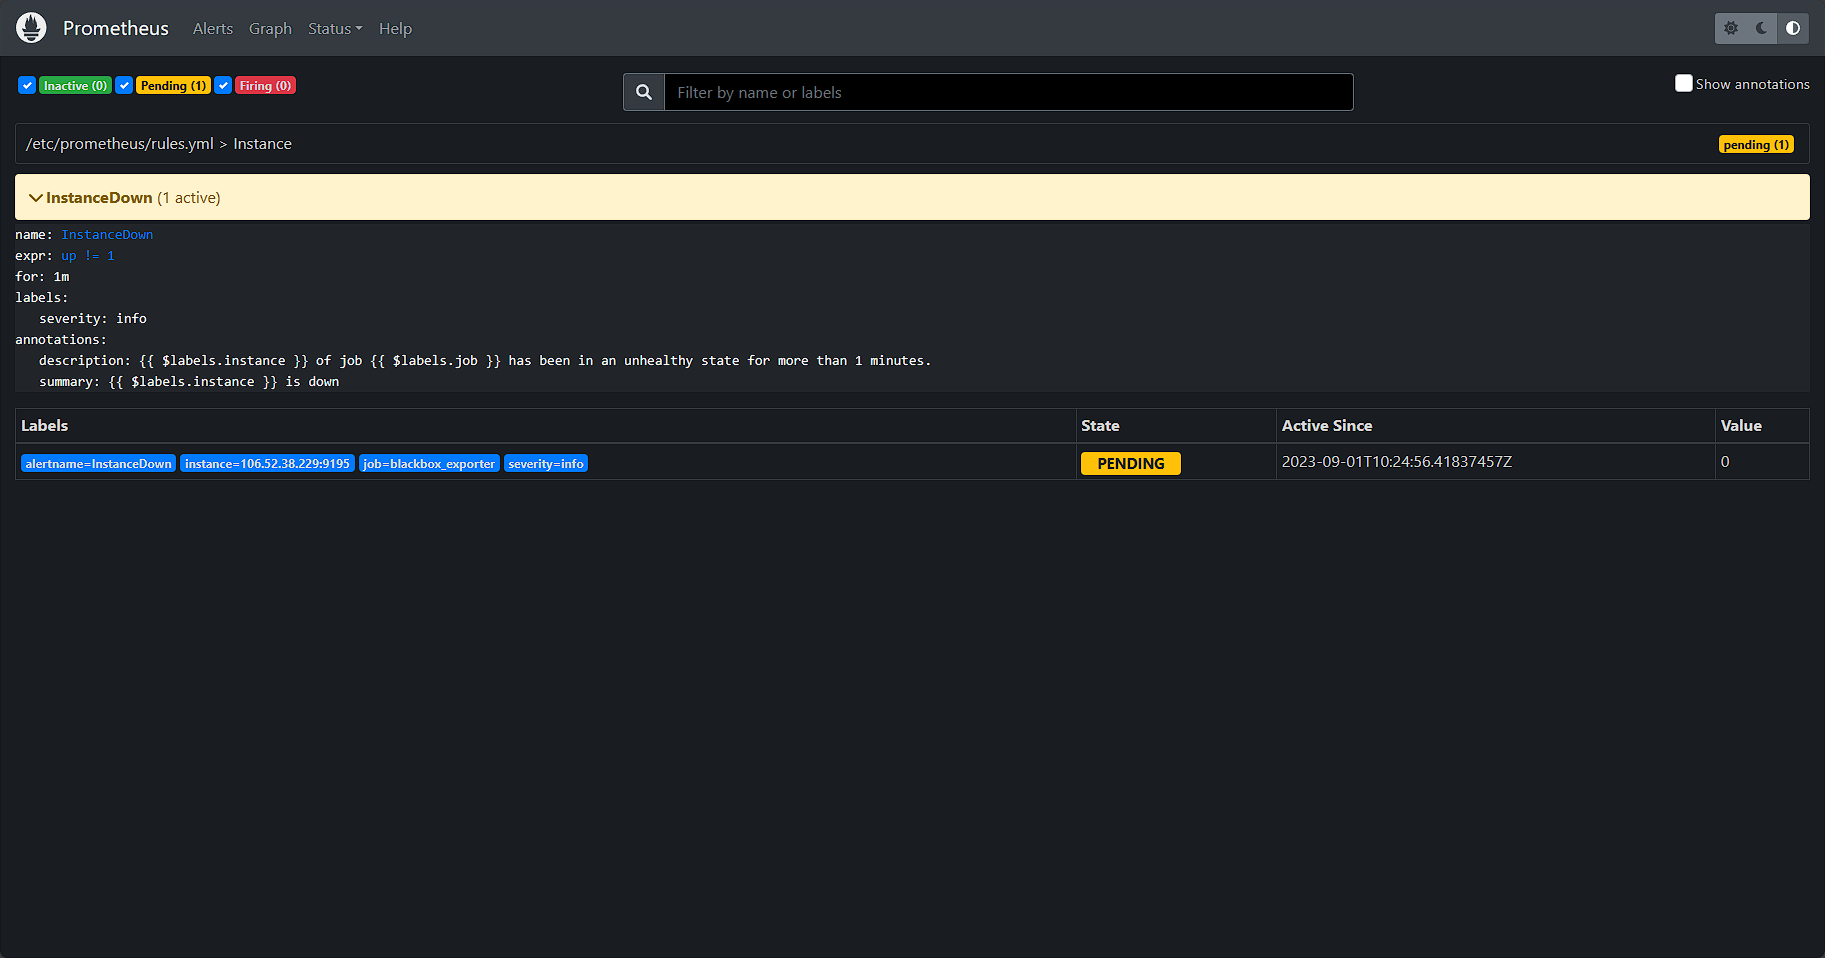
然后可以在Prometheus前端查看到刚配置的告警规则和告警触发情况
五、模拟触发告警
前面添加的规则时当有一个target的监控任务指标up!=0触发,因此手动停止blackbox_exporter来触发一个告警。
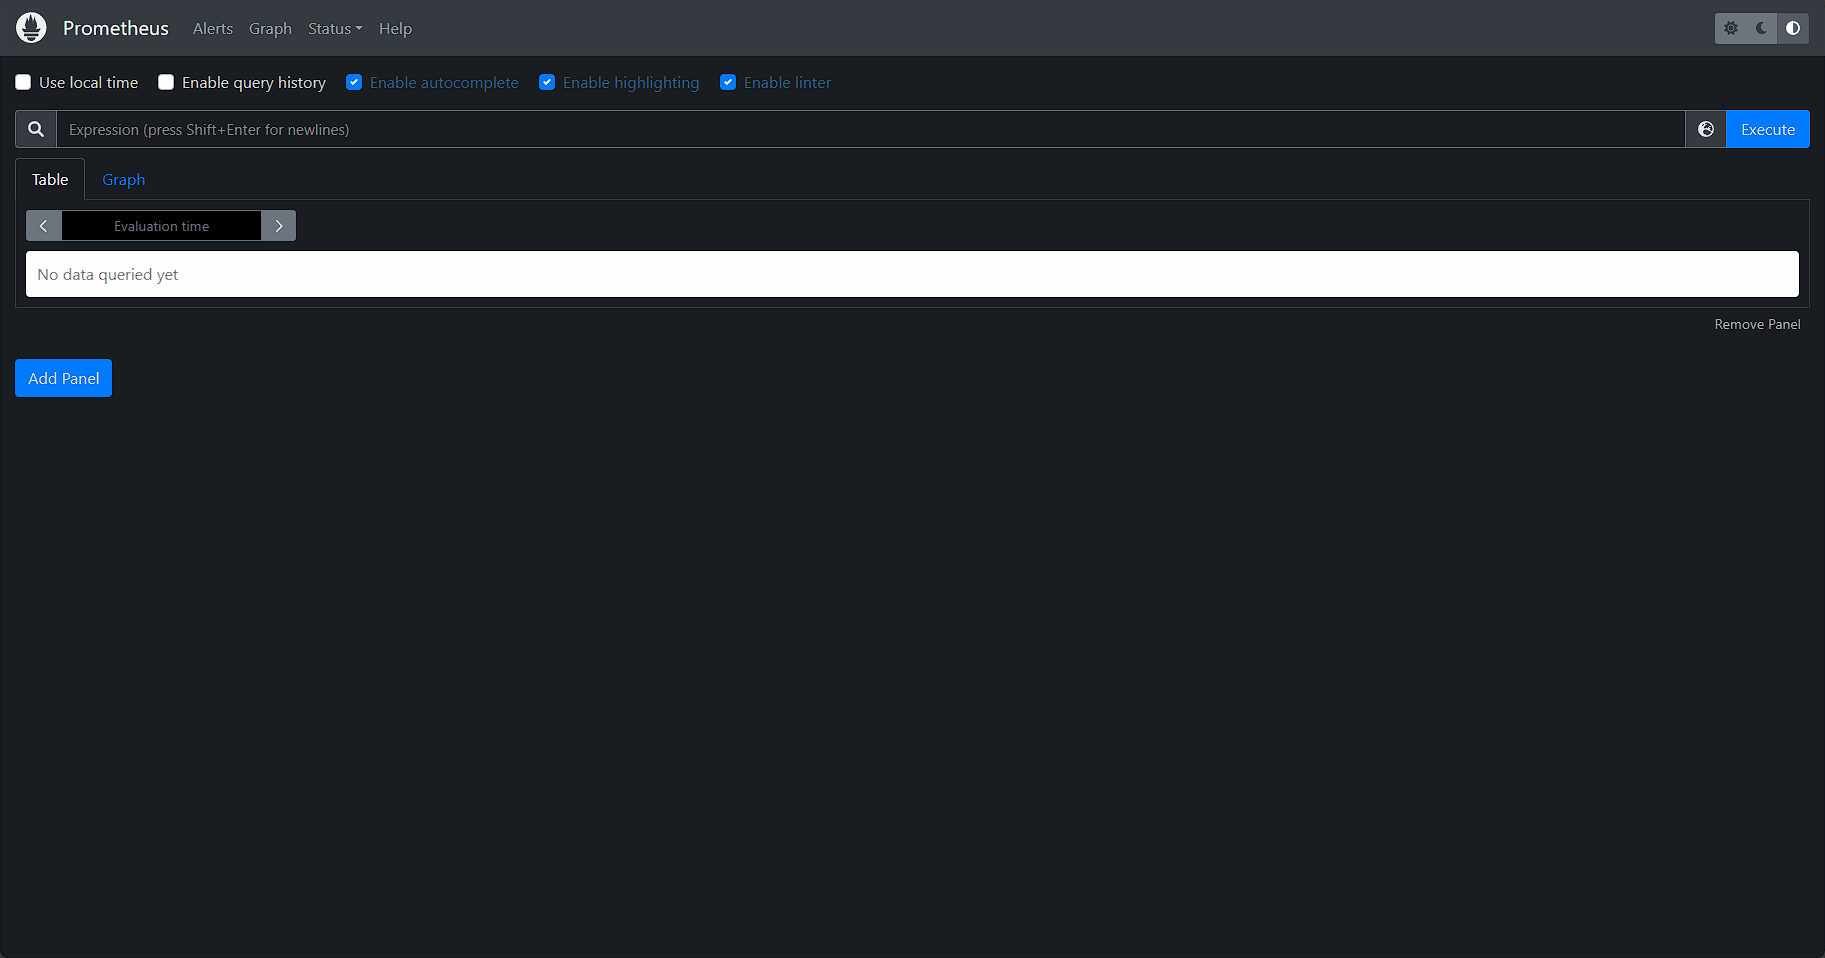
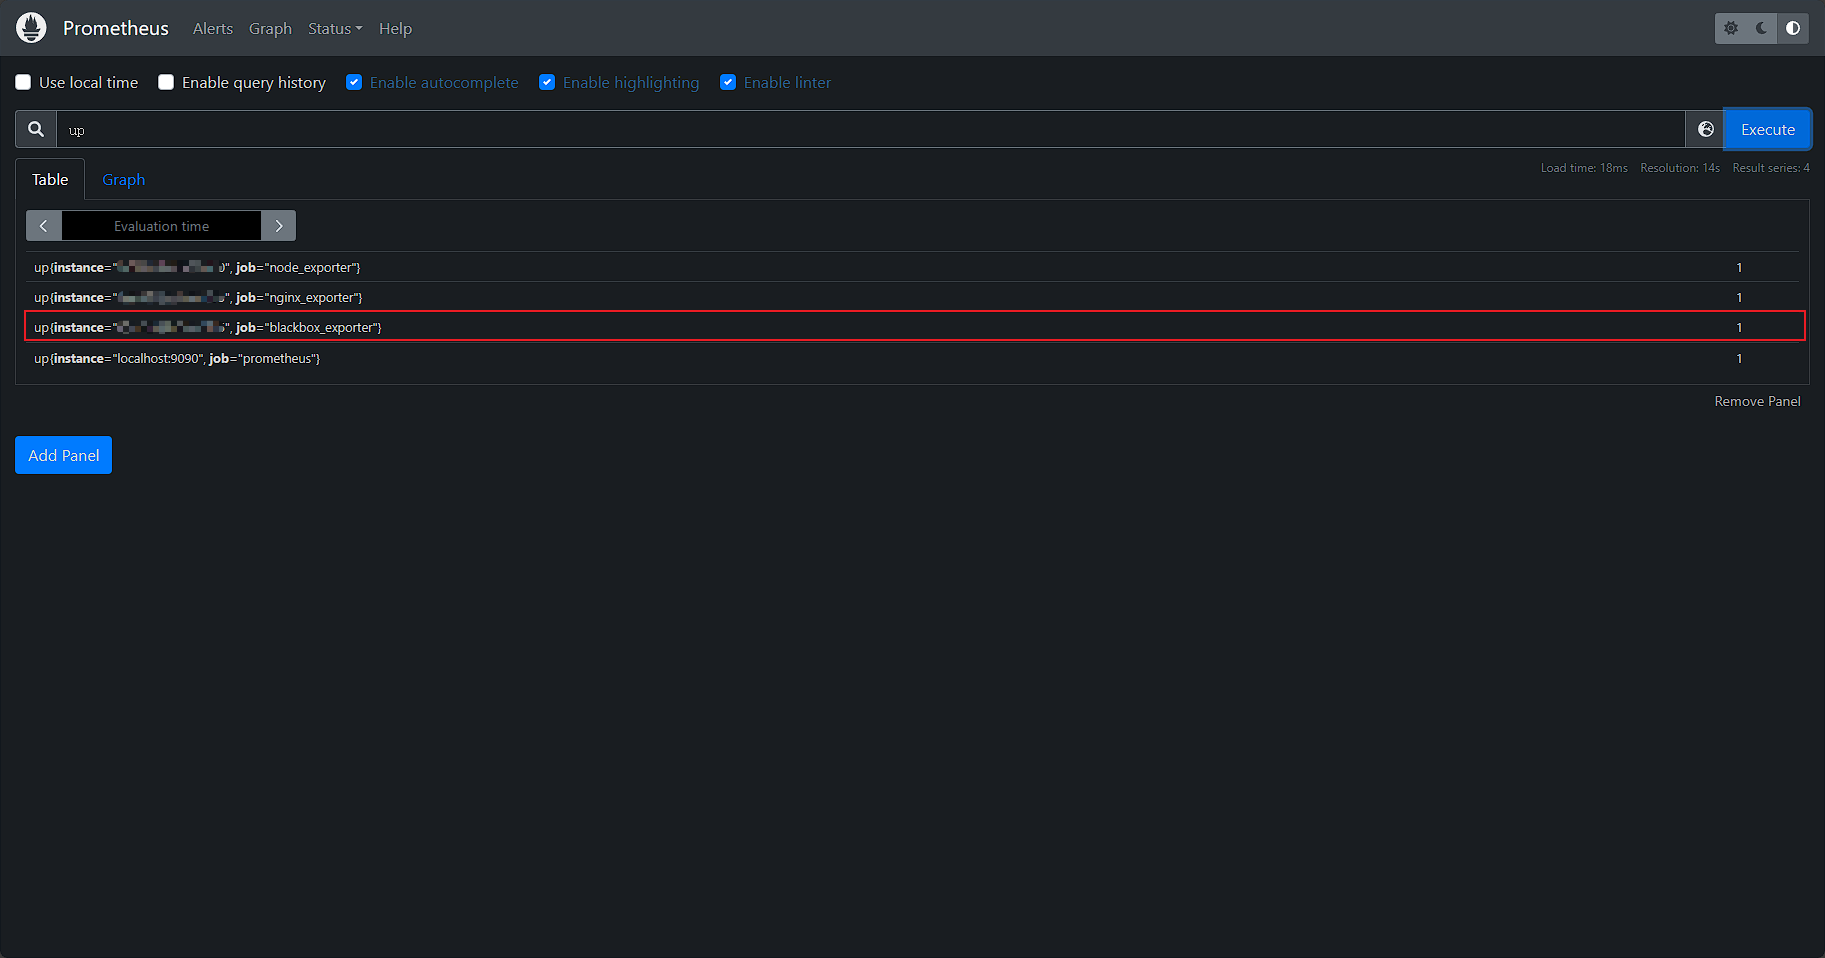
停用blackbox_exporter之前,检索up
停用blackbox_exporter
systemctl stop blackbox-exporter
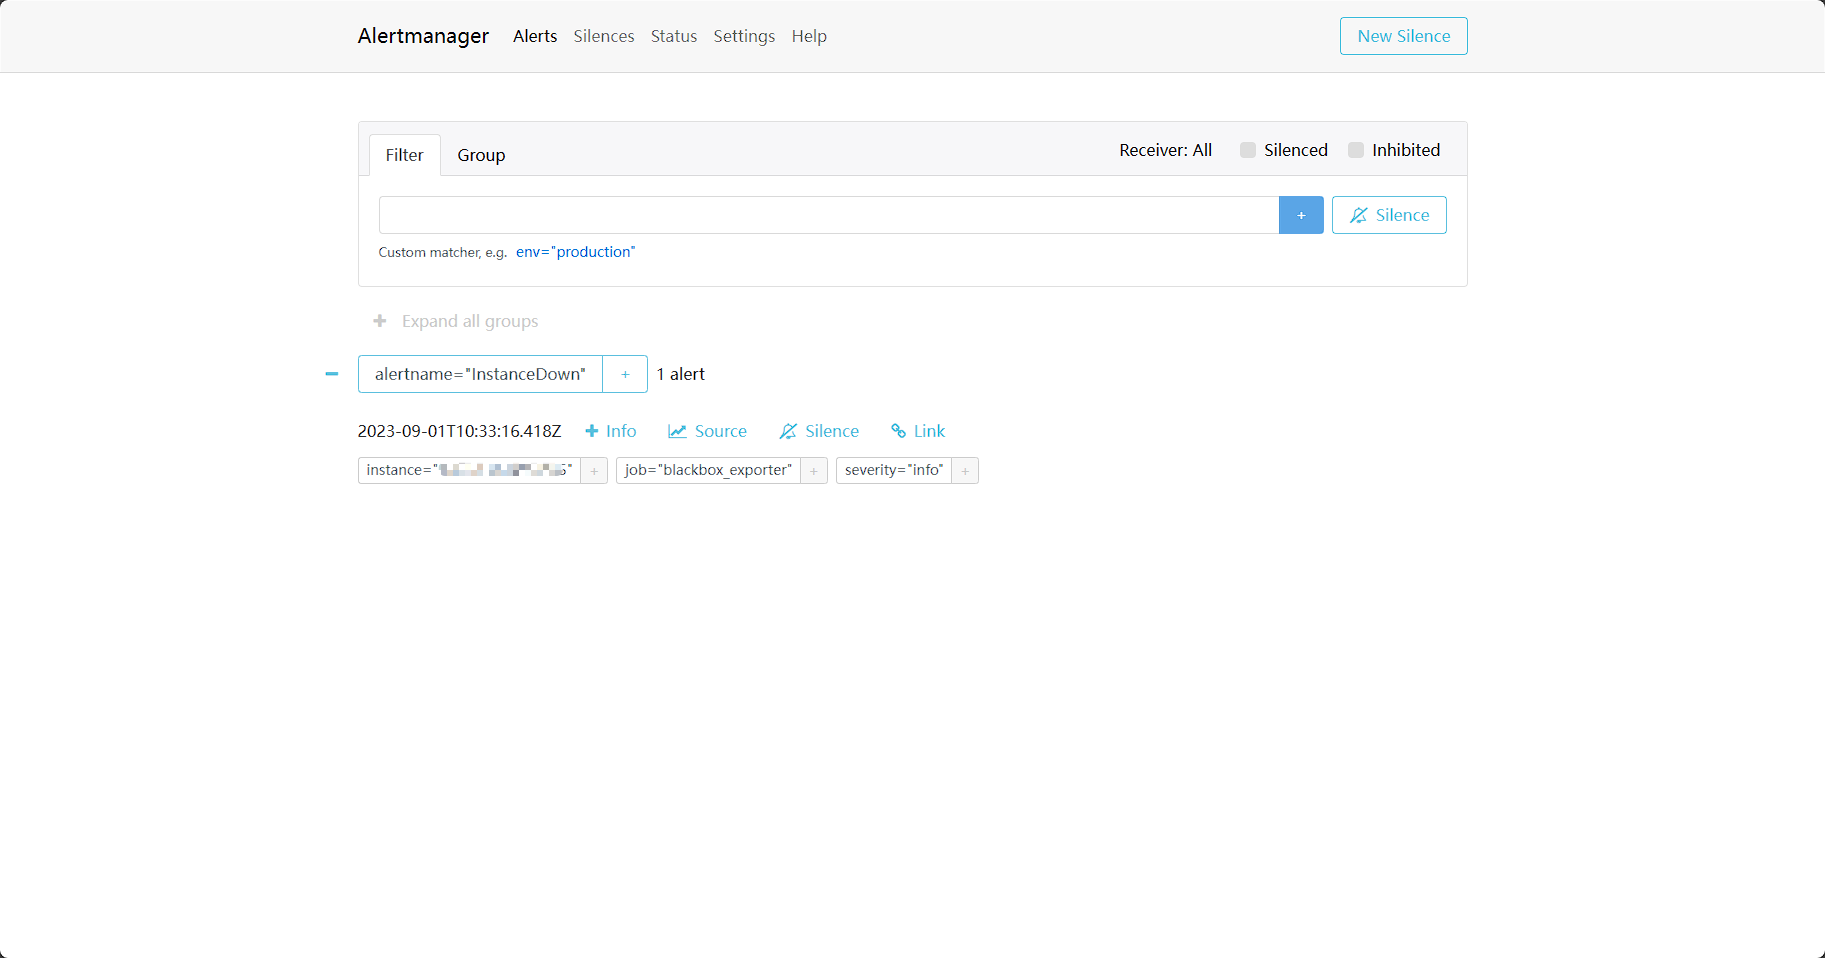
当blackbox_exporter停用后,可以看到带有lable:job="blackbox_exporter"的up数据变成0,触发了告警

由于告警规则中for: 1m1分钟后发送告警,因此alertmanager需要再触发告警规则(up!=1)一分钟后才会收到告警信息。
重新启动blackbox_exporter
systemctl start blackbox-exporter
告警已经关闭