在微服务架构下随着服务越来越多,定位问题也变得越来越复杂,因此监控服务的运行状态以及针对异常状态及时的发出告警也成为微服务治理不可或缺的一环。服务的监控主要有日志监控、调用链路监控、指标监控等几种类型方式,其中指标监控在整个微服务监控中比重最高,也是实际生产中排查问题最重要的依赖。
指标监控又可以细分为多种类型:
基础监控: 是针运行服务的基础设施的监控,比如容器、虚拟机、物理机等,监控的指标主要有内存的使用率,cpu 的使用率等资源的监控,通过对资源的监控和告警能够及时发现资源瓶颈从而进行扩容操作避免影响服务,同时针对资源的异常变化也能辅助定位服务问题,比如内存泄漏会导致内存异常。
运行时监控: 运行时监控主要有 GC 的监控包括 GC 次数、GC 耗时,线程数量的监控等等。
通用监控: 通用监控主要包括对流量和耗时的监控,通过流量的变化趋势可以清晰的了解到服务的流量高峰以及流量的增长情况,流量同时也是资源分配的重要参考指标。耗时是服务性能的直观体现,耗时比较大的服务我们往往需要进行优化,平均耗时往往参考价值不大,因为我们采取中位数,包括 90、95、99 值等。
错误监控: 错误监控是服务健康状态的直观体现,主要包括请求返回的错误码,如 HTTP 的错误码 5xx、4xx,熔断、限流等等,通过对服务错误率的观察可以了解到服务当前的健康状态。
一、pull方式接入
1.1、微服务网关监控
微服务网关接入监控,需要保证微服务网关集成了promethues。如果业务系统fork了网关的代码,也可以像1.2章节一样,在pom中添加依赖。
STEP1:添加配置
在配置中心gateway对应的namespace下添加
management:
endpoints:
web:
exposure:
include: "prometheus"
metrics:
tags:
application: ${spring.application.name}
podName: ${HOSTNAME}
distribution:
percentiles:
http.server.requests: 0.5,0.9,0.95,0.99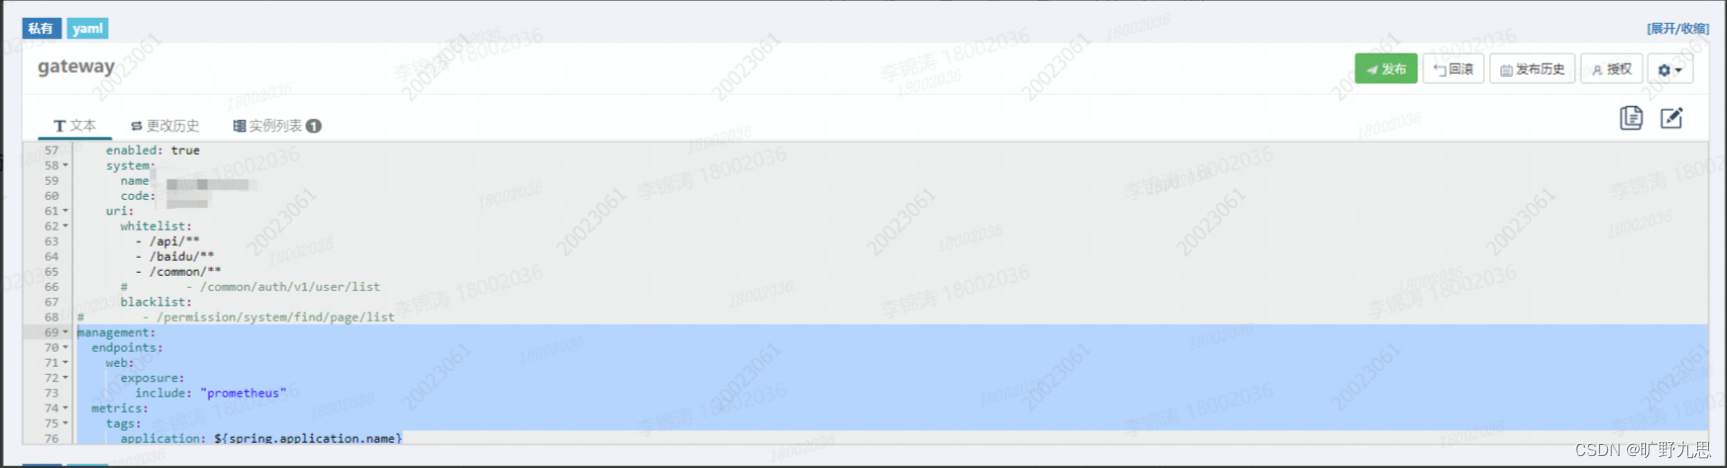 注意:添加完成后保存,发布才能生效。
STEP2:验证
启动项目,并根据ip:port/actuator/prometheus 访问,得到如下结果即为配置成功
# HELP jvm_gc_max_data_size_bytes Max size of long-lived heap memory pool
# TYPE jvm_gc_max_data_size_bytes gauge
jvm_gc_max_data_size_bytes{application="polaris-client",} 2.845310976E9
# HELP jvm_buffer_count_buffers An estimate of the number of buffers in the pool
# TYPE jvm_buffer_count_buffers gauge
jvm_buffer_count_buffers{application="polaris-client",id="mapped",} 0.0
jvm_buffer_count_buffers{application="polaris-client",id="direct",} 11.0
# HELP jvm_buffer_total_capacity_bytes An estimate of the total capacity of the buffers in this pool
# TYPE jvm_buffer_total_capacity_bytes gauge
jvm_buffer_total_capacity_bytes{application="polaris-client",id="mapped",} 0.0
jvm_buffer_total_capacity_bytes{application="polaris-client",id="direct",} 86016.0
# HELP process_start_time_seconds Start time of the process since unix epoch.
# TYPE process_start_time_seconds gauge
process_start_time_seconds{application="polaris-client",} 1.652236181116E9
# HELP process_cpu_usage The "recent cpu usage" for the Java Virtual Machine process
# TYPE process_cpu_usage gauge
process_cpu_usage{application="polaris-client",} 1.4355937217250055E-4
# HELP log4j2_events_total Number of fatal level log events
# TYPE log4j2_events_total counter
log4j2_events_total{application="polaris-client",level="error",} 0.0
log4j2_events_total{application="polaris-client",level="debug",} 0.0
log4j2_events_total{application="polaris-client",level="fatal",} 0.0
log4j2_events_total{application="polaris-client",level="info",} 7.0
log4j2_events_total{application="polaris-client",level="trace",} 0.0
log4j2_events_total{application="polaris-client",level="warn",} 0.0
# HELP system_cpu_usage The "recent cpu usage" for the whole system
# TYPE system_cpu_usage gauge
system_cpu_usage{application="polaris-client",} 0.08581370970137281
# HELP tomcat_sessions_active_max_sessions
# TYPE tomcat_sessions_active_max_sessions gauge
tomcat_sessions_active_max_sessions{application="polaris-client",} 0.0
# HELP jvm_threads_live_threads The current number of live threads including both daemon and non-daemon threads
# TYPE jvm_threads_live_threads gauge
jvm_threads_live_threads{application="polaris-client",} 25.0
# HELP jvm_gc_memory_promoted_bytes_total Count of positive increases in the size of the old generation memory pool before GC to after GC
# TYPE jvm_gc_memory_promoted_bytes_total counter
jvm_gc_memory_promoted_bytes_total{application="polaris-client",} 5262472.0
# HELP tomcat_sessions_active_current_sessions
# TYPE tomcat_sessions_active_current_sessions gauge
tomcat_sessions_active_current_sessions{application="polaris-client",} 0.0
# HELP system_cpu_count The number of processors available to the Java virtual machine
# TYPE system_cpu_count gauge
system_cpu_count{application="polaris-client",} 8.0
# HELP tomcat_sessions_expired_sessions_total
# TYPE tomcat_sessions_expired_sessions_total counter
tomcat_sessions_expired_sessions_total{application="polaris-client",} 0.0
# HELP jvm_memory_used_bytes The amount of used memory
# TYPE jvm_memory_used_bytes gauge
jvm_memory_used_bytes{application="polaris-client",area="nonheap",id="Compressed Class Space",} 5712960.0
jvm_memory_used_bytes{application="polaris-client",area="heap",id="PS Survivor Space",} 9707600.0
jvm_memory_used_bytes{application="polaris-client",area="heap",id="PS Old Gen",} 1.4643392E7
jvm_memory_used_bytes{application="polaris-client",area="nonheap",id="Metaspace",} 4.16392E7
jvm_memory_used_bytes{application="polaris-client",area="heap",id="PS Eden Space",} 3.3126456E7
jvm_memory_used_bytes{application="polaris-client",area="nonheap",id="Code Cache",} 8354752.0
# HELP jvm_threads_peak_threads The peak live thread count since the Java virtual machine started or peak was reset
# TYPE jvm_threads_peak_threads gauge
jvm_threads_peak_threads{application="polaris-client",} 29.0
# HELP jvm_threads_daemon_threads The current number of live daemon threads
# TYPE jvm_threads_daemon_threads gauge
jvm_threads_daemon_threads{application="polaris-client",} 21.0
# HELP jvm_gc_memory_allocated_bytes_total Incremented for an increase in the size of the (young) heap memory pool after one GC to before the next
# TYPE jvm_gc_memory_allocated_bytes_total counter
jvm_gc_memory_allocated_bytes_total{application="polaris-client",} 1.49866568E8
# HELP jvm_classes_unloaded_classes_total The total number of classes unloaded since the Java virtual machine has started execution
# TYPE jvm_classes_unloaded_classes_total counter
jvm_classes_unloaded_classes_total{application="polaris-client",} 0.0
# HELP tomcat_sessions_created_sessions_total
# TYPE tomcat_sessions_created_sessions_total counter
tomcat_sessions_created_sessions_total{application="polaris-client",} 0.0
# HELP jvm_gc_live_data_size_bytes Size of long-lived heap memory pool after reclamation
# TYPE jvm_gc_live_data_size_bytes gauge
jvm_gc_live_data_size_bytes{application="polaris-client",} 1.46352E7
# HELP jvm_buffer_memory_used_bytes An estimate of the memory that the Java virtual machine is using for this buffer pool
# TYPE jvm_buffer_memory_used_bytes gauge
jvm_buffer_memory_used_bytes{application="polaris-client",id="mapped",} 0.0
jvm_buffer_memory_used_bytes{application="polaris-client",id="direct",} 86016.0
# HELP jvm_classes_loaded_classes The number of classes that are currently loaded in the Java virtual machine
# TYPE jvm_classes_loaded_classes gauge
jvm_classes_loaded_classes{application="polaris-client",} 8473.0
# HELP tomcat_sessions_rejected_sessions_total
# TYPE tomcat_sessions_rejected_sessions_total counter
tomcat_sessions_rejected_sessions_total{application="polaris-client",} 0.0
# HELP tomcat_sessions_alive_max_seconds
# TYPE tomcat_sessions_alive_max_seconds gauge
tomcat_sessions_alive_max_seconds{application="polaris-client",} 0.0
# HELP jvm_threads_states_threads The current number of threads having NEW state
# TYPE jvm_threads_states_threads gauge
jvm_threads_states_threads{application="polaris-client",state="blocked",} 0.0
jvm_threads_states_threads{application="polaris-client",state="waiting",} 12.0
jvm_threads_states_threads{application="polaris-client",state="terminated",} 0.0
jvm_threads_states_threads{application="polaris-client",state="new",} 0.0
jvm_threads_states_threads{application="polaris-client",state="runnable",} 9.0
jvm_threads_states_threads{application="polaris-client",state="timed-waiting",} 4.0
# HELP jvm_memory_max_bytes The maximum amount of memory in bytes that can be used for memory management
# TYPE jvm_memory_max_bytes gauge
jvm_memory_max_bytes{application="polaris-client",area="nonheap",id="Compressed Class Space",} 1.073741824E9
jvm_memory_max_bytes{application="polaris-client",area="heap",id="PS Survivor Space",} 9961472.0
jvm_memory_max_bytes{application="polaris-client",area="heap",id="PS Old Gen",} 2.845310976E9
jvm_memory_max_bytes{application="polaris-client",area="nonheap",id="Metaspace",} -1.0
jvm_memory_max_bytes{application="polaris-client",area="heap",id="PS Eden Space",} 1.400897536E9
jvm_memory_max_bytes{application="polaris-client",area="nonheap",id="Code Cache",} 2.5165824E8
# HELP jvm_gc_pause_seconds Time spent in GC pause
# TYPE jvm_gc_pause_seconds summary
jvm_gc_pause_seconds_count{action="end of minor GC",application="polaris-client",cause="Metadata GC Threshold",} 1.0
jvm_gc_pause_seconds_sum{action="end of minor GC",application="polaris-client",cause="Metadata GC Threshold",} 0.006
jvm_gc_pause_seconds_count{action="end of minor GC",application="polaris-client",cause="Allocation Failure",} 1.0
jvm_gc_pause_seconds_sum{action="end of minor GC",application="polaris-client",cause="Allocation Failure",} 0.008
jvm_gc_pause_seconds_count{action="end of major GC",application="polaris-client",cause="Metadata GC Threshold",} 1.0
jvm_gc_pause_seconds_sum{action="end of major GC",application="polaris-client",cause="Metadata GC Threshold",} 0.03
# HELP jvm_gc_pause_seconds_max Time spent in GC pause
# TYPE jvm_gc_pause_seconds_max gauge
jvm_gc_pause_seconds_max{action="end of minor GC",application="polaris-client",cause="Metadata GC Threshold",} 0.0
jvm_gc_pause_seconds_max{action="end of minor GC",application="polaris-client",cause="Allocation Failure",} 0.0
jvm_gc_pause_seconds_max{action="end of major GC",application="polaris-client",cause="Metadata GC Threshold",} 0.0
# HELP jvm_memory_committed_bytes The amount of memory in bytes that is committed for the Java virtual machine to use
# TYPE jvm_memory_committed_bytes gauge
jvm_memory_committed_bytes{application="polaris-client",area="nonheap",id="Compressed Class Space",} 6340608.0
jvm_memory_committed_bytes{application="polaris-client",area="heap",id="PS Survivor Space",} 9961472.0
jvm_memory_committed_bytes{application="polaris-client",area="heap",id="PS Old Gen",} 1.78782208E8
jvm_memory_committed_bytes{application="polaris-client",area="nonheap",id="Metaspace",} 4.4875776E7
jvm_memory_committed_bytes{application="polaris-client",area="heap",id="PS Eden Space",} 9.7517568E7
jvm_memory_committed_bytes{application="polaris-client",area="nonheap",id="Code Cache",} 8388608.0
# HELP process_uptime_seconds The uptime of the Java virtual machine
# TYPE process_uptime_seconds gauge
process_uptime_seconds{application="polaris-client",} 1527.975
# HELP http_server_requests_seconds
# TYPE http_server_requests_seconds summary
http_server_requests_seconds_count{application="polaris-client",exception="None",method="GET",outcome="SUCCESS",status="200",uri="/hc",} 10.0
http_server_requests_seconds_sum{application="polaris-client",exception="None",method="GET",outcome="SUCCESS",status="200",uri="/hc",} 0.015297999
http_server_requests_seconds_count{application="polaris-client",exception="None",method="GET",outcome="CLIENT_ERROR",status="404",uri="/**",} 1.0
http_server_requests_seconds_sum{application=