《OpenShift / RHEL / DevSecOps 汇总目录》
说明:本文已经在 OpenShift 4.13 的环境中验证
文章目录
- OpenShift 的监控功能构成
- 部署被监控应用
- 用 OpenShift 内置功能监控应用
- 用 Grafana 监控应用
- 安装 Grafana 运行环境
- 配置 Grafana 数据源
- 定制监控 Dashboard
- 演示视频
- 参考
OpenShift 的监控功能构成
构成 OpenShift 监控功能的附件分为两部分:“平台监控组件” 和 “用户项目监控组件”。
- 在平台监控组件中包括:Prometheus、Thanos Querier 和 Alertmanager 三部分重要组成,这些组件是由 Cluster Monitoring Operator 总体部署和管理生命周期的。通过平台监控组件可以对 OpenShift 集群的 DNS、日志系统、etcd、Kubelet、API Server、Scheduler 等重要环境进行监控。
- 用户项目监控组件是对用户自有项目中应用资源进行监控。它由单独的 Prometheus、Thanos Ruler 构成,并共用平台的 Alertmanager 和 Thanos Querier 组件。
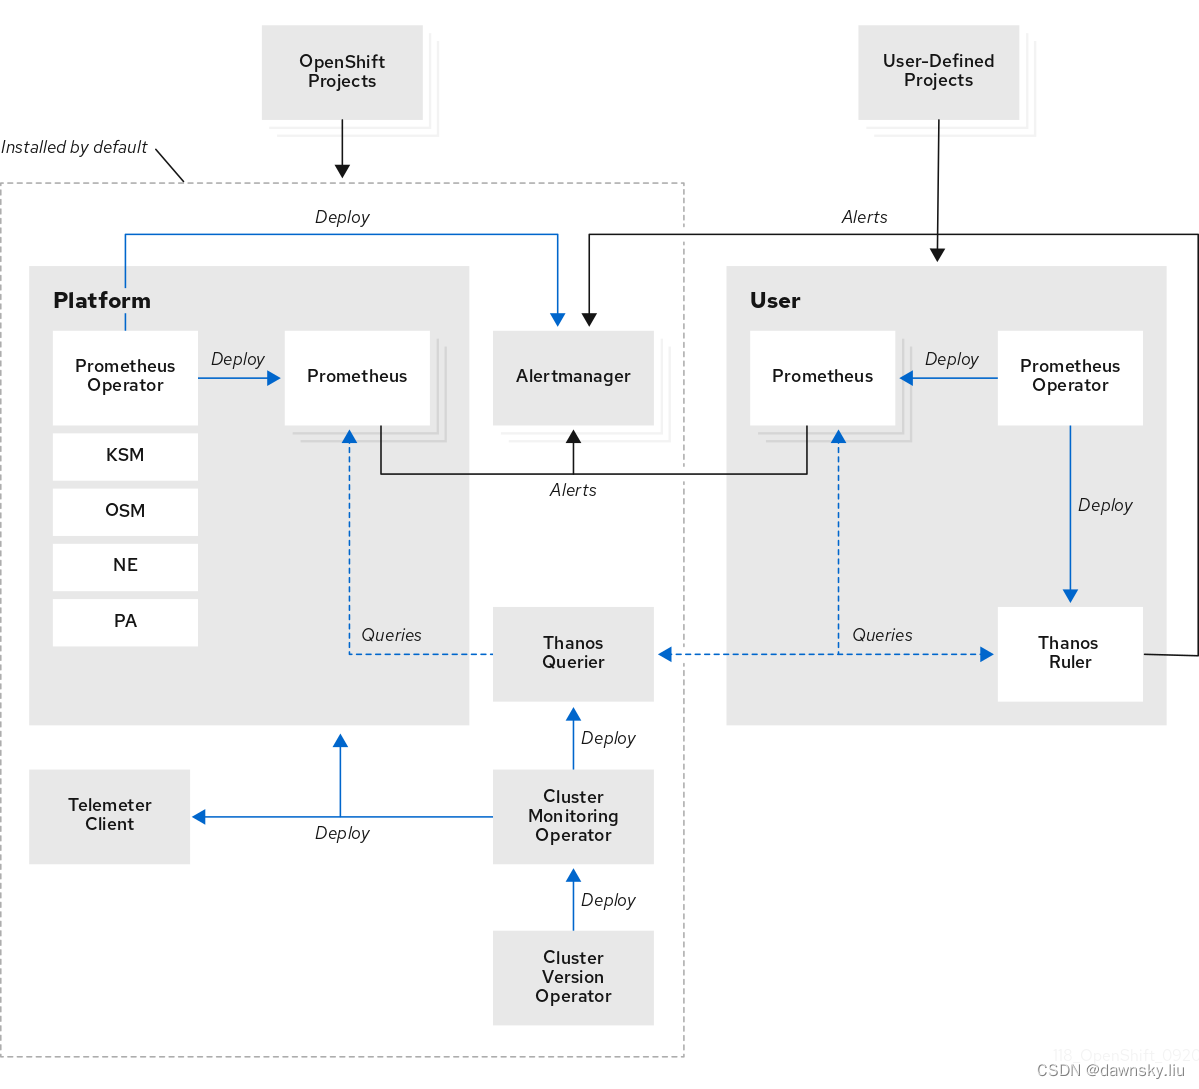
除了可以使用 OpenShift 控制台内置的监控功能和界面外,还可通过 Thanos Querier 的访问地址外接其他监控软件,例如使用 Grafana 定制的仪表盘显示 OpenShift 或用户应用的运行情况。
部署被监控应用
- 创建项目
$ oc new-project app-monitoring
- 部署测试应用
$ oc new-app quay.io/brancz/prometheus-example-app:v0.2.0 -l app=prometheus-example-app
- 创建 Service 和 Route。
$ cat << EOF | oc apply -f -
apiVersion: v1
kind: Service
metadata:
  labels:
    app: prometheus-example-app
  name: prometheus-example-app
spec:
  ports:
  - port: 8080
    protocol: TCP
    name: 8080-tcp
  selector:
    app: prometheus-example-app
  type: ClusterIP
EOF

$ oc expose svc prometheus-example-app
- 分别访问应用缺省地址和 /err 地址,返回的 HTTP 代码分别为 200 和 404。
$ curl -sw "%{http_code}\n" -o /dev/null $(oc get route prometheus-example-app -ojsonpath={.spec.host})
200
$ curl -sw "%{http_code}\n" -o /dev/null $(oc get route prometheus-example-app -ojsonpath={.spec.host})/err
404
- 访问应用的 /metrics 地址,查看应用返回的 HTTP 代码为 200 和 404 请求数量统计。
$ curl $(oc get route prometheus-example-app -ojsonpath={.spec.host})/metrics
# HELP http_requests_total Count of all HTTP requests
# TYPE http_requests_total counter
http_requests_total{code="200",method="get"} 1
http_requests_total{code="404",method="get"} 1
# HELP version Version information about this binary
# TYPE version gauge
version{version="v0.2.0"} 1
说明:
也可在控制台上部署 quay.io/brancz/prometheus-example-app:v0.2.0 容器镜像,但需要增加 app=prometheus-example-app 标签,并且去掉 “安全路由” 选项。
用 OpenShift 内置功能监控应用
- 启用 OpenShift 对用户应用监控功能。
$ cat << EOF | oc apply -f -
apiVersion: v1
kind: ConfigMap
metadata:
  name: cluster-monitoring-config
  namespace: openshift-monitoring
data:
  config.yaml: |
    enableUserWorkload: true
EOF
- 确认主要监控服务云子运行正常。
$ oc get pod -n openshift-user-workload-monitoring
NAME                                   READY   STATUS    RESTARTS      AGE
prometheus-operator-77d547b4dc-fcflk   2/2     Running   0             34h
prometheus-user-workload-0             6/6     Running   0             34h
thanos-ruler-user-workload-0           4/4     Running   0             34h
- 创建对 prometheus-example-app 应用监控的 ServiceMonitor 对象。
$ cat << EOF | oc apply -f -
apiVersion: monitoring.coreos.com/v1
kind: ServiceMonitor
metadata:
  name: prometheus-example-monitor
  namespace: app-monitoring
spec:
  endpoints:
  - interval: 30s
    port: 8080-tcp
    path: /metrics
  selector:
    matchLabels:
      app: prometheus-example-app
EOF
- 创建完后在 OpenShift 的 “目标” 菜单中在 “过滤器” 中选择 “用户”,稍等后可以看到目标的监视端点。
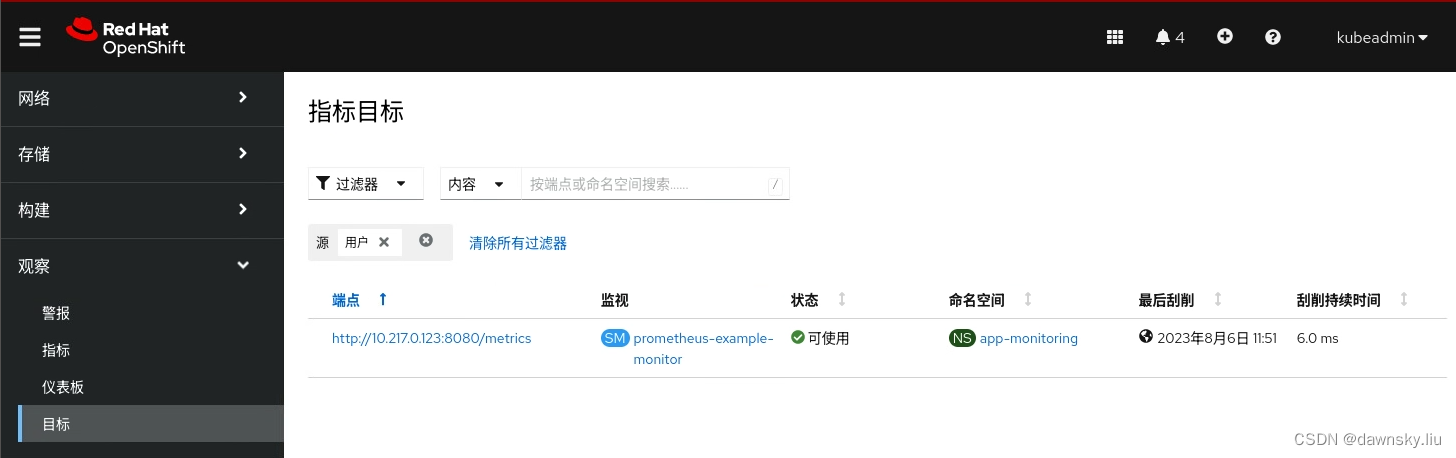
该端点地址是运行应用的 Pod 使用的 IP 地址。
$ oc get pod -owide
NAME                                     READY   STATUS    RESTARTS   AGE     IP             NODE                 NOMINATED NODE   READINESS GATES
prometheus-example-app-b744f9c85-bmk7p   1/1     Running   0          6m15s   10.217.0.123   crc-2zx29-master-0   <none>           <none>
- 创建 PrometheusRule。下面的 expr 表达式会统计过去 5 分钟 HTTP 请求返回结果是 404 的每秒速率,如果 > 0.3 则报警。
$ cat << EOF | oc apply -f -
apiVersion: monitoring.coreos.com/v1
kind: PrometheusRule
metadata:
  name: app-alert
  namespace: app-monitoring
spec:
  groups:
  - name: app-alert
    rules:
    - alert: HttpRequestErrorRateIncrease
      expr: rate(http_requests_total{code="404",job="prometheus-example-app"}[5m]) > 0.3
      labels:
        severity: warning
      annotations:
        summary: Prometheus example app's error rate increase.
        message: Prometheus example app's error rate increase.
EOF
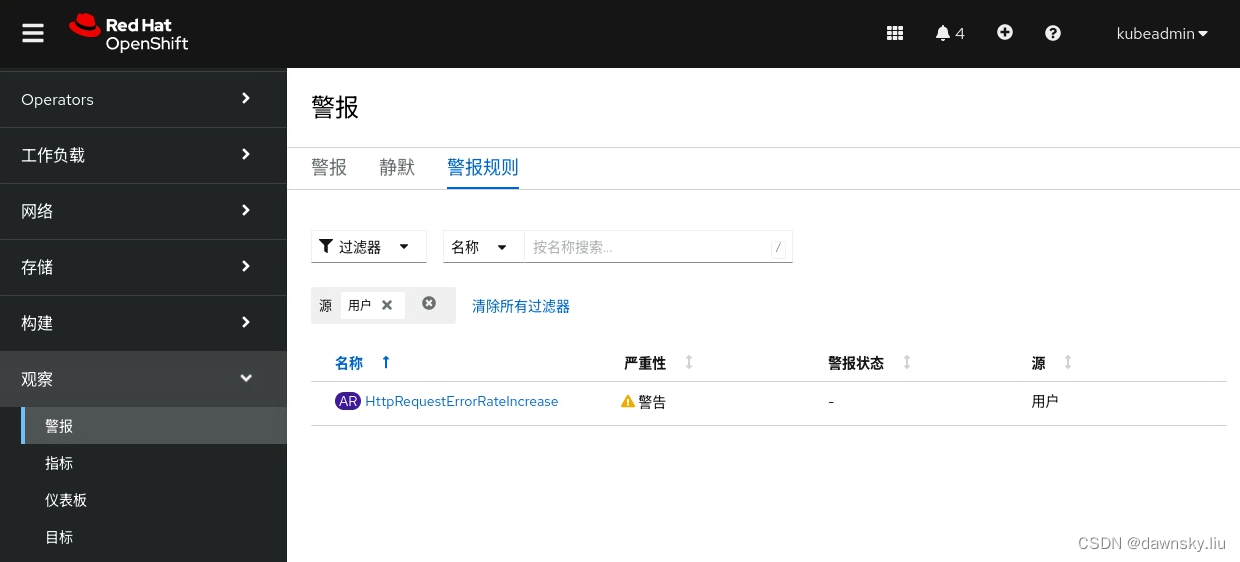
创建完后可以在“报警” 菜单中的 “报警规则” 页面中通过将 “过滤器” 中选择 “用户”,可以看到该报警规则。
- 执行以下命令,持续访问应用的 /err 地址。
$ for i in `seq 1 10000`
do
  curl -sw "%{http_code}\n" -o /dev/null $(oc get route prometheus-example-app -ojsonpath={.spec.host})/err
  sleep 1
done
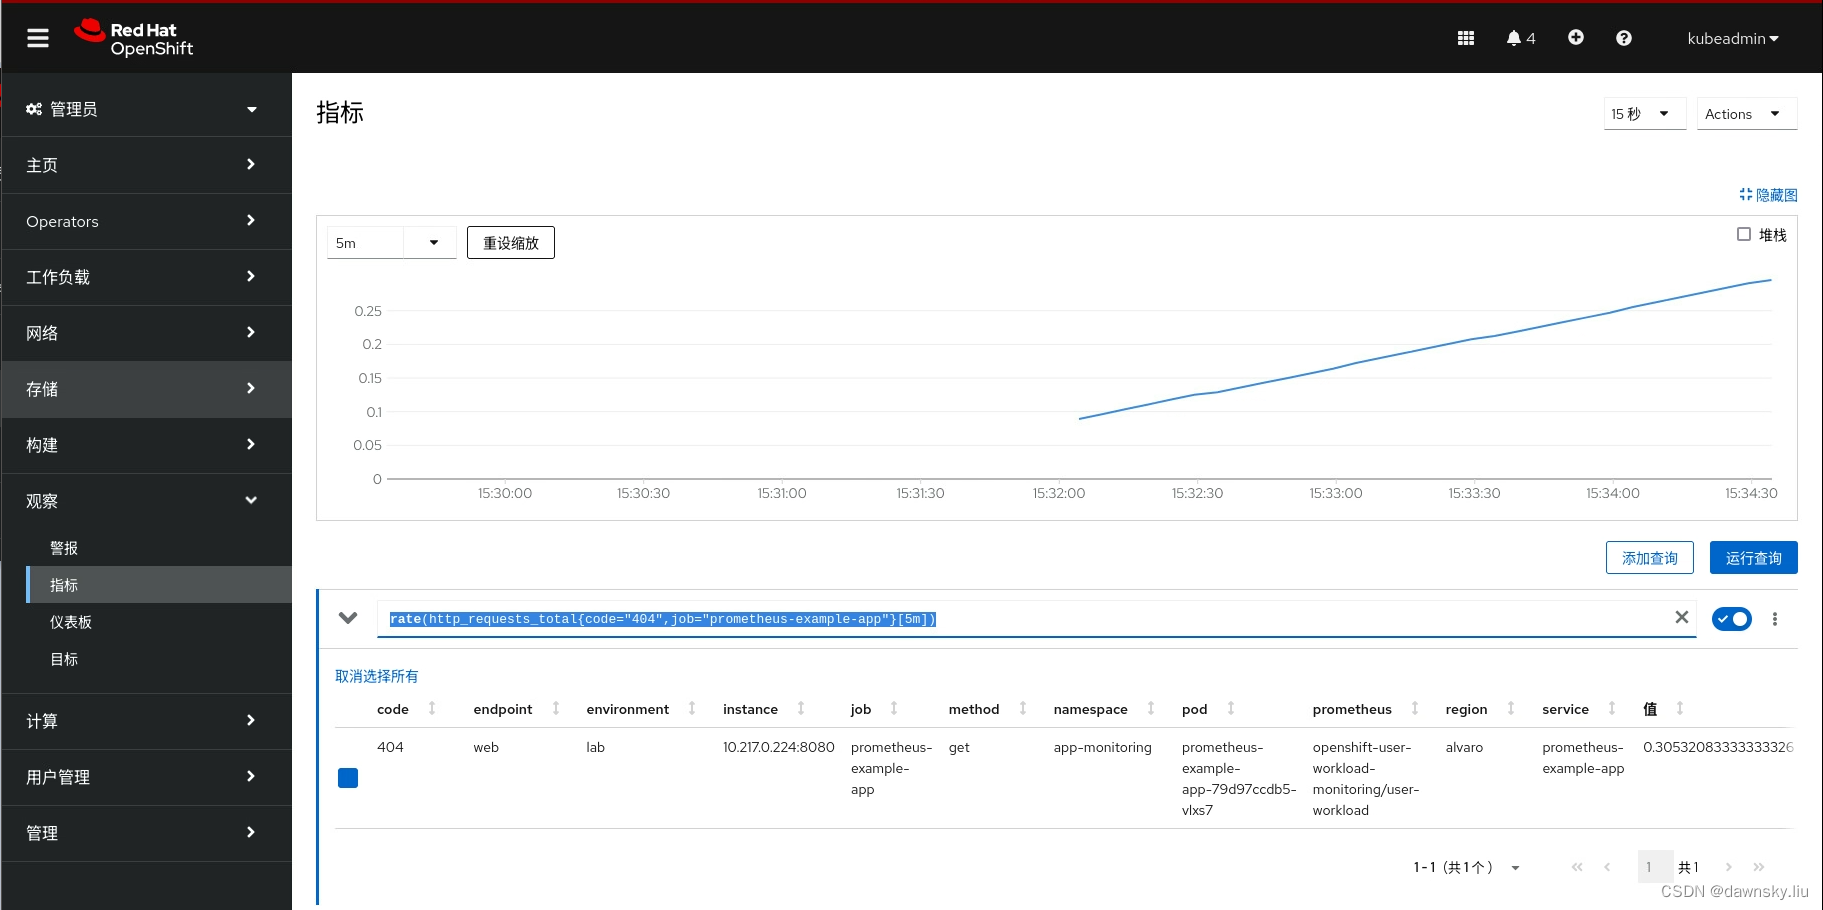
- 在 OpenShift 的 “指标” 页面中先将输入查询条件设为 “rate(http_requests_total{code=“404”,job=“prometheus-example-app”}[5m])”,然后点击 “运行查询”。再将时间设为 5m,并将页面刷新时间设置为 15秒。在等待一会儿后可以看到值已经超过 0.3。
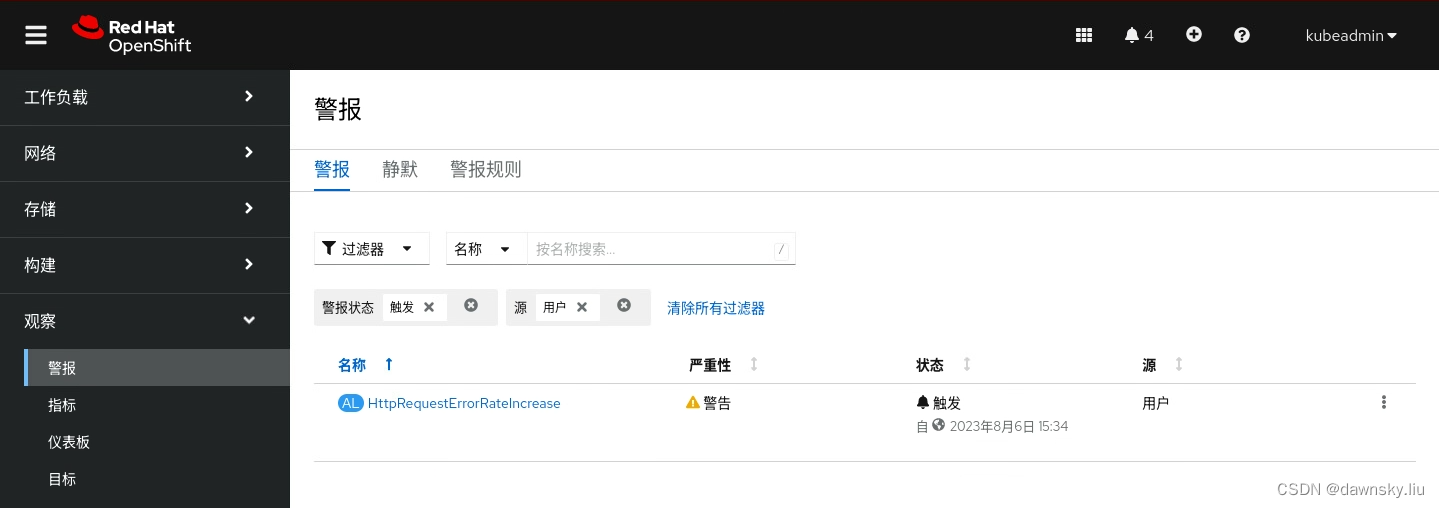
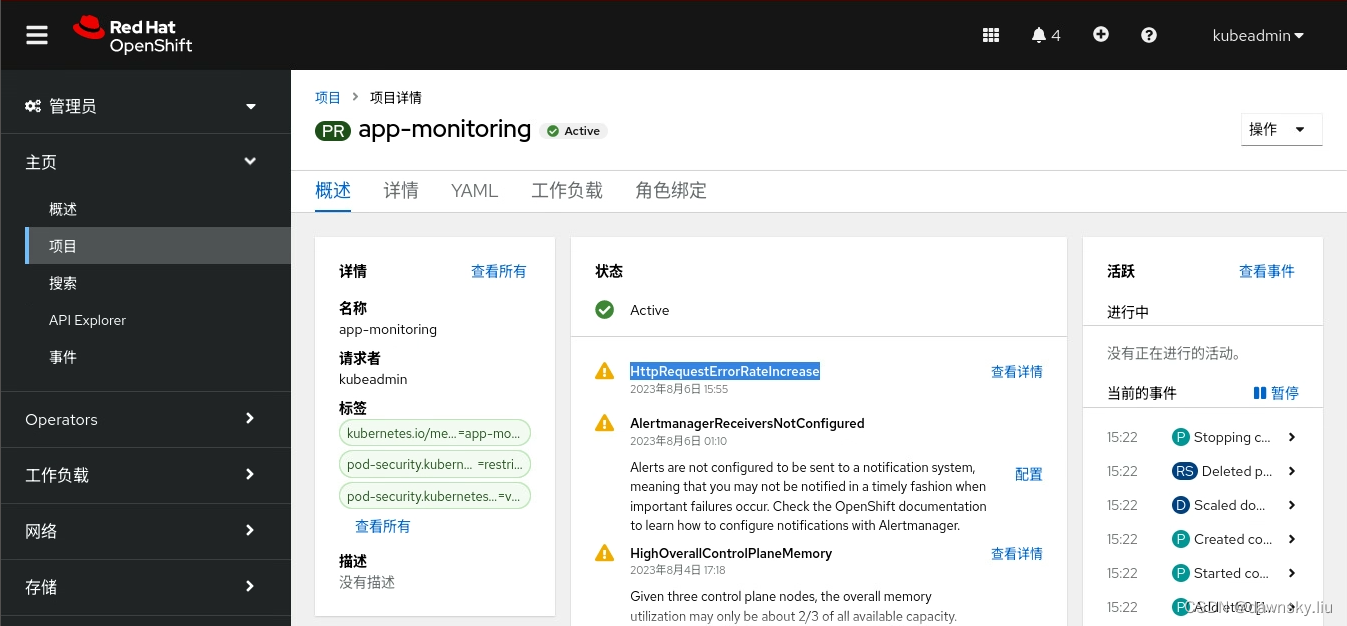
- 在 OpenShift 的 “报警” 页面中的 “过滤器” 中选中 “用户” ,确认已经被触发。
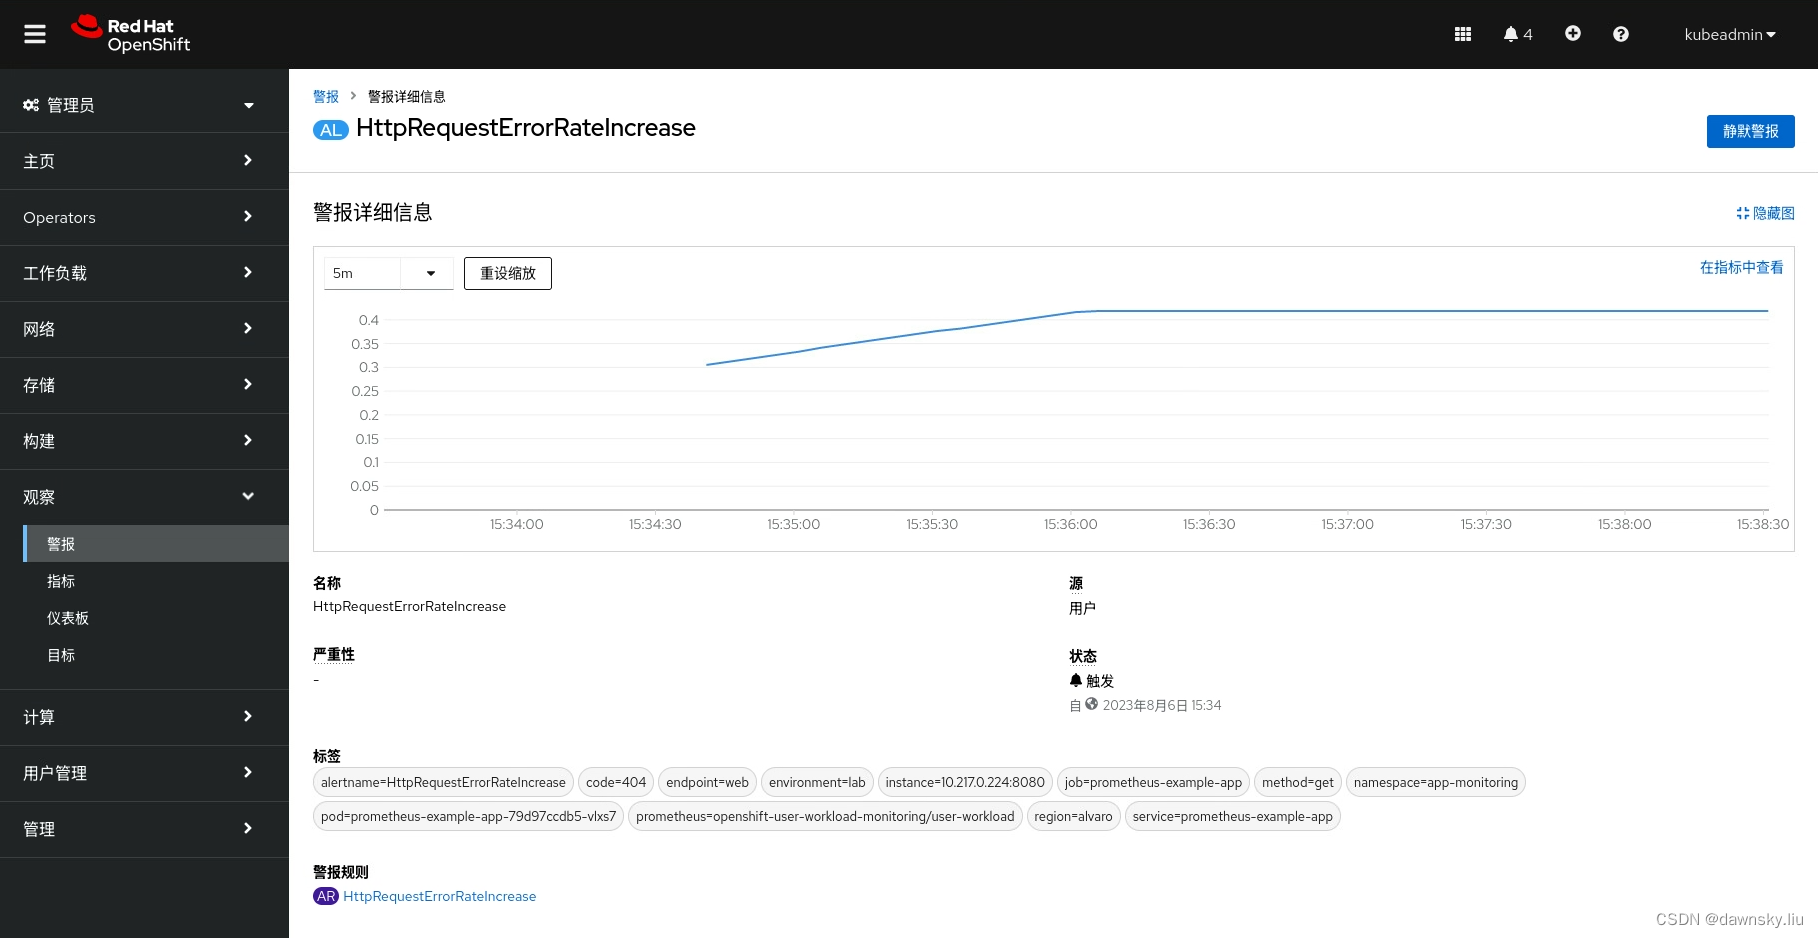
- 点击上图的 HttpRequestErrorRateIncrease,然后可以看到和步骤 7 类似的指标监控图。
- 另外,在 app-monitoring 项目中也可以看到 HttpRequestErrorRateIncrease 报警。
用 Grafana 监控应用
安装 Grafana 运行环境
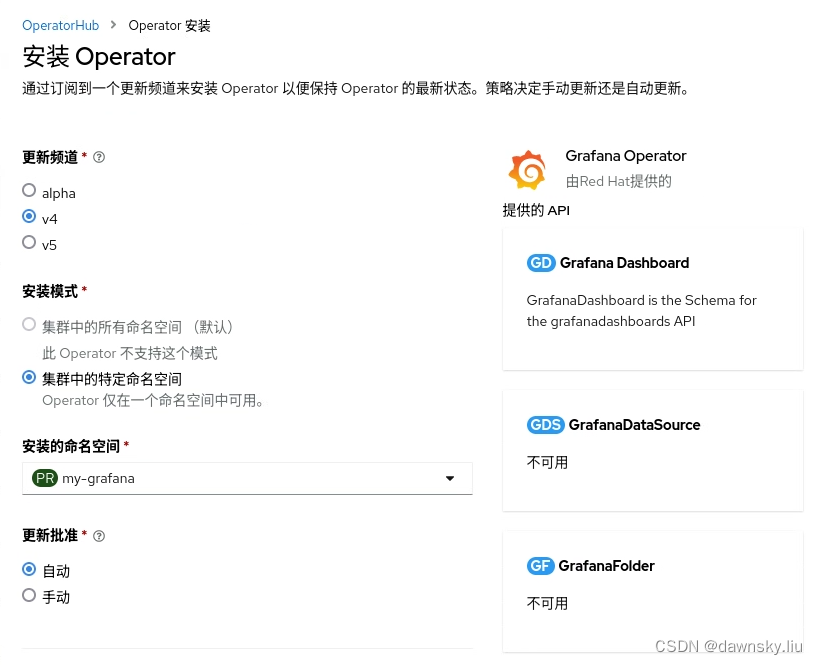
- 创建 my-grafana 项目,然后在其中安装 Grafana Operator v4 版本。
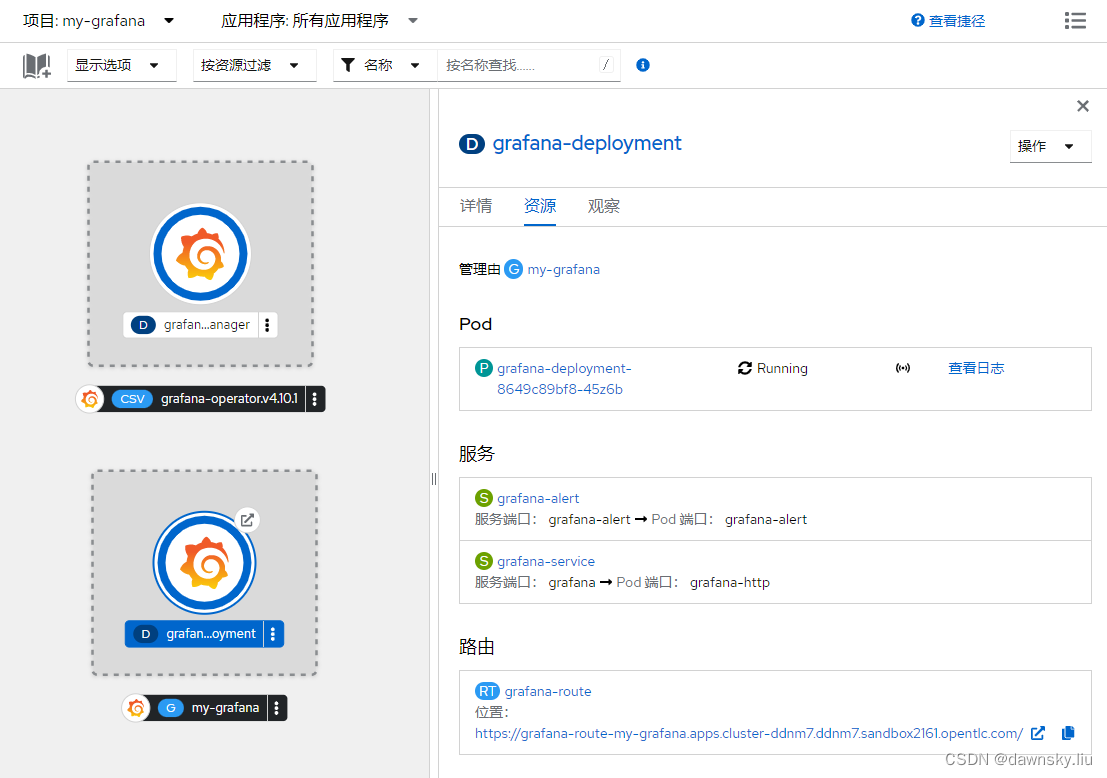
- 执行以下命令,创建一个名为 my-grafana 的 Grafana 实例。注意:以下 YAML 中的 dataStorage 使用了 OpenShift 缺省的存储类。
$ cat << EOF | oc apply -f -
apiVersion: integreatly.org/v1alpha1
kind: Grafana
metadata:
  name: my-grafana
  namespace: my-grafana
spec:
  config:
    security:
      admin_user: admin
      admin_password: my-password
  dataStorage:
    accessModes:
      - ReadWriteOnce
    size: 1Gi
  ingress:
    enabled: true
    tls:
      enabled: true
EOF
- 创建名为 grafana-view 的 clusterrolebinding,为所有命名空间的 grafana-serviceaccount 提供 cluster-monitoring-view 角色。
$ oc create clusterrolebinding grafana-view --clusterrole=cluster-monitoring-view --serviceaccount=my-grafana:grafana-serviceaccount
配置 Grafana 数据源
- 执行命令创建一个 GrafanaDataSource,其中使用了基于 grafana-serviceaccoun 的 token 来访问 Thanos Querier。
$ TOKEN=$(oc create token grafana-serviceaccount -n my-grafana)
$ cat << EOF | oc apply -f -
apiVersion: integreatly.org/v1alpha1
kind: GrafanaDataSource
metadata:
  name: prometheus
  namespace: my-grafana
spec:
  datasources:
    - basicAuthUser: internal
      access: proxy
      editable: true
      secureJsonData:
        httpHeaderValue1: >-
          Bearer ${TOKEN}
      name: Prometheus
      url: 'https://thanos-querier.openshift-monitoring.svc.cluster.local:9091'
      jsonData:
        httpHeaderName1: Authorization
        timeInterval: 5s
        tlsSkipVerify: true
      basicAuth: false
      isDefault: true
      version: 1
      type: prometheus
  name: test_name
EOF
- 访问 grafana-route 对应的 Grafana 页面,然后使用创建 my-grafana 实例时指定的用户和密码登录。
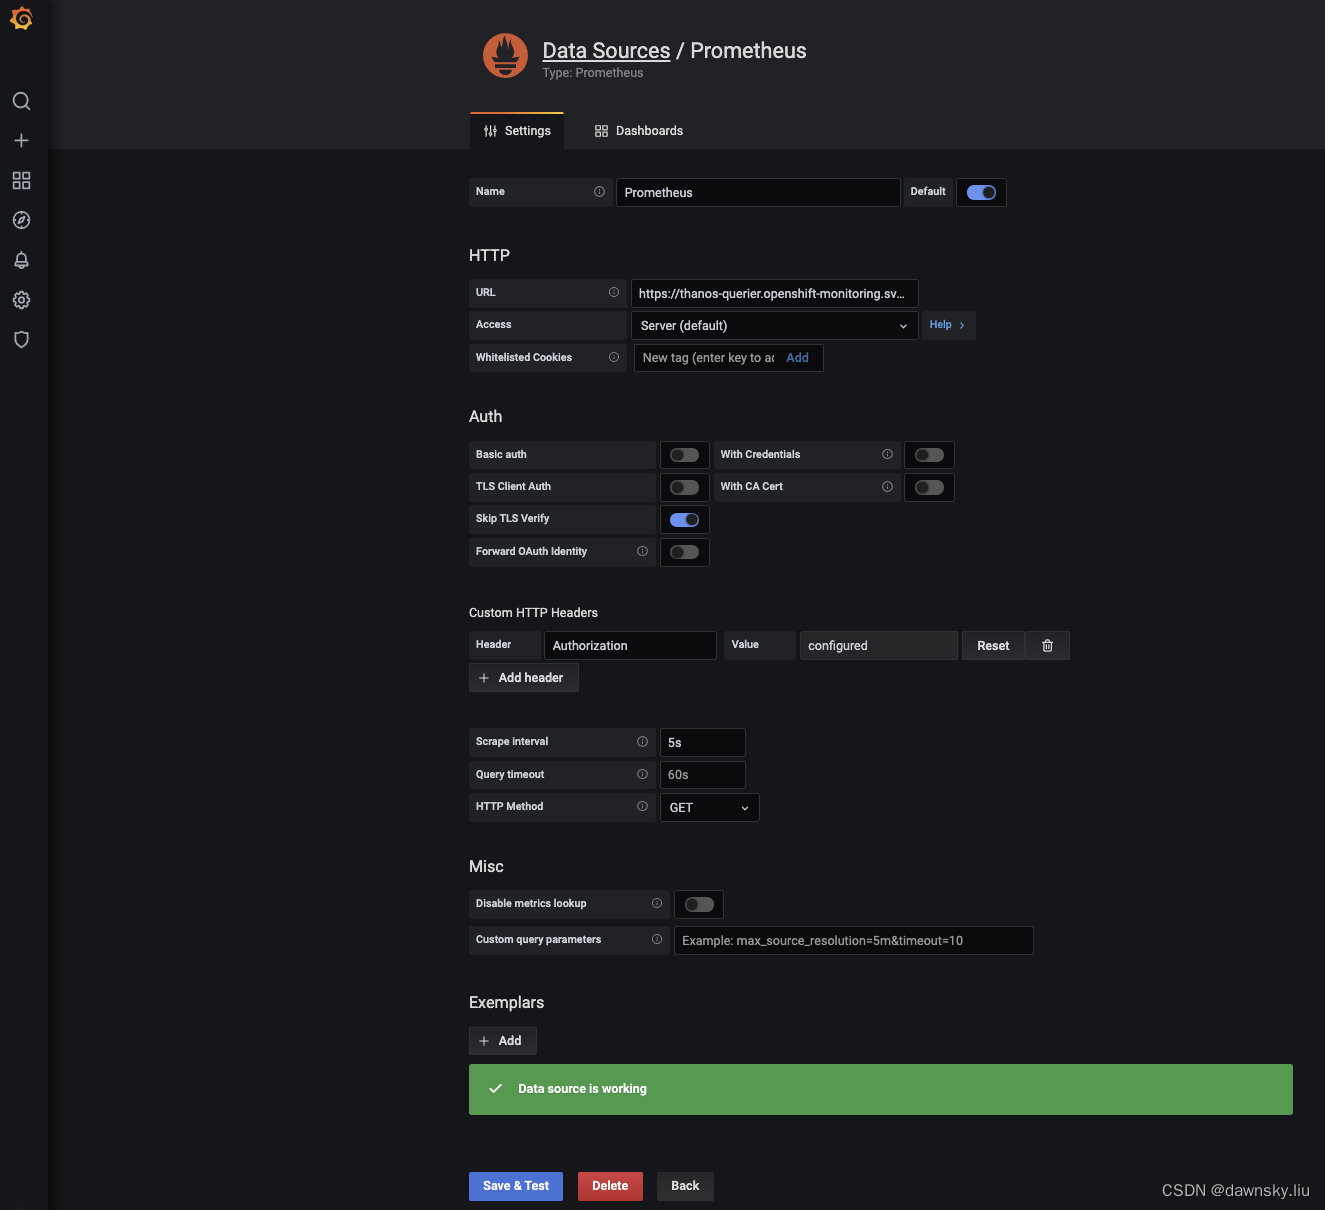
- 进入 Configuration 的 Data Sources 菜单,可以看到名为 Prometheus 的数据源,点击进入。
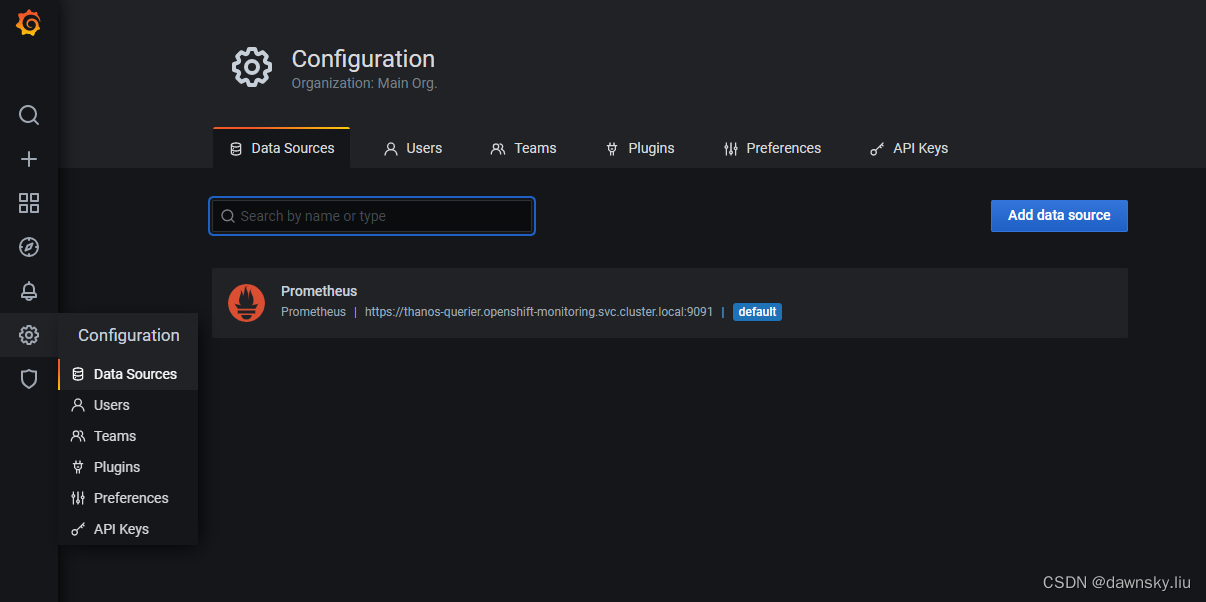
- 点击页面下方的 “ Save & Test”,确认显示 Data srouce is working。
定制监控 Dashboard
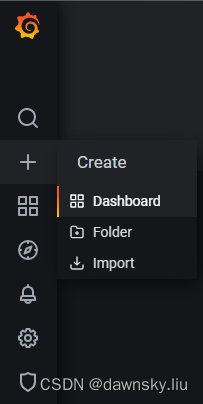
- 进入 Create 的 Dashboard 菜单。
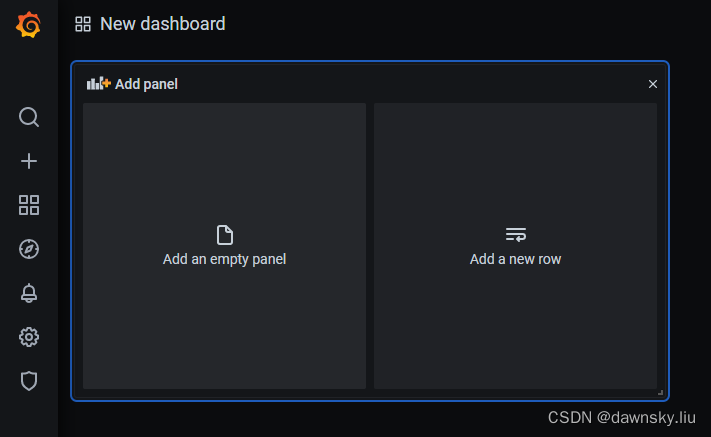
- 在 New dashboard 页面点击 Add an empty panel。
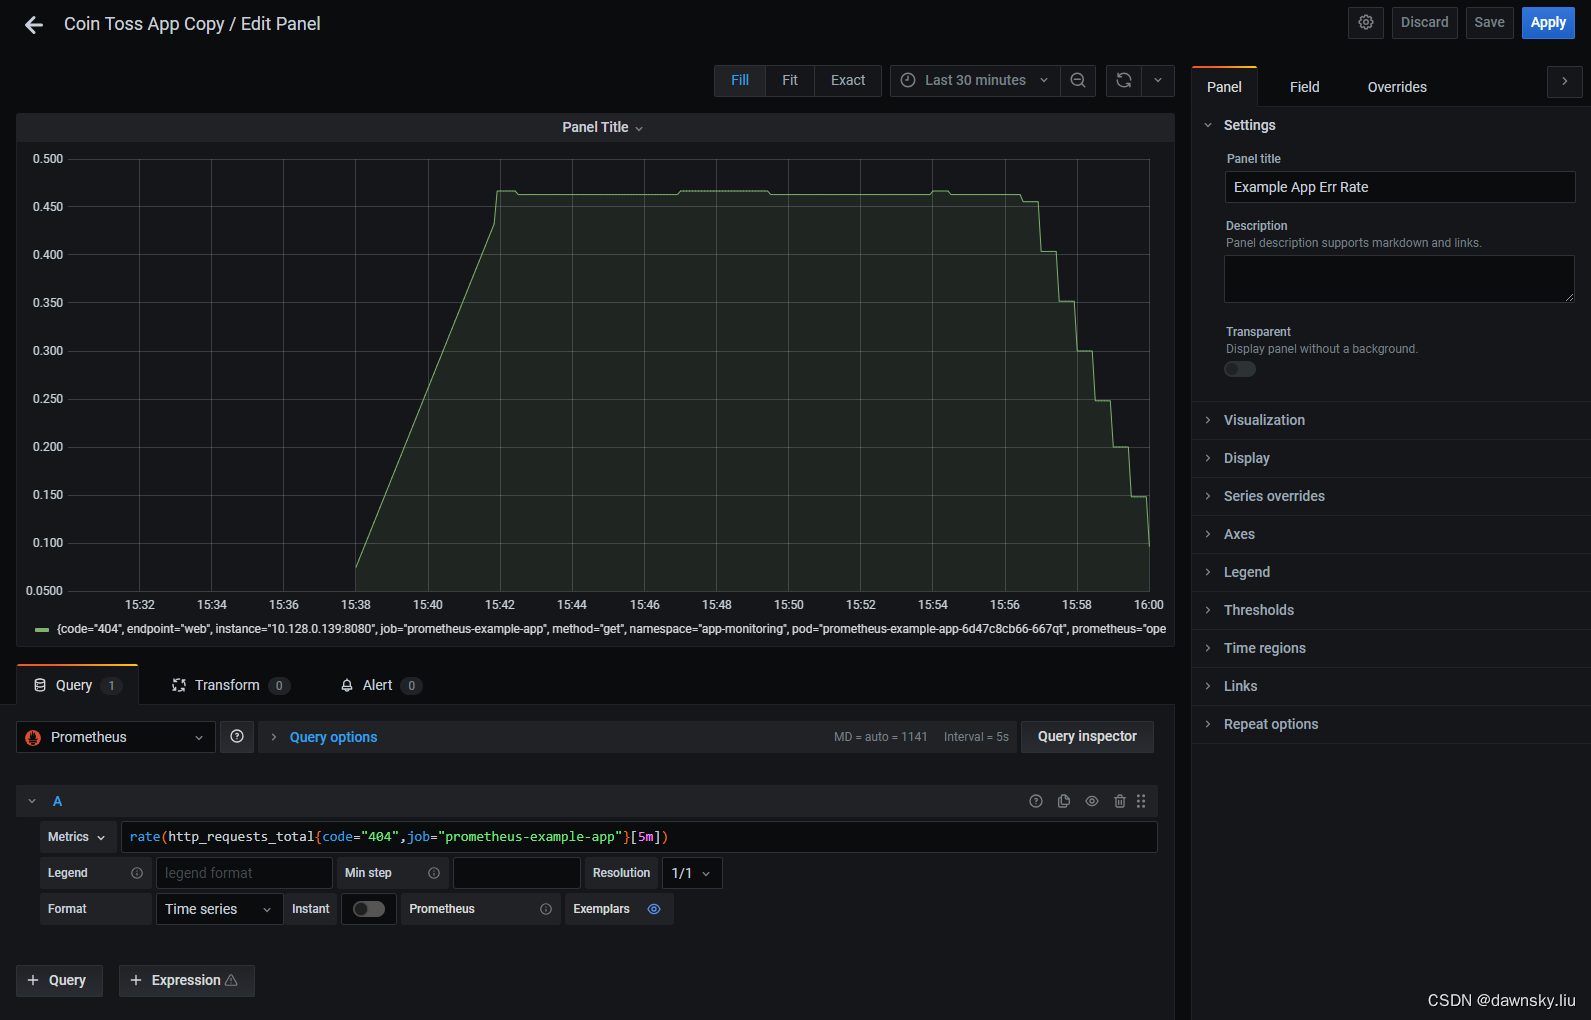
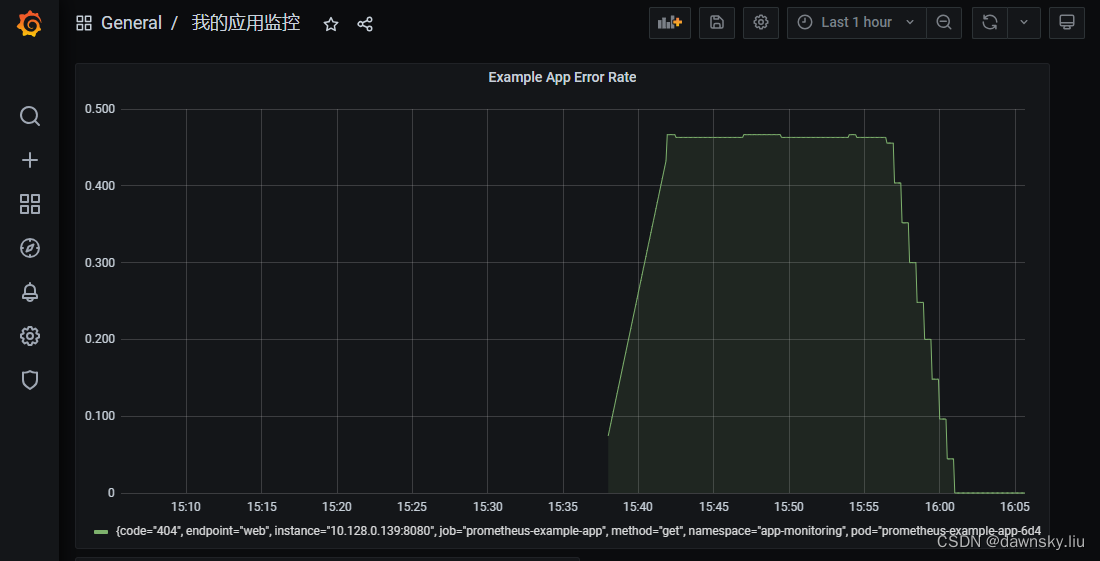
- 在下图中为 Metrics 提供以下内容,然后将 Panel title 设为 Example App Err Rate,最后点击 Apply 按钮。
rate(http_requests_total{code="404",job="prometheus-example-app"}[5m])
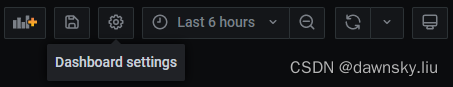
4. 在 Dashboard 页面点击右上方的 Dashboard settings 图标。
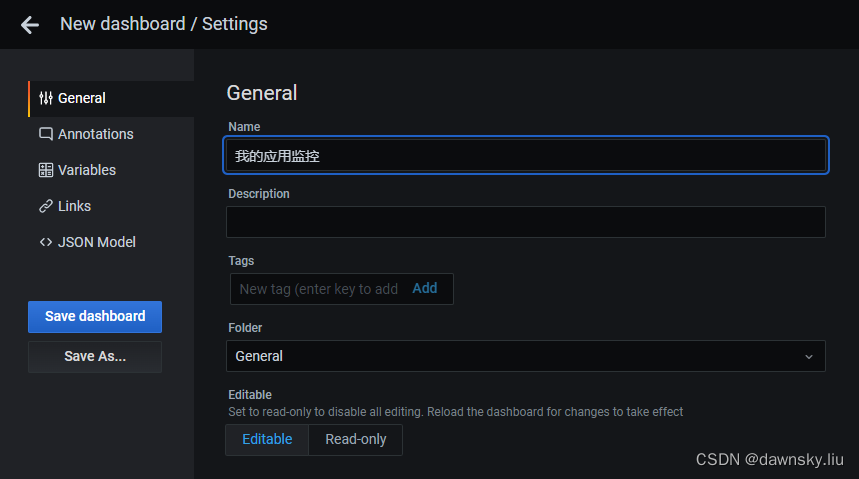
5. 设置 Name,然后保存。
6. 最后通过定制的 Dashboard 监控的应用指标如下图。
演示视频
演示视频
参考
https://github.com/k-srkw/openshift-monitoring-handson/blob/main/monitoring-handson.md
https://cloud.redhat.com/blog/your-guide-to-openshift-observability-part-1
https://access.redhat.com/solutions/5335491
https://access.redhat.com/documentation/en-us/openshift_container_platform/4.5/html/monitoring/monitoring-your-own-services
https://catalog.workshops.aws/aws-openshift-workshop/en-US/8-observability/2-metrics/5-app-dashboard
https://github.com/brancz/prometheus-example-app
https://developers.redhat.com/articles/2023/08/08/how-monitor-workloads-using-openshift-monitoring-stack#how_to_monitor_a_sample_application
https://shonpaz.medium.com/monitor-your-application-metrics-using-the-openshift-monitoring-stack-862cb4111906
https://github.com/OpenShiftDemos/openshift-ops-workshops/blob/ocp4-dev/workshop/content/monitoring-basics.adoc
https://github.com/pittar/openshift-user-workload-monitoring
https://github.com/alvarolop/quarkus-observability-app/blob/main/README.adoc
https://prometheus.io/docs/prometheus/latest/querying/basics/
https://github.com/alvarolop/quarkus-observability-app