
1.监控系统架构设计
| 角色 | 节点 | IP地址 |
| 监控端 | Prometheus ,Grafana,node_exporter ,Nginx | 47.120.35.251 |
| 被监控端1 | node_exporter | 47.113.177.189 |
| 被监控端2 | mysqld_exporter,node_exporter,Nginx,Nginx Exporter | 47.113.146.118 |
2.监控端部署相关组件
2.1 监控端部署Nginx
2.1.1 二进制安装脚本安装Nginx
#!/bin/bash
nginx -V >> /dev/null 2>&1
if [ $? -ne 0 ];then
    # 下载Nginx二进制软件包
    find / -name "nginx-1.22.0.tar.gz" >> /dev/null 2>&1
    if [ $? -ne 0 ];then
         wget http://nginx.org/download/nginx-1.22.0.tar.gz
    fi
 # 编译安装Nginx
 # 下载相关依赖包
    yum -y install gcc pcre pcre-devel zlib zlib-devel openssl openssl-devel
    cd /usr/local/
    find / -name nginx-1.22.0.tar.gz -type f -print | xargs tar -xzf
    # 这个命令的作用是在整个文件系统中查找nginx-1.22.0.tar.gz的文件,并将其解压缩到/usr/local/目录下
    # 其中 -type f选项用于限制查找的结果只包含文件,而不包括目录
    # -print0选项用于在查找结果之间使用null字符分割符,以避免文件名中包含空格等特殊字符导致的问题
    # xargs命令的-0选项用于告诉他们使用null字符作为分隔符
    cd
    groupadd nginx
    useradd -g nginx -s /bin/nologin nginx
    mkdir -p /var/run/nginx/
    mkdir -p /data/log/nginx/
    mkdir -p /usr/local/run/
    mkdir -p /var/temp/nginx/
    mkdir -p /var/temp/nginx/
    mkdir -p /path/to/
    mkdir -p /var/run/nginx/sbin/
    cd /usr/local/nginx-1.22.0/
    ./configure  --prefix=/usr/local/nginx  --pid-path=/var/run/nginx/nginx.pid  --lock-path=/var/lock/nginx.lock  --error-log-path=/data/log/nginx/error.log  --http-log-path=/data/log/nginx/access.log  --with-http_gzip_static_module  --http-client-body-temp-path=/var/temp/nginx/client  --http-proxy-temp-path=/var/temp/nginx/proxy  --http-fastcgi-temp-path=/var/temp/nginx/fastcgi  --http-uwsgi-temp-path=/var/temp/nginx/uwsgi  --http-scgi-temp-path=/var/temp/nginx --with-http_stub_status_module --with-http_ssl_module
    make && make install
    # 创建环境变量
    echo "export PATH=\"/usr/local/nginx/sbin:\$PATH\"" >> /etc/profile
    # 加载环境变量
    source /etc/profile
    cd /usr/local/nginx/sbin/
    # 启动nginx
    ./nginx -c /usr/local/nginx/conf/nginx.conf
    ./nginx -s reload
    # 制作软链接
    ln -s /usr/local/nginx/sbin/nginx /usr/bin/nginx
    # 检查是否安装成功
    if [ ! -f /usr/sbin/lsof ];then
        yum -y install lsof
    fi
    lsof -i:80 | grep "nginx" >> /dev/null 2>&1
    if [ $? -ne 0 ];then
        echo "----------Nginx未成功安装,请查看详细报错信息--------------"
    else
        echo "-------------------Nginx成功安装-------------------"
        rm -rf /usr/local/nginx-1.22.0/
    fi
fi
2.1.2 修改Nginx.conf
user  nginx;
worker_processes  auto;
worker_cpu_affinity auto; # CPU亲和设置
error_log  /data/log/nginx/error.log;
events {
    use epoll; # 配置事件驱动模型
    worker_connections  65535;
}


http {
    include       mime.types;
    default_type  application/octet-stream;

    log_format  main  '$remote_addr - $remote_user [$time_local] "$request" '
                      '$status $body_bytes_sent "$http_referer" '
                     '"$http_user_agent" "$http_x_forwarded_for"';
    sendfile        on;

    keepalive_timeout  65;

    gzip  on;#表示开启压缩功能
    gzip_min_length 1K;#表示允许压缩的页面最小字节数
    gzip_buffers 4 32k;#压缩缓冲区大小
    gzip_http_version 1.1;#压缩版本
    gzip_comp_level 6;#压缩比率,一般选择4~6
    gzip_types text/css text/xml application/javascript;#指定压缩类型
    gzip_vary on;#vary header支持

    include ./conf.d/*.conf; #表示引用外部conf配置
}
2.2 监控端部署Prometheus
2.2.1 下载相关软件包
[root@localhost ~]#wget https://github.com/prometheus/prometheus/releases/download/v2.35.0/prometheus-2.35.0.linux-amd64.tar.gz

[root@localhost ~]#ls -l prometheus-2.35.0.linux-amd64.tar.gz
-rw-r--r-- 1 root root 80620181 Apr 21 10:07 prometheus-2.35.0.linux-amd64.tar.gz

[root@localhost ~]#tar xf prometheus-2.35.0.linux-amd64.tar.gz

[root@localhost ~]#ln -s /root/prometheus-2.35.0.linux-amd64 /usr/local/prometheus

[root@localhost ~]#cd /usr/local/prometheus

[root@localhost /usr/local/prometheus]#ls
console_libraries  consoles  LICENSE  NOTICE  prometheus  prometheus.yml  promtool

[root@localhost /usr/local/prometheus]#mkdir bin conf data

[root@localhost /usr/local/prometheus]#mv prometheus promtool bin/

[root@localhost /usr/local/prometheus]#mv prometheus.yml conf/

[root@localhost /usr/local/prometheus]#useradd -r -s /sbin/nologin prometheus

[root@localhost /usr/local/prometheus]#chown -R prometheus.prometheus /usr/local/prometheus/

[root@localhost /usr/local/prometheus]#cd

[root@localhost ~]#vim /etc/profile.d/prometheus.sh
export PROMETHEUS_HOME=/usr/local/prometheus
export PATH=${PROMETHEUS_HOME}/bin:$PATH

[root@localhost ~]#source /etc/profile.d/prometheus.sh

#查看配置文件,默认可不修改
[root@localhost ~]#grep -Ev "^ *#|^$" /usr/local/prometheus/conf/prometheus.yml
global:
  scrape_interval: 15s # Set the scrape interval to every 15 seconds. Default is every 1 minute.
  evaluation_interval: 15s # Evaluate rules every 15 seconds. The default is every 1 minute.
alerting:
  alertmanagers:
    - static_configs:
        - targets:
rule_files:
scrape_configs:
  - job_name: "prometheus"
    static_configs:
      - targets: ["localhost:9090"]

#属性解析:主要是global和 scrape_configs 两部分的配置,在这里目前我们保持默认即可

#检查配置文件是否正确
[root@localhost ~]#promtool check config /usr/local/prometheus/conf/prometheus.yml
Checking /usr/local/prometheus/conf/prometheus.yml
 SUCCESS: /usr/local/prometheus/conf/prometheus.yml is valid prometheus config file syntax
1.2.2 将Prometheus添加至System管理
[root@localhost system]# cd /usr/lib/systemd/system
[root@localhost system]# cat prometheus.service
[Unit]
Description=Prometheus Server
Documentation=https://prometheus.io/docs/introduction/overview/
After=network.target

[Service]
Restart=on-failure
User=root
WorkingDirectory=/usr/local/prometheus/
ExecStart=/usr/local/prometheus/bin/prometheus --config.file=/usr/local/prometheus/conf/prometheus.yml
ExecReload=/bin/kill -HUP $MAINPID
LimitNOFILE=65535
[Install]
WantedBy=multi-user.target
[root@localhost system]# systemctl daemon-reload
[root@localhost system]# systemctl enable --now prometheus.service
1.2.3 将Prometheus添加到Nginx进行管理
[root@localhost ~]# mkdir -p /data/log/nginx/promethus
[root@localhost ~]# mkdir -p /usr/local/nginx/conf/conf.d
[root@localhost ~]# vim /usr/local/nginx/conf/conf.d/promethues
server {
  listen 80;
  server_name localhost;
  root /usr/local/nginx/html;
  index index.html index.htm;
  # 开启压缩
  gzip on;

  location / {
  # 因为存在1.6M的js,需要设置的nginx的缓存配置调大
     proxy_buffering on;
     proxy_buffer_size 4k;
     proxy_buffers 8 2M;
     proxy_busy_buffers_size 2M;
     proxy_pass http://47.120.35.251:9090;
    # 配置所有的CSS和Js文件转发到代理服务器上
    location ~* \.(css|js)$ {
      proxy_pass http://47.120.35.251:9090;
      proxy_set_header Host $host;
      proxy_set_header X-Real-IP $remote_addr;
      proxy_set_header X-Forwarded-For $proxy_add_x_forwarded_for;
    }
  }

  access_log /data/log/nginx/promethus/access.log;
  error_log /data/log/nginx/promethus/error.log;
 }
2.3 监控端部署node_exporter
2.3.1 下载相关软件包
[root@localhost ~]# wget https://github.com/prometheus/node_exporter/releases/download/v0.16.0/node_exporter-0.16.0.linux-amd64.tar.gz
[root@localhost ~]# tar xvfz node_exporter-0.16.0.linux-amd64.tar.gz -C /usr/local/
[root@localhost ~]# mv /usr/local/node_exporter-0.16.0.linux-amd64/ /usr/local/node_exporter/
[root@localhost ~]# cd /usr/local/node_exporter/
[root@localhost node_exporter]#./node_exporter >> /dev/null 2>&1 &
2.3.2 将node_exporter添加到System中管理
[root@localhost system]# cd /usr/lib/systemd/system
[root@localhost system]# cat node_exporter.service
[Unit]
Description=node_exporter
After=network.target

[Service]
Type=simple
User=root
ExecStart=/usr/local/node_exporter/node_exporter
Restart=on-failure

[Install]
WantedBy=mutil-user.target

[root@localhost system]# systemctl daemon-reload

# 注意,使用Systemctl启动时一定要确保端口9100未开放或node_exporter进程已停止
2.3.3 将node_export添加到Nginx中进行管理
# 此段代码在Prometheus.conf文件的server块下
location /metrics/ {
        root html;
        add_header 'Access-Control-Allow-Origin' '*';
        add_header Access-Control-Allow-Methods GET,POST,OPTIONS,DELETE;
        add_header  'Access-Control-Allow-Headers' 'userId,DNT,X-CustomHeader,Keep-Alive,User-Agent,X-Requested-With,If-Modified-Since,Cache-Control,Content-Type';
        proxy_pass http://47.120.35.251:9100/metrics;
        proxy_set_header   Host $host;
  }
2.4 监控端部署Grafana
2.4.1 下载相关软件包
`Standalone Linux Binaries 内核
wget https://dl.grafana.com/enterprise/release/grafana-enterprise-9.5.3.linux-amd64.tar.gz
tar -zxvf grafana-enterprise-9.5.3.linux-amd64.tar.gz

`Ubuntu and Debian 内核
apt-get install -y adduser libfontconfig1
wget https://dl.grafana.com/enterprise/release/grafana-enterprise_9.5.3_amd64.deb
dpkg -i grafana-enterprise_9.5.3_amd64.deb

`RedHat/Centos 内核
yum install -y https://dl.grafana.com/enterprise/release/grafana-enterprise-9.5.3-1.x86_64.rpm
yum install grafana-enterprise-8.3.3-1.x86_64.rpm -y				# 安装Grafana
systemctl start grafana-server && systemctl enable grafana-server	# 启动并设为开机自启

`OpenSUSE and SUSE 内核
wget https://dl.grafana.com/enterprise/release/grafana-enterprise-9.5.3-1.x86_64.rpm
rpm -Uvh grafana-enterprise-9.5.3-1.x86_64.rpm
2.4.2 启动Grafana
Grafana默认端口是3000,启动Grafana后浏览器访问http://IP地址:3000,默认账号密码都是admin,首次登录会让修改密码
2.4.3 使用Nginx管理Granfana
# 此配置文件依旧是prometheus.conf文件的Server块下
…………
   location /grafana/ {
        root   html;
        #index  index.html index.htm;
        add_header 'Access-Control-Allow-Origin' '*';
        add_header Access-Control-Allow-Methods GET,POST,OPTIONS,DELETE;
        add_header 'Access-Control-Allow-Headers' 'userId,DNT,X-CustomHeader,Keep-Alive,User-Agent,X-Requested-With,If-Modified-Since,Cache-Control,Content-Type';
        proxy_pass http://47.120.35.251:3000/;#此处填写你需要设置的的域名
        # rewrite ^/grafana/(.*) /$1 break;
        proxy_set_header   Host $host;
        location ^~ /grafana/api/live {
          # 这是grafana的webSocket连接
          proxy_http_version 1.1;
          proxy_set_header Upgrade $http_upgrade;
          proxy_set_header Connection "Upgrade";
          proxy_set_header Host $http_host;
          proxy_pass http://47.120.35.251:3000/grafana/api/live;
    }
  }
……
Grafana配置反向代理一定要修改grafana.ini这个配置文件
[root@localhost ~]# vim /etc/grafana/grafana.ini
……
`The full public facing url you use in browser, used for redirects and emails
`-----您在浏览器中使用的完整面向公众的url,用于重定向和电子邮件
`If you use reverse proxy and sub path specify full url (with sub path)
`-----如果您使用反向代理和子路径,请指定完整url(带有子路径)
root_url = %(protocol)s://%(domain)s:%(http_port)s/grafana
`Serve Grafana from subpath specified in `root_url` setting. By default it is set to `false` for compatibility reasons.
`-----从“root_url”设置中指定的子路径为Grafana提供服务。默认情况下,出于兼容性原因,它被设置为“假”。
serve_from_sub_path = ture

[root@localhost ~]# systemctl restart grafana-server.service
[root@localhost ~]# systemctl status grafana-server.service
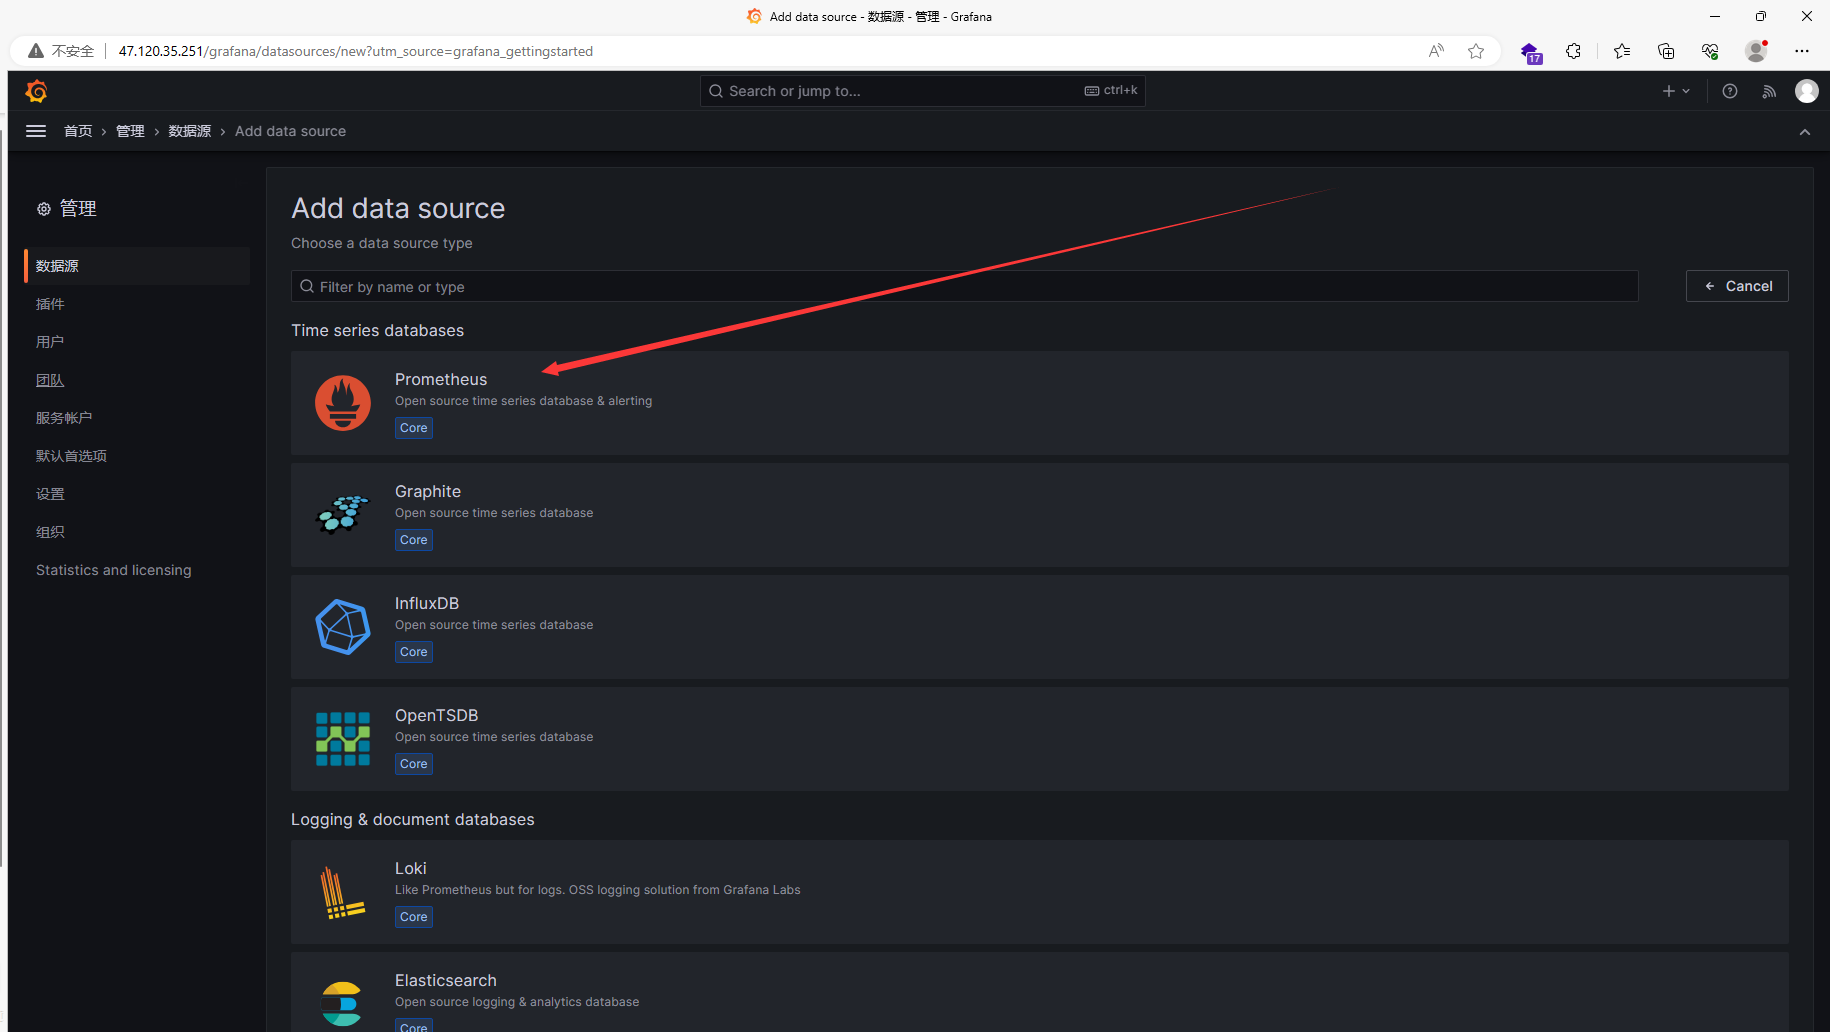
2.4.4 添加数据源
登录成功后点击设置图标,默认进入数据源管理页面,点击【ADD data source】,选择数据源Prometheus,填写URL地址,其它项都可以默认,点击【Save&test】


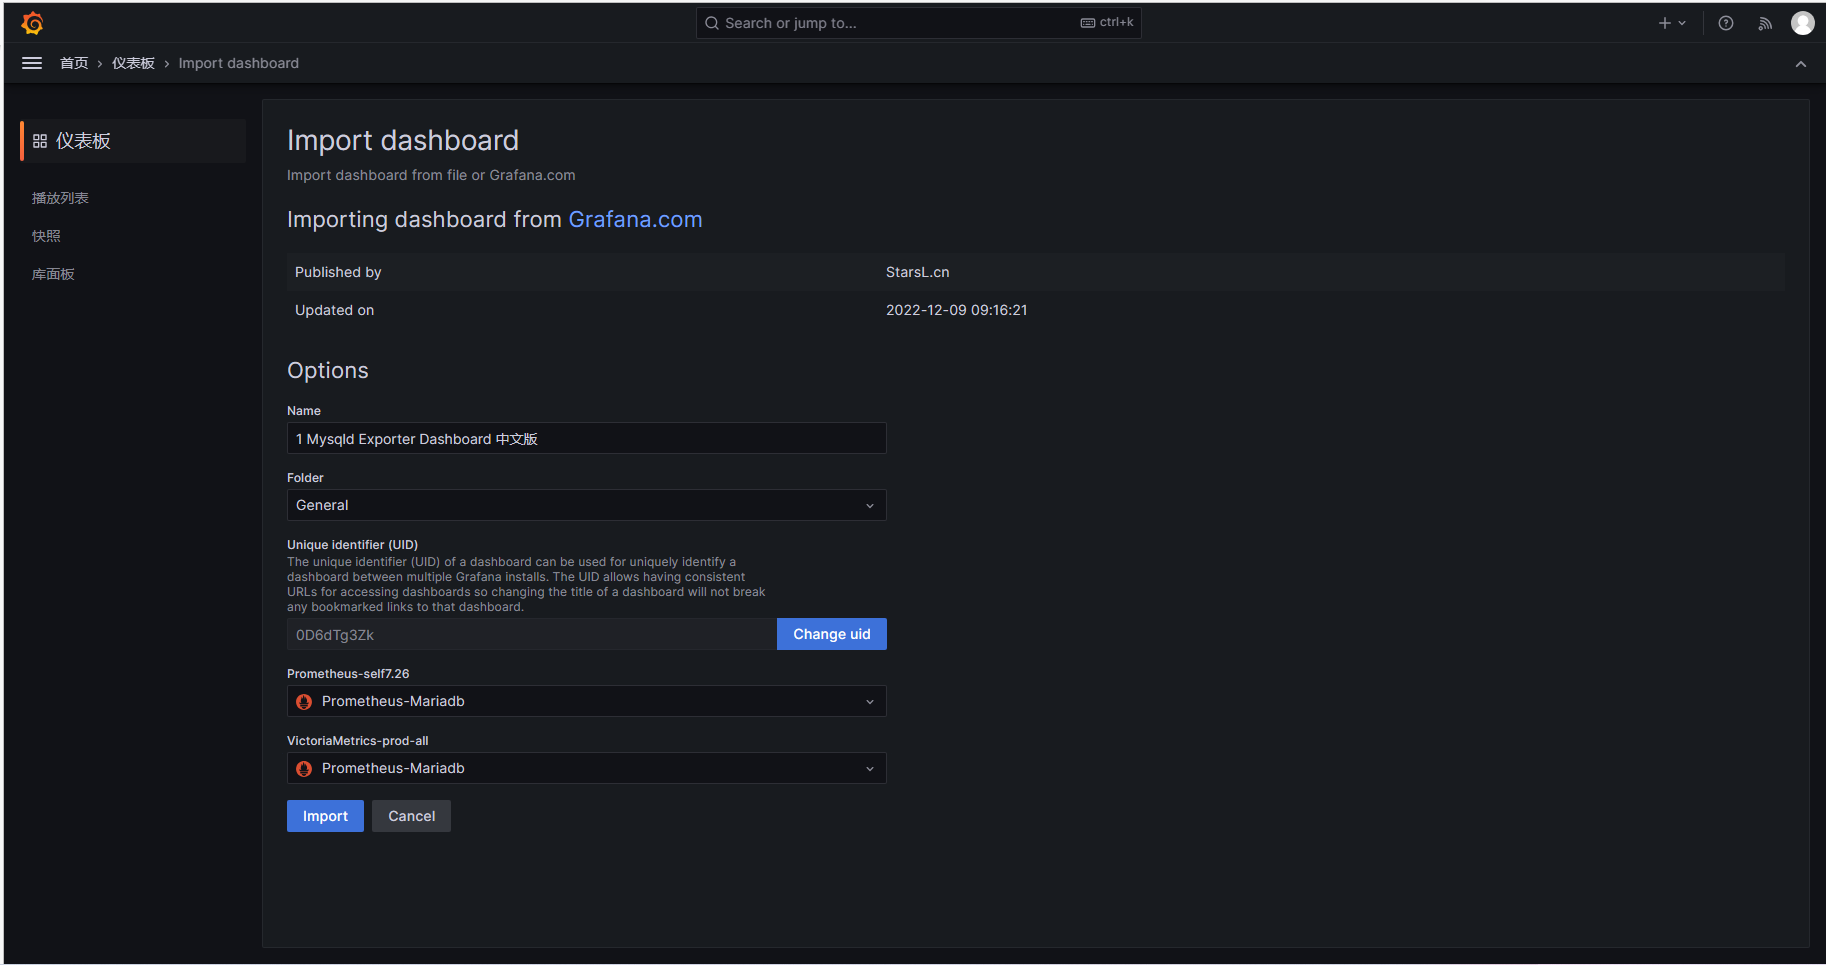
2.4.5 配置仪表盘
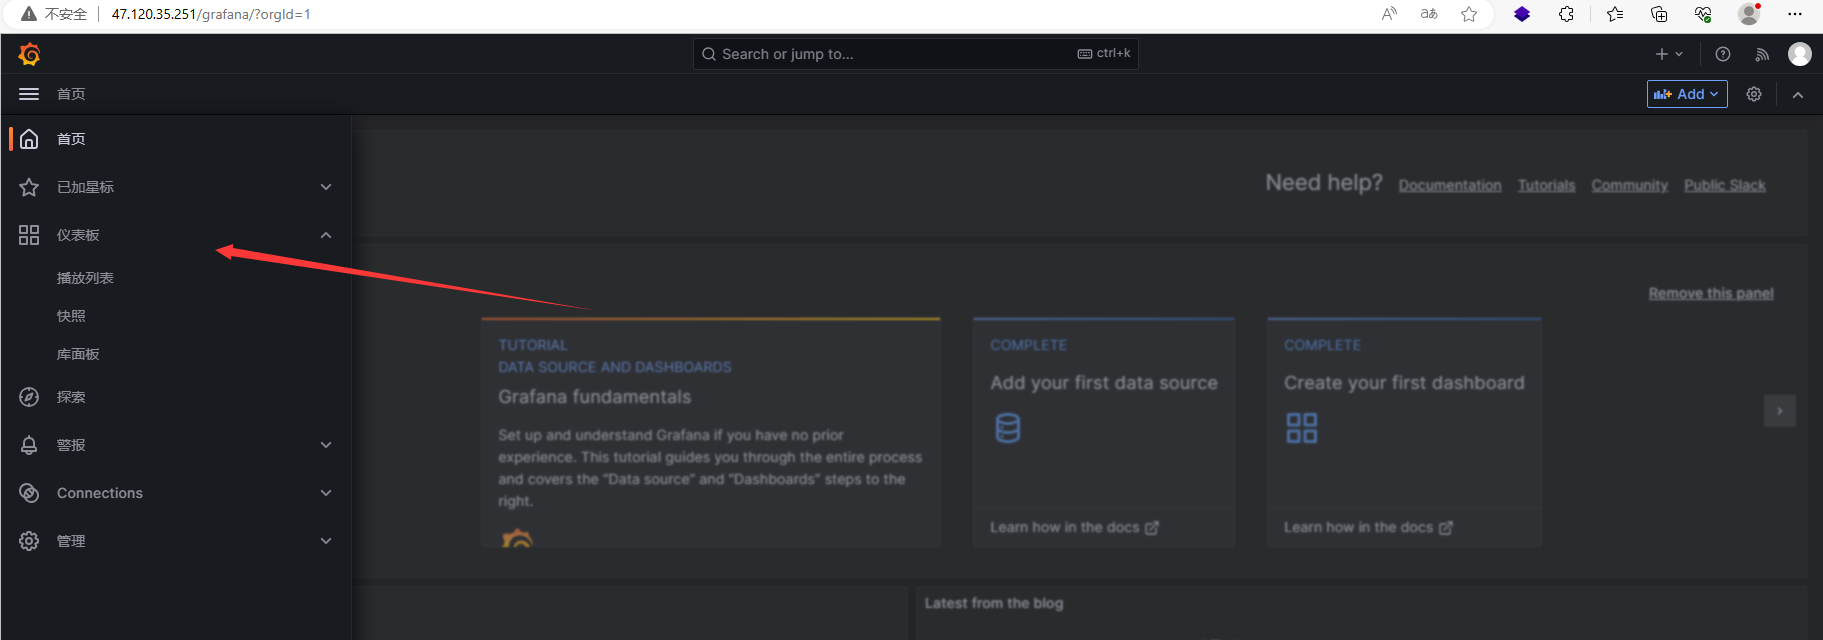
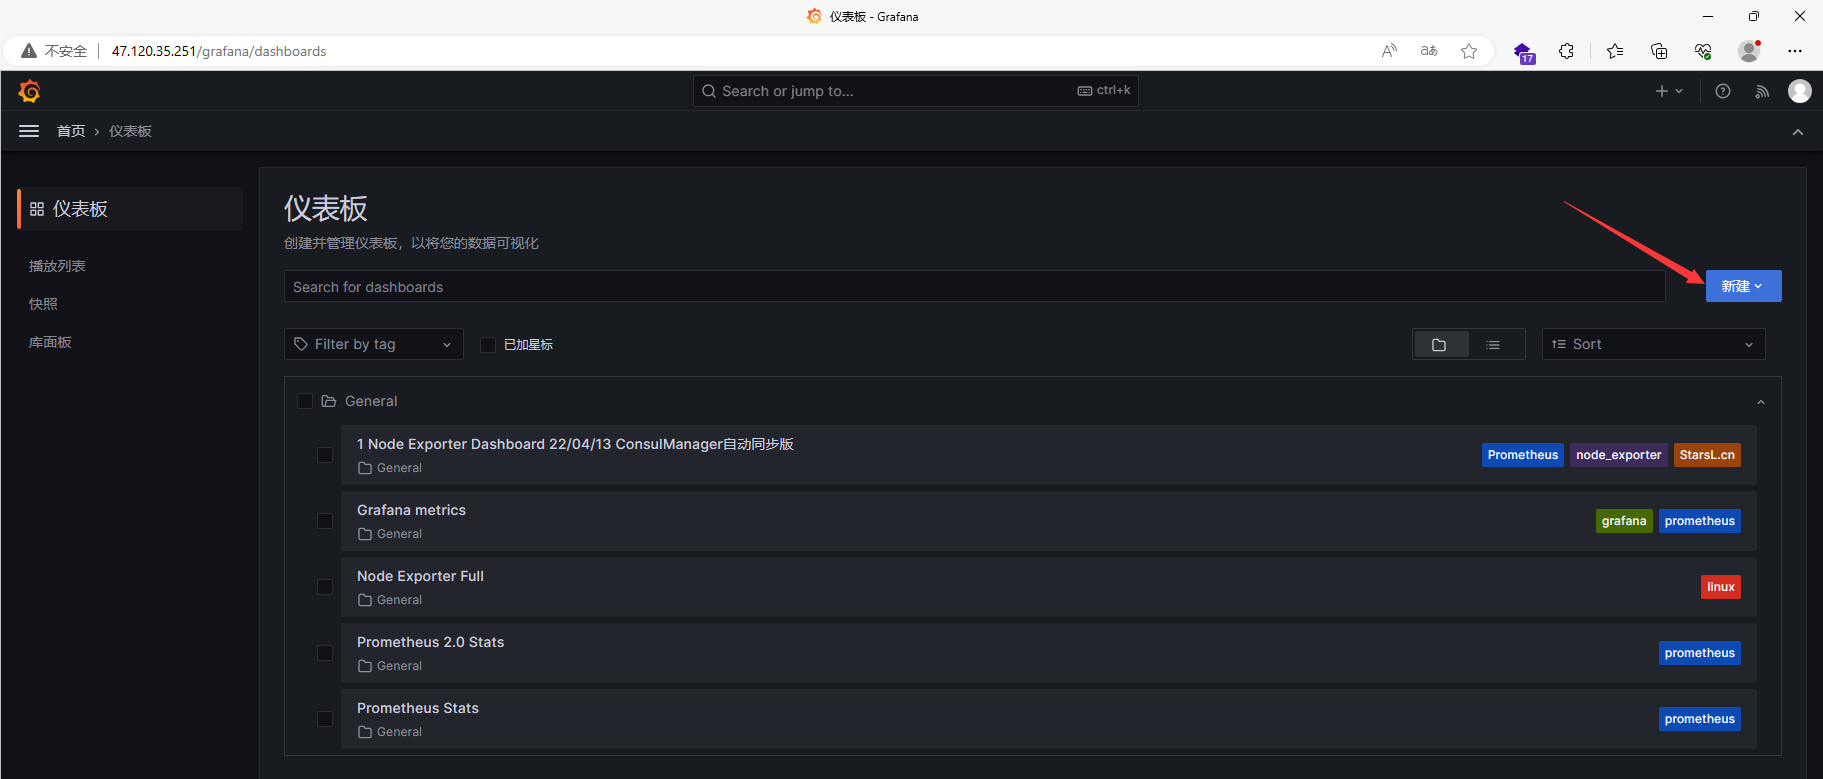
可以自制仪表盘也可以导入开源的仪表盘

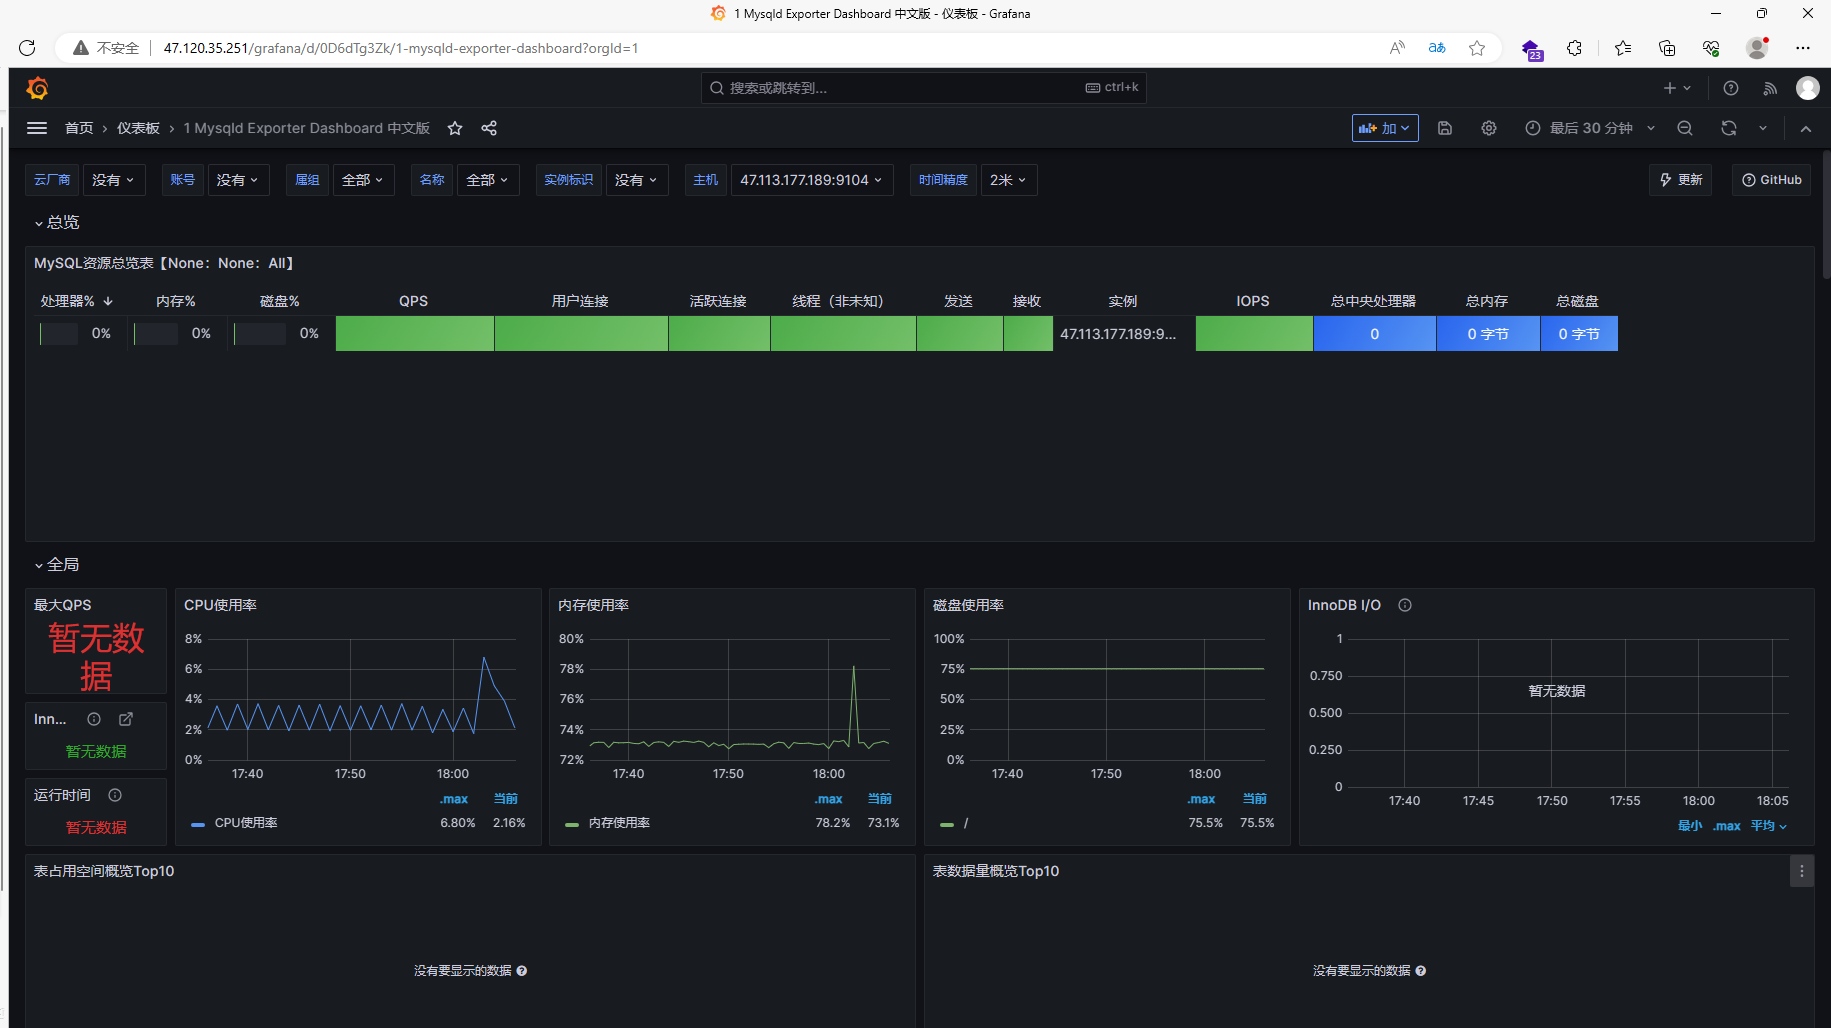
这里有数据的原因是我已经提前配置好了被监控节点
2.4.6 配置反向代理遇到的问题

出现此问题的原因是:Grafana不支持多个域,需要智能代理,不支持跨域
需要配置:
location / {
 proxy_set_header Host localhost:3000;
 proxy_set_header Origin https://localhost:3000;
 proxy_pass https://localhost:3000;
}
3.被监控端部署相关组件
3.1 被监控端部署node_exporter
3.1.1 下载相关软件包
[root@localhost ~]# wget https://github.com/prometheus/node_exporter/releases/download/v0.16.0/node_exporter-0.16.0.linux-amd64.tar.gz
[root@localhost ~]# tar xvfz node_exporter-0.16.0.linux-amd64.tar.gz -C /usr/local/
[root@localhost ~]# mv /usr/local/node_exporter-0.16.0.linux-amd64/ /usr/local/node_exporter/
[root@localhost ~]# cd /usr/local/node_exporter/
[root@localhost node_exporter]#./node_exporter >> /dev/null 2>&1 &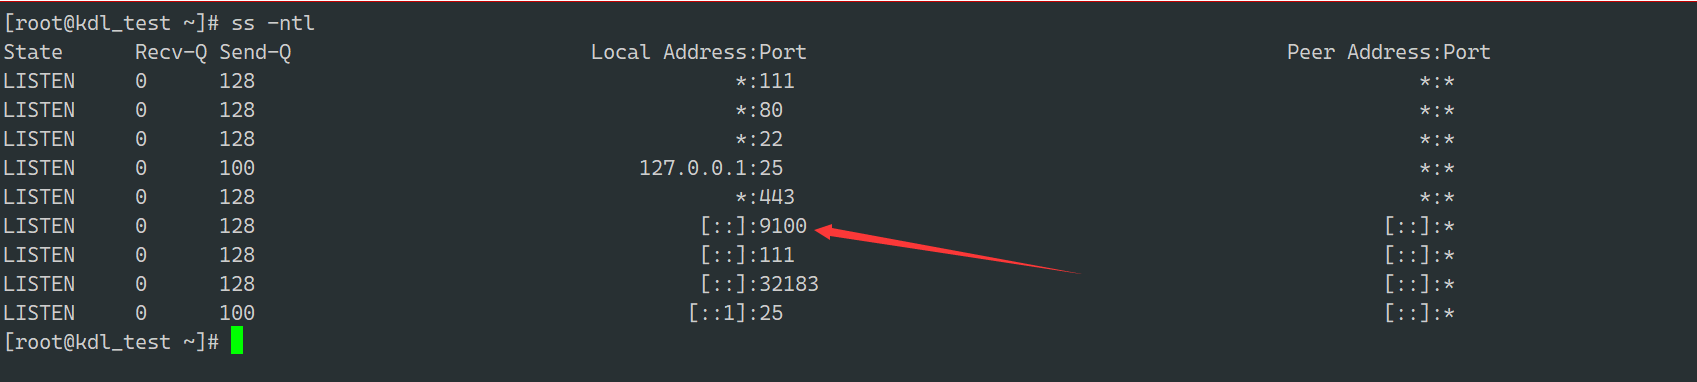
3.1.2 将node_exporter添加到System中管理
[root@localhost system]# cd /usr/lib/systemd/system
[root@localhost system]# cat node_exporter.service
[Unit]
Description=node_exporter
After=network.target

[Service]
Type=simple
User=root
ExecStart=/usr/local/node_exporter/node_exporter
Restart=on-failure

[Install]
WantedBy=mutil-user.target
[root@localhost system]# systemctl daemon-reload
[root@localhost system]# systemctl restart node_exporter.service
3.1.3 在监控端Prometheus编辑配置文件
vim prometheus.yml
……
# 抓取性能数据任务配置
scrape_configs:
  # 抓取订单服务性能指标任务,一个job下可以配置多个抓取的targets,比如订单服务的多个实例机器
  - job_name: 'prometheus'
    # 抓取的数据url
    # metrics_path defaults to '/metrics'
    # scheme defaults to 'http'.
    static_configs:
    # 抓取的服务器地址
    - targets: ['47.120.35.251:9090']
  - job_name: 'node'
    static_configs:
    - targets: ['47.113.177.189:9100','47.113.146.118:9100','47.120.35.251:9100']
3.2 被监控端部署mysqld_exporter
3.2.1 做部署前的准备
`安装MySQL或者Mariadb
[root@localhost ~]# yum -y install mariadb*
[root@localhost ~]# systemctl restart mariadb.service;systemctl enable mariadb.service

`设置root用户密码
[root@localhost ~]# mysql
MariaDB [(none)]> set password for root@localhost = password('*******');
Query OK, 0 rows affected (0.00 sec)
MariaDB [(none)]> flush privileges;
Query OK, 0 rows affected (0.00 sec)
MariaDB [(none)]> exit

`创建数据库授权用户
MariaDB [(none)]> CREATE USER 'mysqld_exporter'@'localhost' IDENTIFIED BY '*******';
MariaDB [(none)]> GRANT PROCESS, REPLICATION CLIENT, SELECT ON *.* TO 'mysqld_exporter'@'localhost';
MariaDB [(none)]> flush privileges;
3.2.2 下载相关软件包
`下载mysqld_exporter
[root@localhost ~]# wget https://github.com/prometheus/mysqld_exporter/releases/download/v0.14.0/mysqld_exporter-0.14.0.linux-amd64.tar.gz
[root@localhost ~]# tar -zxvf mysqld_exporter-0.14.0.linux-amd64.tar.gz -C /usr/local
[root@localhost ~]# cp -r /usr/local/mysqld_exporter-0.14.0.linux-amd64 /usr/local/mysqld_exporter


`配置数据库认证
[root@localhost ~]# cd /usr/local/mysqld_exporter
[root@localhost mysqld_exporter]# vim .mysqld_exporter.cnf
[client]
user=mysqld_exporter
password=123456
host=47.113.225.222
port=3306

`启动mysqld_exporter
[root@localhost mysqld_exporter]# nohup ./mysqld_exporter --config.my-cnf=/usr/local/mysqld_exporter/.mysqld_exporter.cnf > mysqld_exporter.log 2>&1 &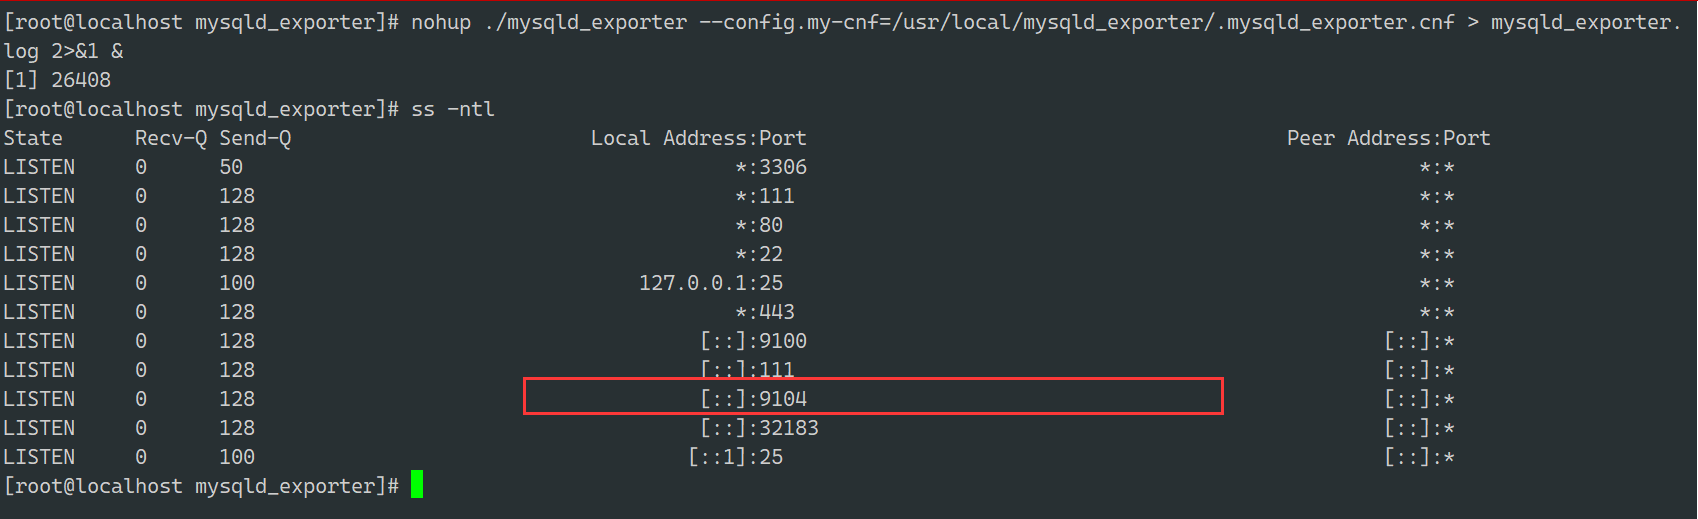
3.2.3 将mysqld_exporter添加到System中进行管理
[root@localhost system]# vim mysqld_exporter.service
[root@localhost system]# cat mysqld_exporter.service
[Unit]
Description=Prometheus MySQL daemon
After=network.target

[Service]
User=root
Group=root
Type=simple
Restart=always
ExecStart=/usr/local/mysqld_exporter/mysqld_exporter \
    --config.my-cnf=/usr/local/mysqld_exporter/.mysqld_exporter.cnf \
    --collect.global_status \
    --collect.auto_increment.columns \
    --collect.info_schema.processlist \
    --collect.binlog_size \
    --collect.info_schema.tablestats \
    --collect.global_variables \
    --collect.info_schema.innodb_metrics \
    --collect.info_schema.query_response_time \
    --collect.info_schema.userstats \
    --collect.info_schema.tables \
    --collect.perf_schema.tablelocks \
    --collect.perf_schema.file_events \
    --collect.perf_schema.eventswaits \
    --collect.perf_schema.indexiowaits \
    --collect.perf_schema.tableiowaits \
    --collect.slave_status \
    --web.listen-address=127.0.0.1:9104

[Install]
WantedBy=multi-user.target
[root@localhost system]# systemctl daemon-reload
`需要注意的是:使用systemctl启动mysqld_exporter.service 时需保证端口9104没有被占用,或者更改service文件中监听的端口号
`上面使用nohup将程序放在后台运行表示已经运行了mysqld_exporter.service,只需要把对应的pid进行kill掉后再启动
使用http://IP地址:9104 就可以访问对应页面
3.2.4 在监控端Prometheus编辑配置文件
vim prometheus.yml
……
# 抓取性能数据任务配置
scrape_configs:
  # 抓取订单服务性能指标任务,一个job下可以配置多个抓取的targets,比如订单服务的多个实例机器
  - job_name: 'prometheus'
    # 抓取的数据url
    # metrics_path defaults to '/metrics'
    # scheme defaults to 'http'.
    static_configs:
    # 抓取的服务器地址
    - targets: ['47.120.35.251:9090']
  - job_name: 'node'
    static_configs:
    - targets: ['47.113.177.189:9100','47.113.146.118:9100','47.120.35.251:9100']

  - job_name: 'mysqld_exporter'
    # 抓取数据的时间间隔
    scrape_interval: 10s
    static_configs:
    - targets: ['47.113.177.189:9104']
3.2.5 mysqld_exporter的关键指标
3.2.6 重启Promethues查看监控节点
`监控节点重启Promethues服务
[root@localhost ~]# systemctl restart prometheus.service
3.3.7 mysqld_exporter的扩展
监控数据库吞吐量
对于数据库而言,最重要的工作就是实现对数据的增、删、改、查。为了衡量数据库服务器当前的吞吐量变化情况。在MySQL内部通过一个名为Questions的计数器,当客户端发送一个查询语句后,其值就会+1。可以通过以下MySQL指令查询Questions等服务器状态变量的值:
mysql> SHOW GLOBAL STATUS LIKE "Questions";
+---------------+-------+
| Variable_name | Value |
+---------------+-------+
| Questions     | 1326  |
+---------------+-------+
1 row in set (0.00 sec)
MySQLD Exporter中返回的样本数据中通过mysql_global_status_questions反映当前Questions计数器的大小:
# HELP mysql_global_status_questions Generic metric from SHOW GLOBAL STATUS.
# TYPE mysql_global_status_questions untyped
mysql_global_status_questions 1016
通过以下PromQL可以查看当前MySQL实例查询速率的变化情况,查询数量的突变往往暗示着可能发生了某些严重的问题,因此用于用户应该关注并且设置响应的告警规则,以及时获取该指标的变化情况:
rate(mysql_global_status_questions[2m])
一般还可以从监控读操作和写操作的执行情况进行判断。通过MySQL全局状态中的Com_select可以查询到当前服务器执行查询语句的总次数:相应的,也可以通过Com_insert、Com_update以及Com_delete的总量衡量当前服务器写操作的总次数,例如,可以通过以下指令查询当前MySQL实例insert语句的执行次数总量:
mysql> SHOW GLOBAL STATUS LIKE "Com_insert";
+---------------+-------+
| Variable_name | Value |
+---------------+-------+
| Com_insert    | 0     |
+---------------+-------+
1 row in set (0.00 sec)
从MySQLD Exporter的/metrics返回的监控样本中,可以通过global_status_commands_total获取当前实例各类指令执行的次数:
# HELP mysql_global_status_commands_total Total number of executed MySQL commands.
# TYPE mysql_global_status_commands_total counter
mysql_global_status_commands_total{command="admin_commands"} 0
mysql_global_status_commands_total{command="alter_db"} 0
mysql_global_status_commands_total{command="alter_db_upgrade"} 0
mysql_global_status_commands_total{command="select"} 10
mysql_global_status_commands_total{command="insert"} 2
mysql_global_status_commands_total{command="update"} 2
mysql_global_status_commands_total{command="delete"} 1
用户可以通过以下PromQL查看当前MySQL实例写操作速率的变化情况:
sum(rate(mysql_global_status_commands_total{command=~"insert|update|delete"}[2m])) without (command)
连接情况
在MySQL中通过全局设置max_connections限制了当前服务器允许的最大客户端连接数量。一旦可用连接数被用尽,新的客户端连接都会被直接拒绝。 因此当监控MySQL运行状态时,需要时刻关注MySQL服务器的连接情况。用户可以通过以下指令查看当前MySQL服务的max_connections配置:
mysql> SHOW VARIABLES LIKE 'max_connections';
+-----------------+-------+
| Variable_name   | Value |
+-----------------+-------+
| max_connections | 151   |
+-----------------+-------+
1 row in set (0.01 sec)
MySQL默认的最大链接数为151。临时调整最大连接数,可以通过以下指令进行设置:
SET GLOBAL max_connections = 200;
如果想永久化设置,则需要通过修改MySQL配置文件my.cnf,添加以下内容:
max_connections = 200
通过Global Status中的Threads_connected、Aborted_connects、Connection_errors_max_connections以及Threads_running可以查看当前MySQL实例的连接情况。
例如,通过以下指令可以直接当前MySQL实例的连接数:
mysql> SHOW GLOBAL STATUS LIKE "Threads_connected";
+-------------------+-------+
| Variable_name     | Value |
+-------------------+-------+
| Threads_connected | 1     |
+-------------------+-------+
1 row in set (0.00 sec)
当所有可用连接都被占用时,如果一个客户端尝试连接至MySQL,会出现“Too many connections(连接数过多)”错误,同时Connection_errors_max_connections的值也会增加。为了防止出现此类情况,你应该监控可用连接的数量,并确保其值保持在max_connections限制以内。同时如果Aborted_connects的数量不断增加时,说明客户端尝试连接到MySQL都失败了。此时可以通过Connection_errors_max_connections以及Connection_errors_internal分析连接失败的问题原因。
下面列举了与MySQL连接相关的监控指标:
- mysql_global_variables_max_connections: 允许的最大连接数;
- mysql_global_status_threads_connected: 当前开放的连接;
- mysql_global_status_threads_running:当前开放的连接;
- mysql_global_status_aborted_connects:当前开放的连接;
- mysql_global_status_connection_errors_total{error="max_connections"}:由于超出最大连接数导致的错误;
- mysql_global_status_connection_errors_total{error="internal"}:由于系统内部导致的错误;
通过PromQL查询当前剩余的可用连接数:
mysql_global_variables_max_connections - mysql_global_status_threads_connected
使用PromQL查询当前MySQL实例连接拒绝数:
mysql_global_status_aborted_connects
监控缓冲池使用情况
MySQL默认的存储引擎InnoDB使用了一片称为缓冲池的内存区域,用于缓存数据表以及索引的数据。 当缓冲池的资源使用超出限制后,可能会导致数据库性能的下降,同时很多查询命令会直接在磁盘中执行,导致磁盘I/O不断攀升。 因此,应该关注MySQL缓冲池的资源使用情况,并且在合理的时间扩大缓冲池的大小可以优化数据库的性能。
Innodb_buffer_pool_pages_total反映了当前缓冲池中的内存页的总页数。可以通过以下指令查看:
mysql> SHOW GLOBAL STATUS LIKE "Innodb_buffer_pool_pages_total";
+--------------------------------+-------+
| Variable_name                  | Value |
+--------------------------------+-------+
| Innodb_buffer_pool_pages_total | 8191  |
+--------------------------------+-------+
1 row in set (0.02 sec)
MySQLD Exporter通过以下指标返回缓冲池中各类内存页的数量:
# HELP mysql_global_status_buffer_pool_pages Innodb buffer pool pages by state.
# TYPE mysql_global_status_buffer_pool_pages gauge
mysql_global_status_buffer_pool_pages{state="data"} 516
mysql_global_status_buffer_pool_pages{state="dirty"} 0
mysql_global_status_buffer_pool_pages{state="free"} 7675
mysql_global_status_buffer_pool_pages{state="misc"} 0
Innodb_buffer_pool_read_requests记录了正常从缓冲池读取数据的请求数量。可以通过以下指令查看:
mysql> SHOW GLOBAL STATUS LIKE "Innodb_buffer_pool_read_requests";
+----------------------------------+--------+
| Variable_name                    | Value  |
+----------------------------------+--------+
| Innodb_buffer_pool_read_requests | 797023 |
+----------------------------------+--------+
1 row in set (0.00 sec)
MySQLD Exporter通过以下指标返回缓冲池中Innodb_buffer_pool_read_requests的值:
# HELP mysql_global_status_innodb_buffer_pool_read_requests Generic metric from SHOW GLOBAL STATUS.
# TYPE mysql_global_status_innodb_buffer_pool_read_requests untyped
mysql_global_status_innodb_buffer_pool_read_requests 736711
当缓冲池无法满足时,MySQL只能从磁盘中读取数据。Innodb_buffer_pool_reads即记录了从磁盘读取数据的请求数量。通常来说从内存中读取数据的速度要比从磁盘中读取快很多,因此,如果Innodb_buffer_pool_reads的值开始增加,可能意味着数据库的性能有问题。 可以通过以下只能查看Innodb_buffer_pool_reads的数量
mysql> SHOW GLOBAL STATUS LIKE "Innodb_buffer_pool_reads";
+--------------------------+-------+
| Variable_name            | Value |
+--------------------------+-------+
| Innodb_buffer_pool_reads | 443   |
+--------------------------+-------+
1 row in set (0.00 sec)
在MySQLD Exporter中可以通过以下指标查看Innodb_buffer_pool_reads的数量。
# HELP mysql_global_status_innodb_buffer_pool_reads Generic metric from SHOW GLOBAL STATUS.
# TYPE mysql_global_status_innodb_buffer_pool_reads untyped
mysql_global_status_innodb_buffer_pool_reads 443
通过以上监控指标,以及实际监控的场景,我们可以利用PromQL快速建立多个监控项。
通过以下PromQL可以得到各个MySQL实例的缓冲池利用率。一般来说还需要结合Innodb_buffer_pool_reads的增长率情况来结合判断缓冲池大小是否合理:
(sum(mysql_global_status_buffer_pool_pages) by (instance) - sum(mysql_global_status_buffer_pool_pages{state="free"}) by (instance)) / sum(mysql_global_status_buffer_pool_pages) by (instance)
也可以通过以下PromQL计算2分钟内磁盘读取请求次数的增长率的变化情况:
rate(mysql_global_status_innodb_buffer_pool_reads[2m])
查询性能
MySQL还提供了一个Slow_queries的计数器,当查询的执行时间超过long_query_time的值后,计数器就会+1,其默认值为10秒,可以通过以下指令在MySQL中查询当前long_query_time的设置:
mysql> SHOW VARIABLES LIKE 'long_query_time';
+-----------------+-----------+
| Variable_name   | Value     |
+-----------------+-----------+
| long_query_time | 10.000000 |
+-----------------+-----------+
1 row in set (0.00 sec)
通过以下指令可以查看当前MySQL实例中Slow_queries的数量:
mysql> SHOW GLOBAL STATUS LIKE "Slow_queries";
+---------------+-------+
| Variable_name | Value |
+---------------+-------+
| Slow_queries  | 0     |
+---------------+-------+
1 row in set (0.00 sec)
MySQLD Exporter返回的样本数据中,通过以下指标展示当前的Slow_queries的值:
# HELP mysql_global_status_slow_queries Generic metric from SHOW GLOBAL STATUS.
# TYPE mysql_global_status_slow_queries untyped
mysql_global_status_slow_queries 0
通过监控Slow_queries的增长率,可以反映出当前MySQL服务器的性能状态,可以通过以下PromQL查询Slow_queries的增长情况:
rate(mysql_global_status_slow_queries[2m])
在MySQL中还可以通过安装response time插件,从而支持记录查询时间区间的统计信息。启动该功能后MySQLD Exporter也会自动获取到相关数据,从而可以细化MySQL查询响应时间的分布情况
3.3 被监控端部署nginx_exporter
3.3.1 开启Nginx stub_status功能
`开源Nginx提供了一个简单页面用于展示数据,该页面由with-http_stub_status_module 提供.
[root@localhost ~]# nginx -V 2>&1 | grep -o with-http_stub_status_module
with-http_stub_status_module

`如果没有任何输出结果,则可以使用 --with-http_stub_status_module 参数从源码重新配置编译一个Nginx
3.3.2 配置nginx_exporter
[root@localhost ~]# wget https://github.com/nginxinc/nginx-prometheus-exporter/releases/download/v0.11.0/nginx-prometheus-exporter_0.11.0_linux_amd64.tar.gz
[root@localhost ~]# mkdir -p /usr/local/nginx_exporter
[root@localhost ~]# tar -xzvf /root/nginx-prometheus-exporter_0.11.0_linux_amd64.tar.gz -C /usr/local/nginx_exporter
CHANGELOG.md
LICENSE
README.md
nginx-prometheus-exporter
[root@localhost nginx_exporter]# nohup ./nginx-prometheus-exporter >> /dev/null 2>&1 &启动nginx-prometheus-exporter遇到的问题
2023/06/21 16:45:42 Could not create Nginx Client: failed to get http://127.0.0.1:8080/stub_status: Get "http://127.0.0.1:8080/stub_status": dial tcp 127.0.0.1:8080: connect: connection refused
# 解决办法
[root@localhost ~]# cd /usr/local/nginx/conf/conf.d
[root@localhost conf.d]# vim nginx_exporter.conf
server {
listen 8080;
server_name 127.0.0.1;
error_page 404 = /404.html;
location /stub_status {
stub_status on;
}
}
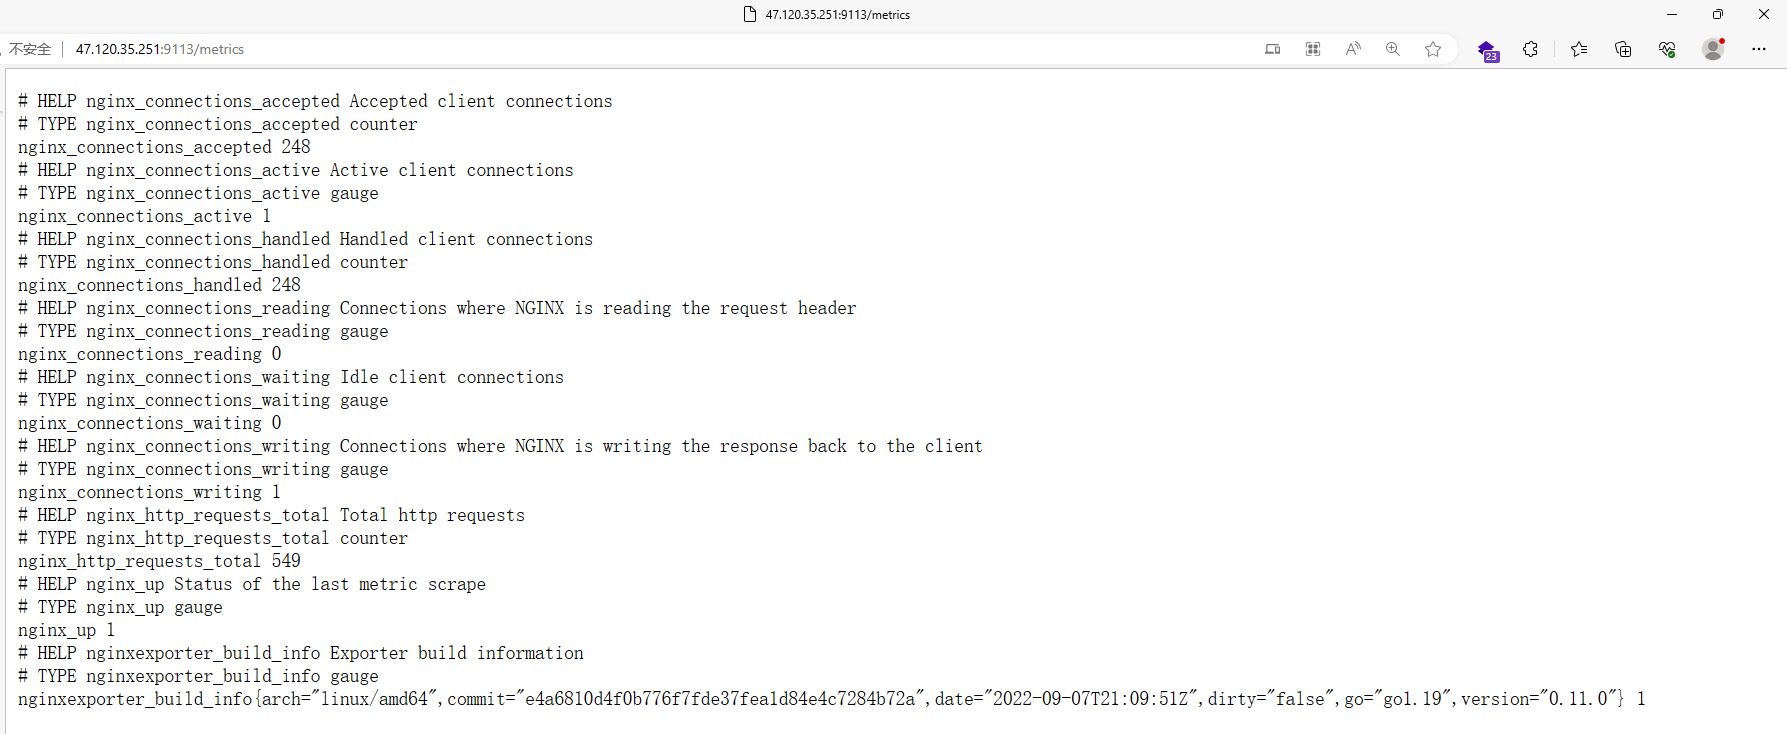
# 一定要是这样的server块,否则还会报其他的错误3.3.2 查看nginx_exporter获取的数据
3.3.4 将Nginx_exporter加入Nginx中管理
[root@localhost ~]# vim /usr/local/nginx/conf/conf.d/prometheus.conf
……
location /nginx_status/ {
        root html;
        add_header 'Access-Control-Allow-Origin' '*';
        add_header Access-Control-Allow-Methods GET,POST,OPTIONS,DELETE;
        add_header  'Access-Control-Allow-Headers' 'userId,DNT,X-CustomHeader,Keep-Alive,User-Agent,X-Requested-With,If-Modified-Since,Cache-Control,Content-Type';
        proxy_pass http://47.120.35.251:9113/metrics;
        proxy_set_header   Host $host;
  }
……
[root@localhost ~]# nginx -t
[root@localhost ~]# nginx -s reload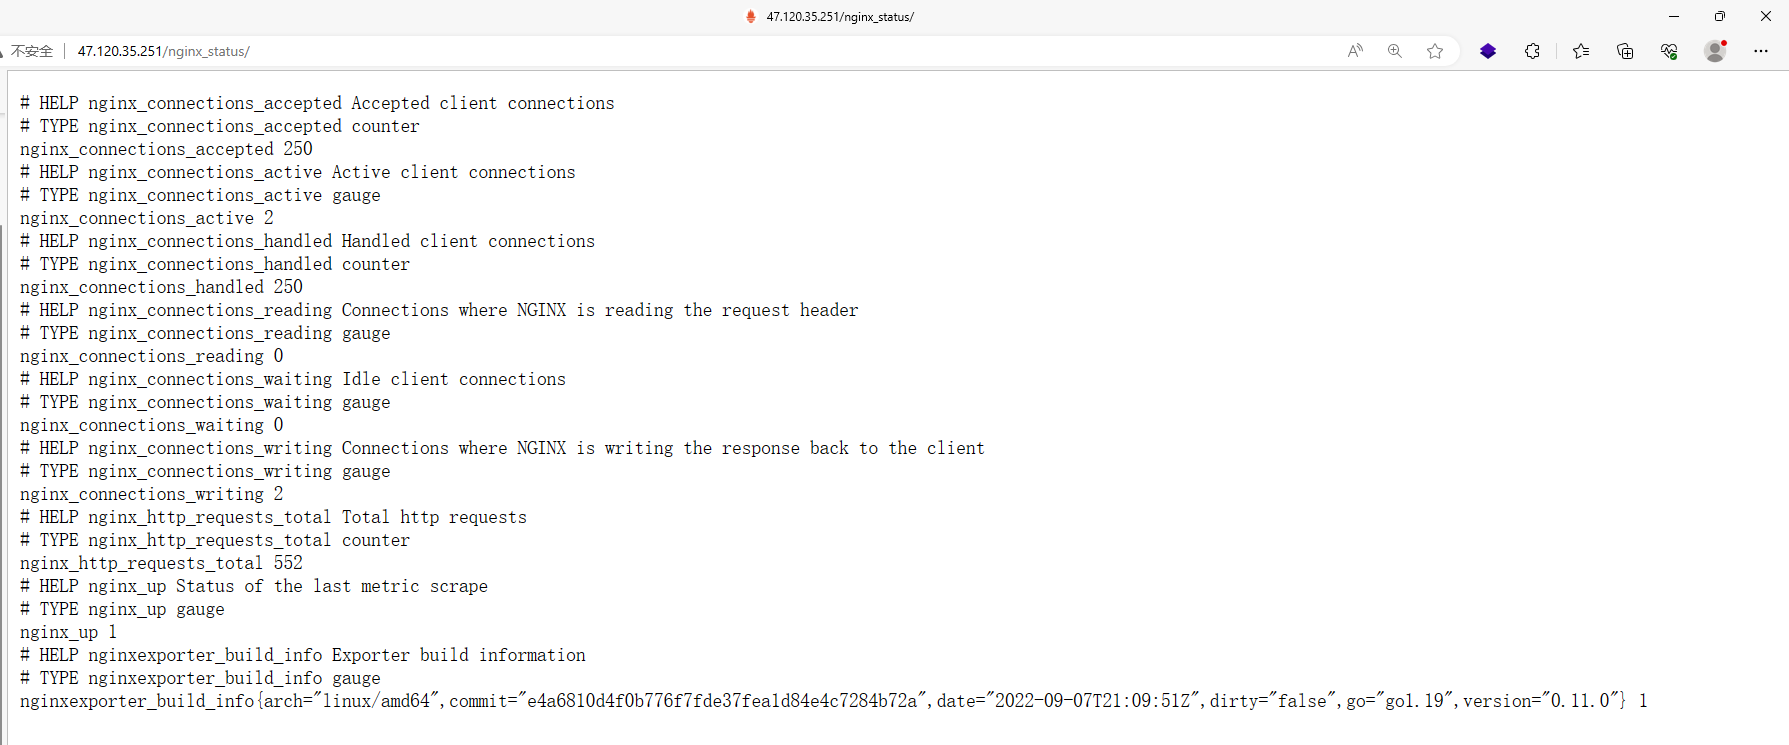
3.3.5 将Nginx_exporter加入System管理
[root@localhost ~]# cd /usr/lib/systemd/system
[root@localhost system]# cat nginx_exporter.service
[Unit]
Description=nginx_exporter
After=network.target

[Service]
Type=simple
User=root
ExecStart=/usr/local/nginx_exporter/nginx-prometheus-exporter
Restart=on-failure

[Install]
WantedBy=mutil-user.target
[root@localhost system]# systemctl daemon-reload
[root@localhost system]# lsof -i:9113
COMMAND    PID USER   FD   TYPE DEVICE SIZE/OFF NODE NAME
nginx-pro 2676 root    7u  IPv6  40003      0t0  TCP *:9113 (LISTEN)
[root@localhost system]# kill -9 2676
[root@localhost system]# systemctl enable --now nginx_exporter.service;systemctl status nginx_exporter.service
3.3.6 配置监控端Prometheus监控Nginx
# 抓取性能数据任务配置
scrape_configs:
# 抓取订单服务性能指标任务,一个job下可以配置多个抓取的targets,比如订单服务的多个实例机器
- job_name: 'prometheus'
# 抓取的数据url
# metrics_path defaults to '/metrics'
# scheme defaults to 'http'.
static_configs:
# 抓取的服务器地址
- targets: ['47.120.35.251:9090']
- job_name: 'node'
static_configs:
- targets: ['47.113.177.189:9100','47.113.146.118:9100','47.120.35.251:9100']
- job_name: 'mysqld_exporter'
# 抓取数据的时间间隔
scrape_interval: 10s
static_configs:
- targets: ['47.113.177.189:9104']
- job_name: 'nginx_exporter'
static_configs:
- targets: ['47.120.35.251:9113']
[root@localhost conf]# systemctl restart prometheus.service
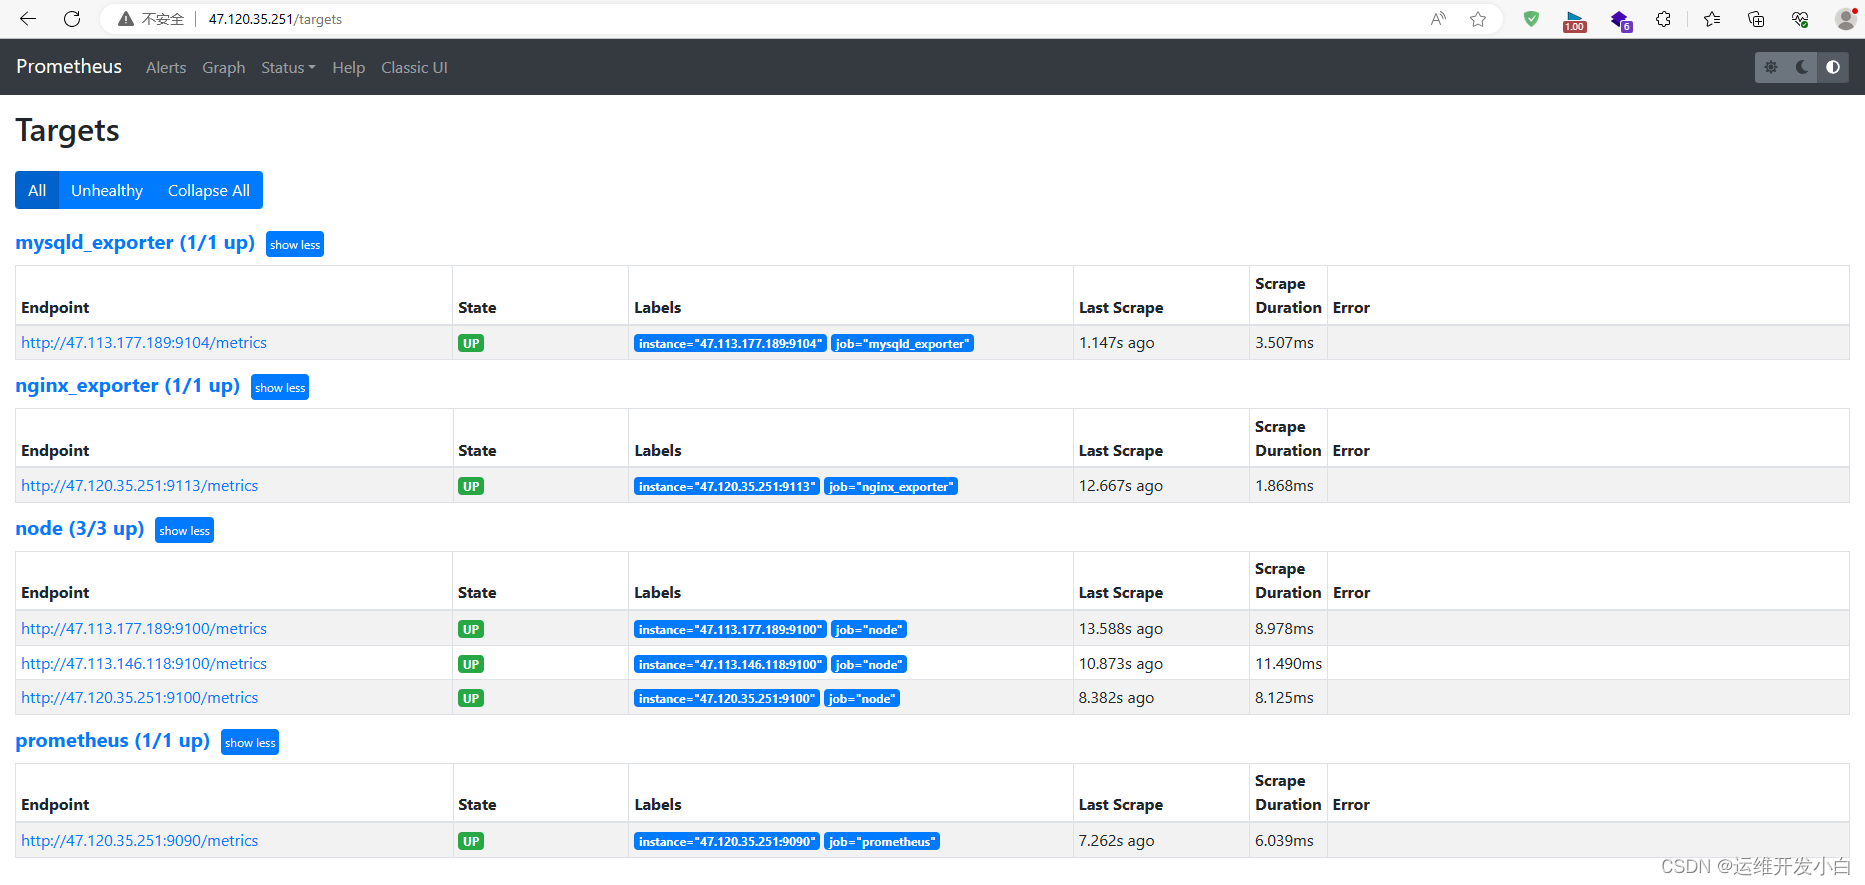
[root@localhost conf]# systemctl status prometheus.service3.3.7 查看Promethues 的Target看板
3.3.8 Nginx_exporter 监控的关键指标
- nginx_connections_accepted_total:已接受的连接数
- nginx_connections_dropped_total:已丢弃的连接数
- nginx_connections_active:当前活动连接数
- nginx_connections_idle:当前空闲连接数
- nginx_http_requests_total:处理的HTTP请求总数
- nginx_http_requests_current:当前正在处理的HTTP请求数
- nginx_http_requests_duration_seconds:HTTP请求处理时间的总和
- nginx_upstream_requests_total:向上游服务器发出的请求数量
- nginx_upstream_requests_total{upstream="<upstream_name>"}:指定上游服务器的请求数量
- nginx_upstream_responses_total:从上游服务器收到的响应总数
- nginx_upstream_responses_total{upstream="<upstream_name>"}:指定上游服务器的响应总数
- nginx_upstream_response_time_seconds:从上游服务器收到响应的时间总和
- nginx_upstream_response_time_seconds{upstream="<upstream_name>"}:指定上游服务器的响应时间总和
- nginx_upstream_response_time_seconds_bucket:响应时间的分桶计数
- nginx_upstream_response_time_seconds_sum:响应时间的总和
- nginx_upstream_response_time_seconds_count:响应时间的计数器
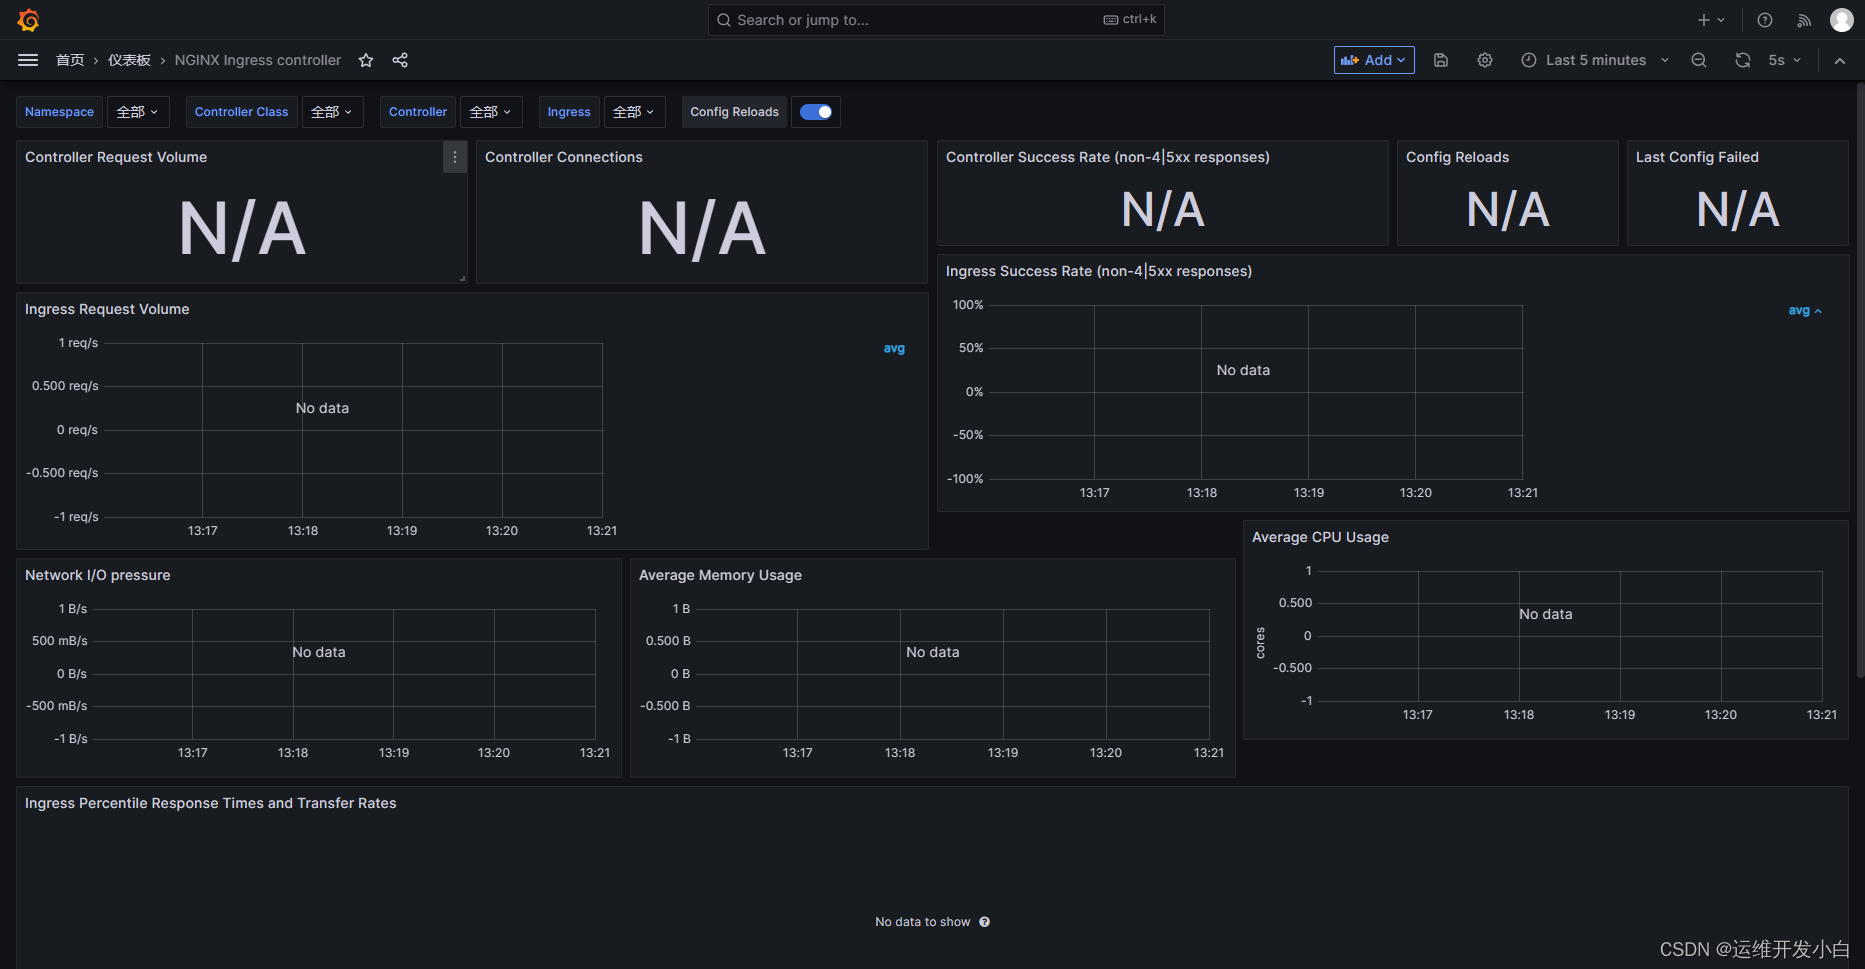
3.3.9 配置展示看板Grafana
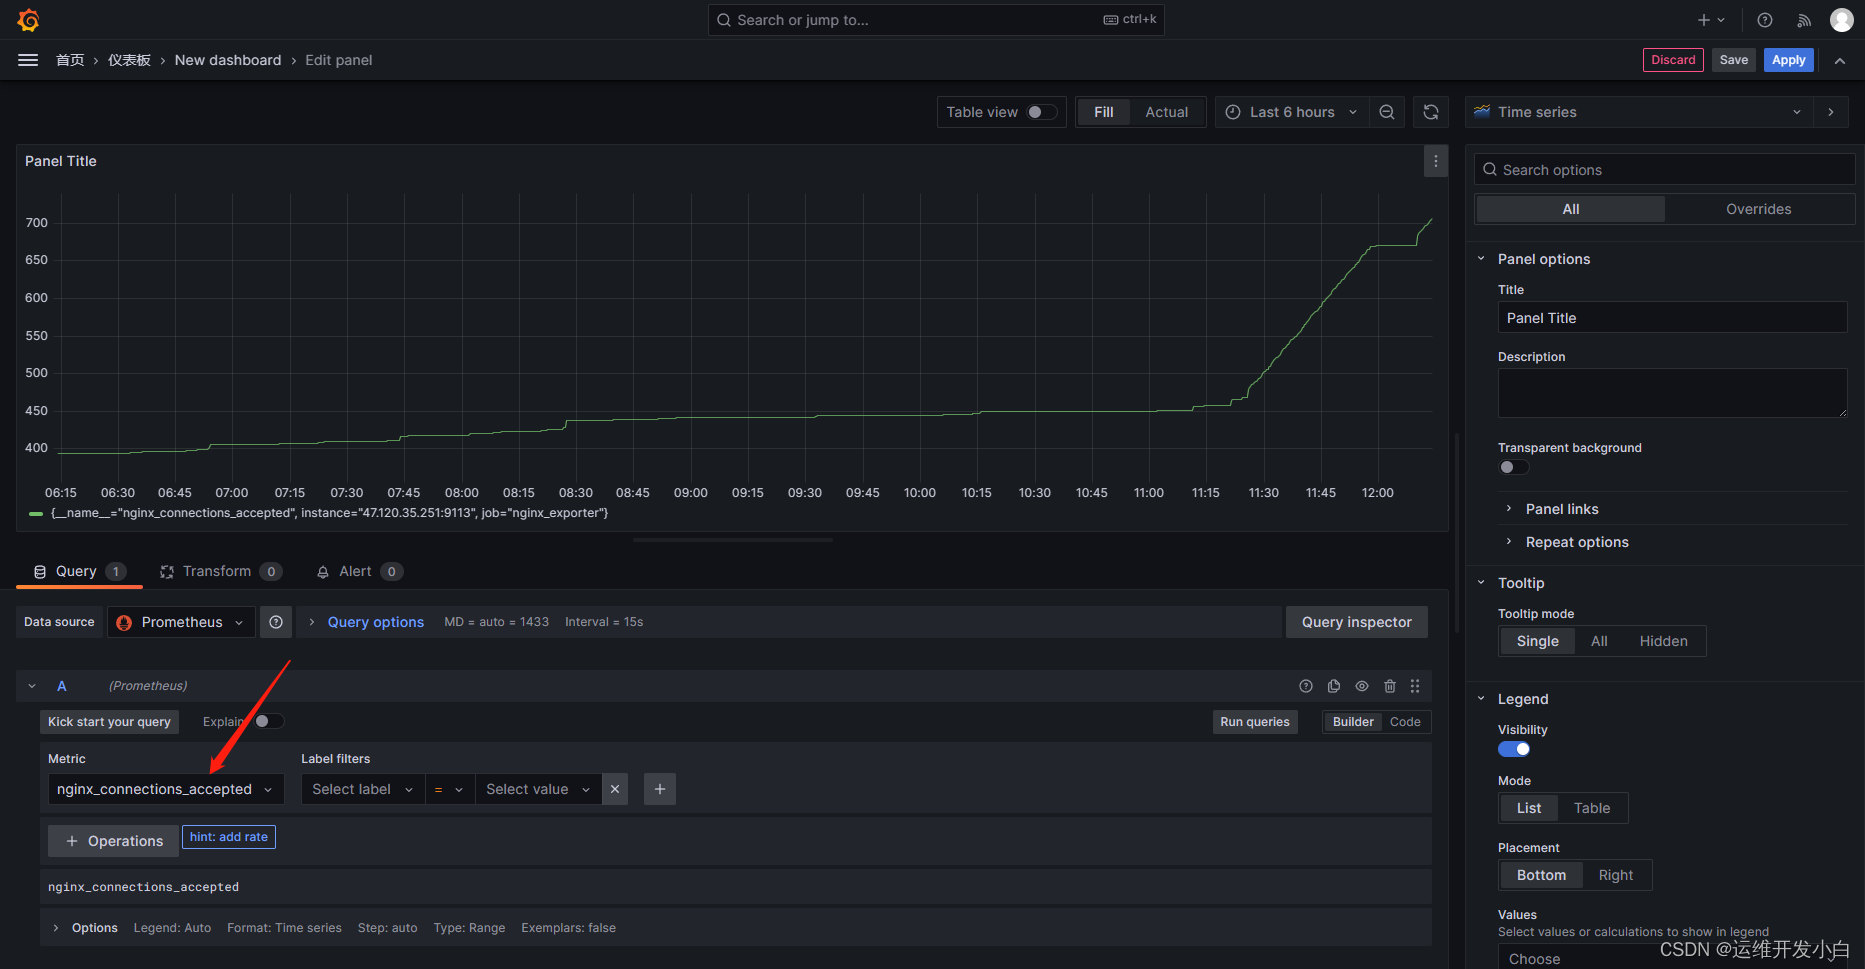
3.3.10 修改开源展示看板Granfana
导入开源展示看板9614,却发现看板中的所有内容都无法显示,这个时候就需要修改展示看板中的SQL语句

编辑其中一个,点击"Metrics browser(指标浏览器)"按钮后,选择Nginx_exporter"47.120.35.251:9113"
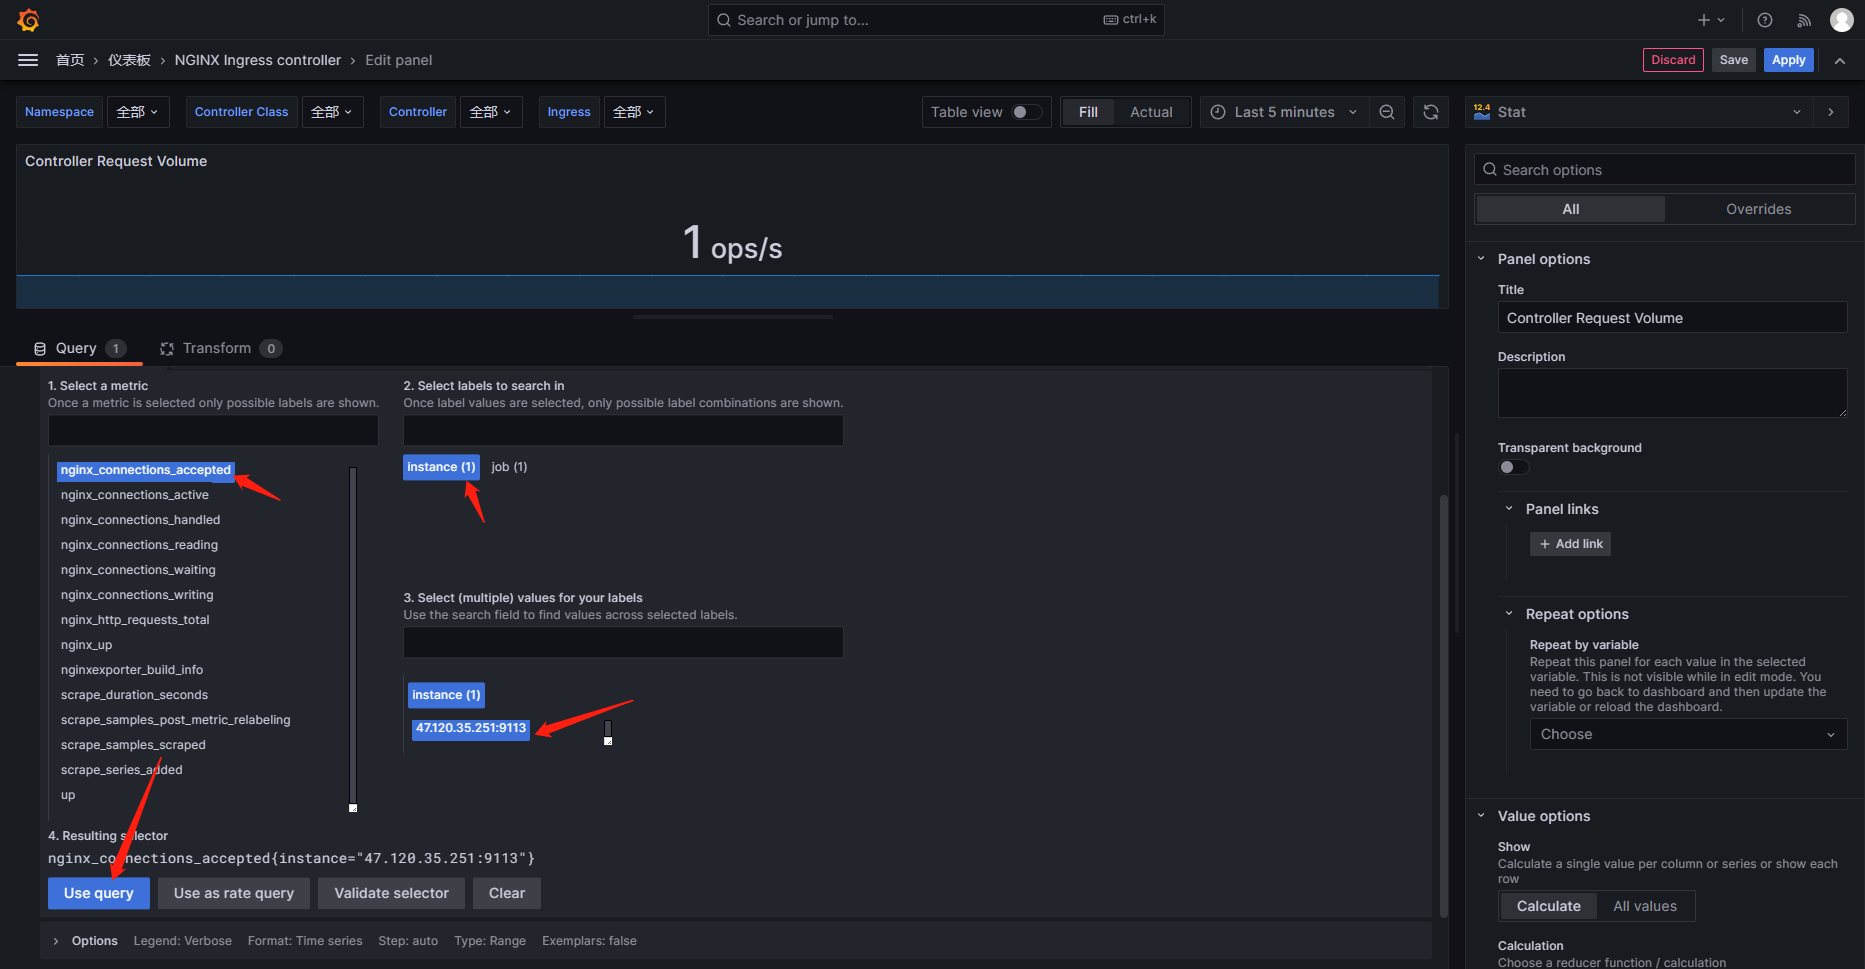
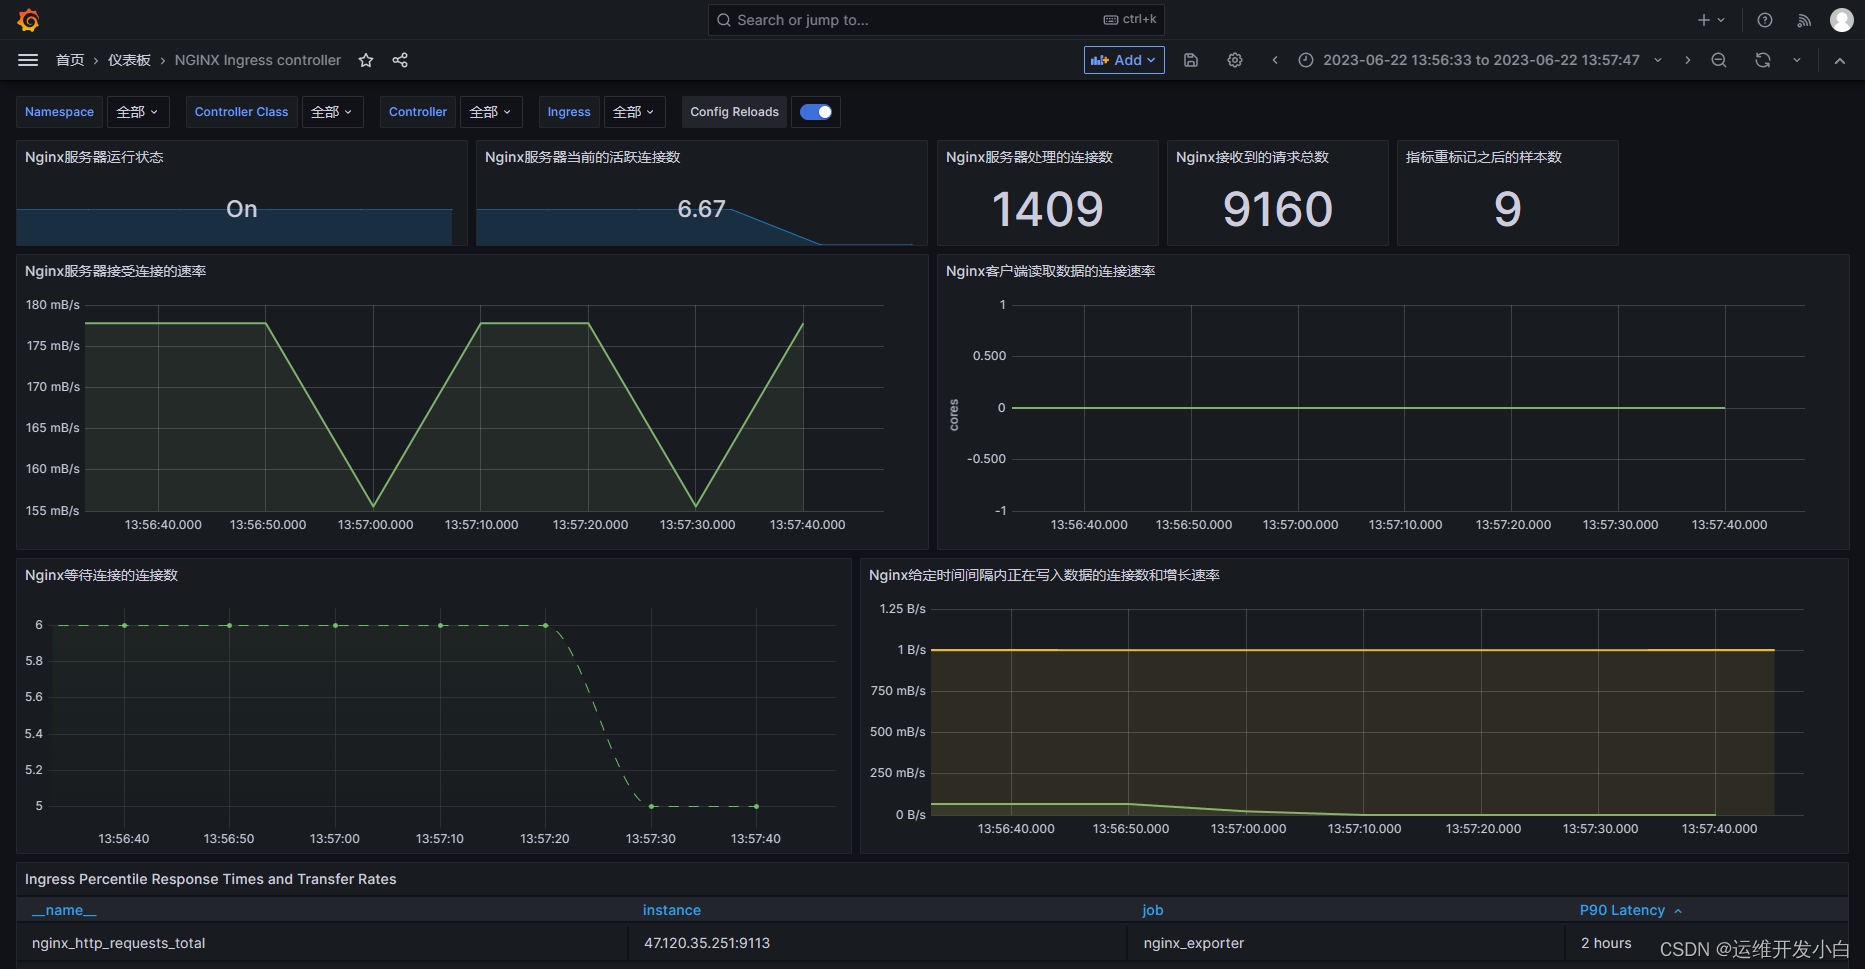
`
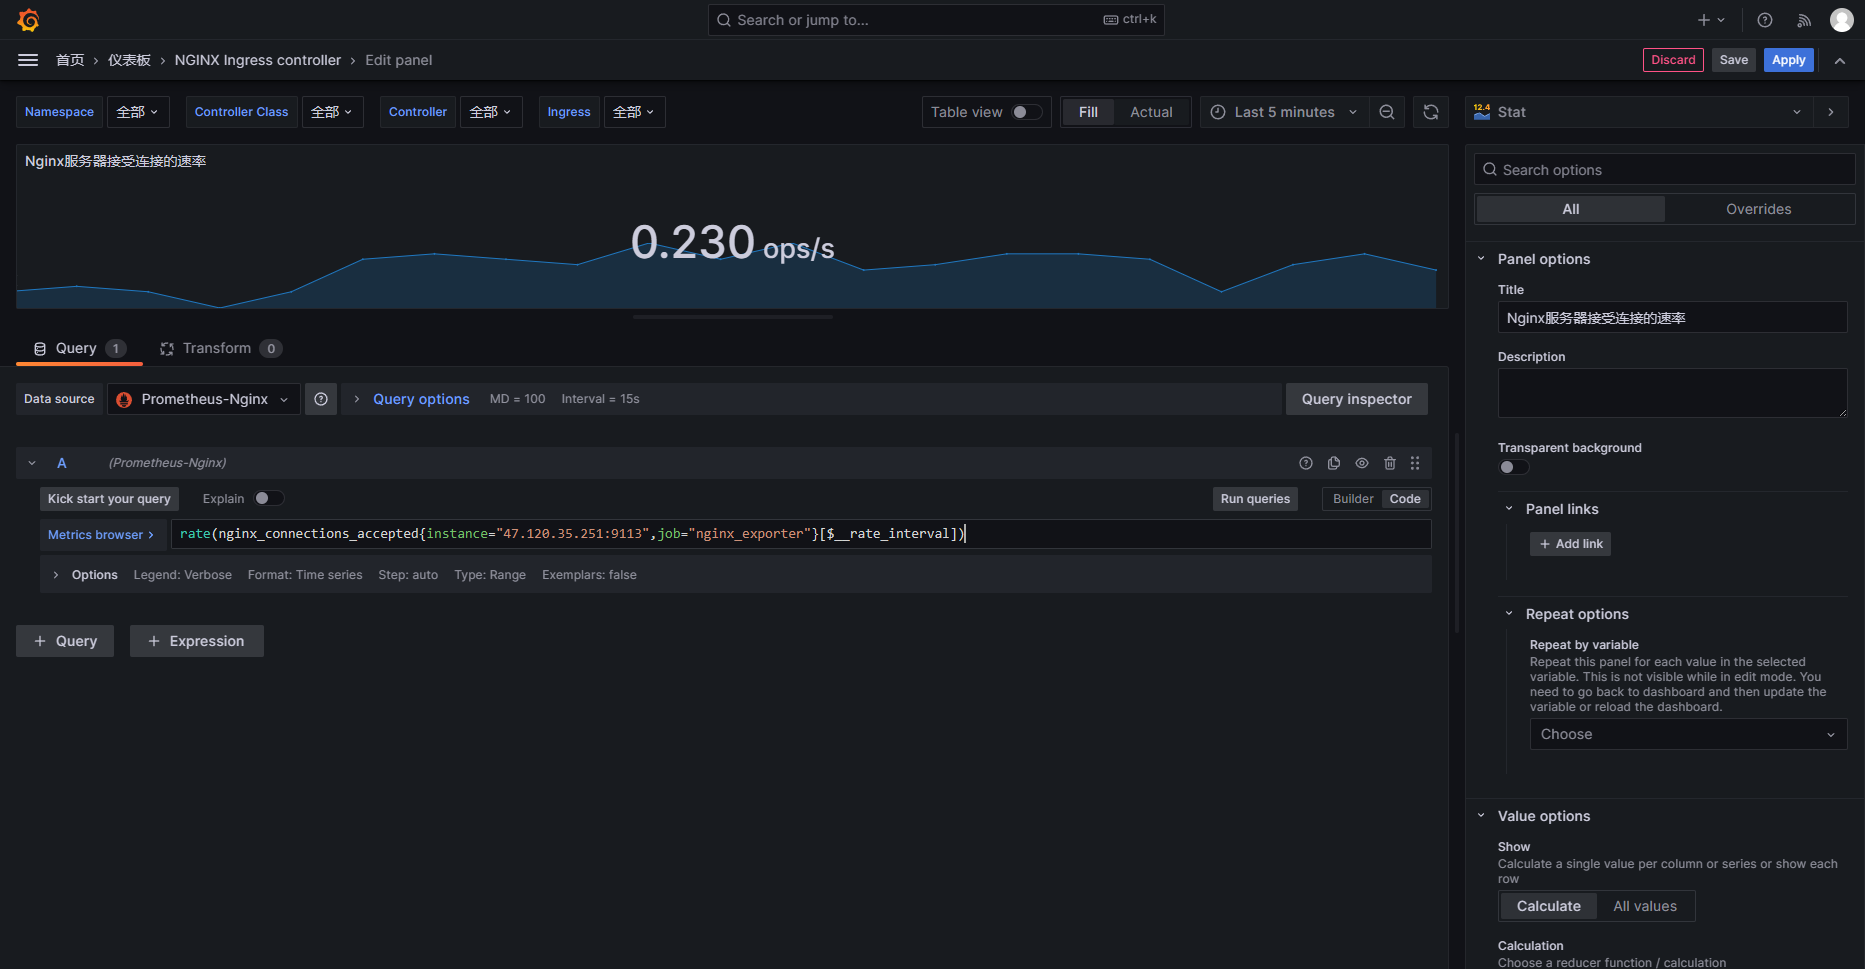
# rate(nginx_connections_accepted{instance="47.120.35.251:9113",job="nginx_exporter"}[$__rate_interval])
这是一个Prometheus查询语句,用于获取一个时间段内Nginx服务器接受连接的速率
其中"nginx_connections_accepted"是一个指标名称,表示Nginx服务器接受连接的总数
"instance"表示被监控的Nginx服务器的IP地址和端口号
"job"表示被监控的任务名称
"$__rate_interval"表示时间段,可以根据需要进行修改
这个查询语句会返回一个时间段内Nginx服务器接受连接的速率

.....


![[进阶]TCP通信实现BS架构,网站开发的原理,线程池优化BS架构](https://img-blog.csdnimg.cn/04ac05ba6af04765ae57f5860668a7e9.png)