prometheus__1">prometheus 部署安装
- 监控系统硬件(node-exporter)
- 监控mysql (mysql_exporter)
- 监控redis(redis_exporter)
- 监控docker (cadvisor)
- 监控可视化展示 (Grafana)
- 监控报警 (Alertmanager )
prometheus__docker_12">prometheus docker安装
-
创建相应目录
mkdir -p /home/prometheus/prometheus /home/prometheus/plugins && chmod 777 -R /home/prometheus -
/home/prometheus/prometheus目录下添加配置prometheus.yml,内容如下:vi /home/prometheus/prometheus/prometheus.yml
# my global config
global:
  scrape_interval:     15s # Set the scrape interval to every 15 seconds. Default is every 1 minute.
  evaluation_interval: 15s # Evaluate rules every 15 seconds. The default is every 1 minute.
  # scrape_timeout is set to the global default (10s).

# Alertmanager configuration
alerting:
  alertmanagers:
  - static_configs:
    - targets:
      # - alertmanager:9093

# Load rules once and periodically evaluate them according to the global 'evaluation_interval'.
rule_files:
  # - "first_rules.yml"
  # - "second_rules.yml"

# A scrape configuration containing exactly one endpoint to scrape:
# Here it's Prometheus itself.
scrape_configs:
  # The job name is added as a label `job=<job_name>` to any timeseries scraped from this config.
  - job_name: 'prometheus'

    # metrics_path defaults to '/metrics'
    # scheme defaults to 'http'.

    static_configs:
    # 这里改为服务器ip以及分配的端口号
    - targets: ['192.168.0.100:9090']
注意:
- scrape_configs[0].static_configs.targets:配置成宿主机IP
-
docker-compose 方式启动
-
/home/prometheus目录下创建docker-compose.yml启动文件 -
vi /home/prometheus/docker-compose.yml
version: '3' services: prometheus: image: prom/prometheus:latest hostname: prometheus container_name: prometheus restart: always ports: - "9090:9090" volumes: - $PWD/prometheus:/etc/prometheus - $PWD/prometheus/data:/prometheus - $PWD/prometheus/rules:/etc/prometheus/rules privileged: true command: - '--config.file=/etc/prometheus/prometheus.yml' - '--web.console.libraries=/etc/prometheus/console_libraries' - '--web.console.templates=/etc/prometheus/consoles' - '--storage.tsdb.path=/prometheus' - '--web.enable-lifecycle' -
启动
chmod 777 -R /home/prometheus && cd /home/prometheus && docker-compose up -d && docker-compose logs -f -
访问,浏览器访问:http://ip:9090,注意防火墙或安全组开发端口。

-
插件
node-exporter
采用go语言开发,专门用来收集Linux系统中硬件、系统指标
docker-compose 方式启动
vi /home/prometheus/docker-compose.yml
version: '3'
services:
  # prometheus
  prometheus:
    image: prom/prometheus:latest
    hostname: prometheus
    container_name: prometheus
    restart: always
    ports:
     - "9090:9090"
    volumes:
     - $PWD/prometheus:/etc/prometheus
     - $PWD/prometheus/data:/prometheus
    privileged: true
    command:
     - '--config.file=/etc/prometheus/prometheus.yml'
     - '--web.console.libraries=/etc/prometheus/console_libraries'
     - '--web.console.templates=/etc/prometheus/consoles'
     - '--storage.tsdb.path=/prometheus'
     - '--web.enable-lifecycle'

  # node-exporter
  node-exporter:
    image: prom/node-exporter:latest
    hostname: node-exporter
    container_name: node-exporter
    restart: always
    ports:
     - "9190:9100"
    volumes:
     - /proc:/host/proc:ro
     - /sys:/host/sys:ro
     - /:/rootfs:ro
    privileged: true
    command:
     - '--path.procfs=/host/proc'
     - '--path.rootfs=/rootfs'
     - '--path.sysfs=/host/sys'
     - '--collector.filesystem.mount-points-exclude=^/(sys|proc|dev|host|etc)($$|/)'
prometheus_153">对接prometheus
配置 prometheus.yml,新增 scrape_configs[1].job_name
  # 对接 linux
  - job_name: linux
    static_configs:
      - targets: ['xxx.xxx.xxx.xxx:9190'] #填写宿主机ip:映射的node-exporter端口
        labels:
          instance: node-exporter
完整如下:
vi /home/prometheus/prometheus/prometheus.yml
# my global config
global:
  scrape_interval:     15s # Set the scrape interval to every 15 seconds. Default is every 1 minute.
  evaluation_interval: 15s # Evaluate rules every 15 seconds. The default is every 1 minute.
  # scrape_timeout is set to the global default (10s).

# Alertmanager configuration
alerting:
  alertmanagers:
  - static_configs:
    - targets:
      # - alertmanager:9093

# Load rules once and periodically evaluate them according to the global 'evaluation_interval'.
rule_files:
  # - "first_rules.yml"
  # - "second_rules.yml"

# A scrape configuration containing exactly one endpoint to scrape:
# Here it's Prometheus itself.
scrape_configs:
  # The job name is added as a label `job=<job_name>` to any timeseries scraped from this config.
  - job_name: 'prometheus'

    # metrics_path defaults to '/metrics'
    # scheme defaults to 'http'.

    static_configs:
    # 这里改为服务器ip以及分配的端口号
    - targets: ['192.168.0.100:9090']
  # 对接 linux
  - job_name: 'linux'
    static_configs:
    # 这里改为服务器ip以及分配的端口号
    - targets: ['192.168.0.100:9190']
      labels:
        instance: node-exporter
mysql_exporter
用来收集MysQL或者Mariadb数据库相关指标
创建mysql 监控用户及授权
创建用户
CREATE USER 'prometheus'@'%' IDENTIFIED BY 'hcloud1234';
授权
GRANT PROCESS, REPLICATION CLIENT, SELECT ON *.* TO 'prometheus'@'%';
flush privileges;
docker-compose 方式启动
version: '3'
services:
  # prometheus
  prometheus:
    image: prom/prometheus:latest
    hostname: prometheus
    container_name: prometheus
    restart: always
    ports:
     - "9090:9090"
    volumes:
     - $PWD/prometheus:/etc/prometheus
     - $PWD/prometheus/data:/prometheus
    privileged: true
    command:
     - '--config.file=/etc/prometheus/prometheus.yml'
     - '--web.console.libraries=/etc/prometheus/console_libraries'
     - '--web.console.templates=/etc/prometheus/consoles'
     - '--storage.tsdb.path=/prometheus'
     - '--web.enable-lifecycle'

  # node-exporter
  node-exporter:
    image: prom/node-exporter:latest
    hostname: node-exporter
    container_name: node-exporter
    restart: always
    ports:
     - "9190:9100"
    volumes:
     - /proc:/host/proc:ro
     - /sys:/host/sys:ro
     - /:/rootfs:ro
    privileged: true
    command:
     - '--path.procfs=/host/proc'
     - '--path.rootfs=/rootfs'
     - '--path.sysfs=/host/sys'
     - '--collector.filesystem.mount-points-exclude=^/(sys|proc|dev|host|etc)($$|/)'

  # mysqld-exporter
  mysqld-exporter:
    image: prom/mysqld-exporter:latest
    hostname: mysqld-exporter
    container_name: mysqld-exporter
    restart: always
    environment:
      - DATA_SOURCE_NAME=prometheus:hcloud1234@(192.168.0.229:43306)/
      - TZ=Asia/Shanghai
    ports:
     - "9104:9104"
    privileged: true
prometheus_286">对接prometheus
配置 prometheus.yml,新增 scrape_configs[2].job_name
    # 监控mysql
  - job_name: mysql
    static_configs:
      - targets: ['xxx.xxx.xxx.xxx:9104'] #填写宿主机ip:映射的mysql-exporter端口
        labels:
          instance: mysqld-exporter
完整配置:
# my global config
global:
  scrape_interval:     15s # Set the scrape interval to every 15 seconds. Default is every 1 minute.
  evaluation_interval: 15s # Evaluate rules every 15 seconds. The default is every 1 minute.
  # scrape_timeout is set to the global default (10s).

# Alertmanager configuration
alerting:
  alertmanagers:
  - static_configs:
    - targets:
      # - alertmanager:9093

# Load rules once and periodically evaluate them according to the global 'evaluation_interval'.
rule_files:
  # - "first_rules.yml"
  # - "second_rules.yml"

# A scrape configuration containing exactly one endpoint to scrape:
# Here it's Prometheus itself.
scrape_configs:
  # The job name is added as a label `job=<job_name>` to any timeseries scraped from this config.
  - job_name: 'prometheus'

    # metrics_path defaults to '/metrics'
    # scheme defaults to 'http'.

    static_configs:
    # 这里改为服务器ip以及分配的端口号
    - targets: ['192.168.0.100:9090']
  # 对接 linux
  - job_name: 'linux'
    static_configs:
    # 这里改为服务器ip以及分配的端口号
    - targets: ['192.168.0.100:9190']
      labels:
        instance: node-exporter
    # 监控mysql
  - job_name: mysql
    static_configs:
    - targets: ['192.168.0.100:9104']
      labels:
          instance: mysqld-exporter
cadvisor
- 当docker服务数量到一定程度,为了保证系统的文档,我们就需要对docker进行监控。一般情况下我们可以通过docker status命令来做简单的监控,但是无法交给prometheus采集,因此谷歌的cadvisor诞生了。
- cadvisor不仅可以轻松收集到所有的容器状态,还对外提供http接口方便prometheus数据抓取。
- cadvisor可以进行实时监控和服务器性能数据采集,包括CUP、内存、网络、容量等数据。但cadvisor不能保存数据只能实时展示,这时候就需要对接到prometheus,由其内置的tsdb进行存储达到可以观看历史数据的目的
docker-compose 方式启动
version: '3'
services:
  # prometheus
  prometheus:
    image: prom/prometheus:latest
    hostname: prometheus
    container_name: prometheus
    restart: always
    ports:
     - "9090:9090"
    volumes:
     - $PWD/prometheus:/etc/prometheus
     - $PWD/prometheus/data:/prometheus
    privileged: true
    command:
     - '--config.file=/etc/prometheus/prometheus.yml'
     - '--web.console.libraries=/etc/prometheus/console_libraries'
     - '--web.console.templates=/etc/prometheus/consoles'
     - '--storage.tsdb.path=/prometheus'
     - '--web.enable-lifecycle'

  # node-exporter
  node-exporter:
    image: prom/node-exporter:latest
    hostname: node-exporter
    container_name: node-exporter
    restart: always
    ports:
     - "9190:9100"
    volumes:
     - /proc:/host/proc:ro
     - /sys:/host/sys:ro
     - /:/rootfs:ro
    privileged: true
    command:
     - '--path.procfs=/host/proc'
     - '--path.rootfs=/rootfs'
     - '--path.sysfs=/host/sys'
     - '--collector.filesystem.mount-points-exclude=^/(sys|proc|dev|host|etc)($$|/)'

  # mysqld-exporter
  mysqld-exporter:
    image: prom/mysqld-exporter:latest
    hostname: mysqld-exporter
    container_name: mysqld-exporter
    restart: always
    environment:
      - DATA_SOURCE_NAME=prometheus:hcloud1234@(192.168.0.229:43306)/
    ports:
     - "9104:9104"
    privileged: true

  # cadvisor
  cadvisor:
    image: google/cadvisor:latest
    hostname: cadvisor
    container_name: cadvisor
    restart: always
    volumes:
     - /sys:/sys:ro
     - /var/run:/var/run:rw
     - /:/rootfs:ro
     - /dev/disk/:/dev/disk:ro
     - /home/docker:/var/lib/docker:ro
    ports:
     - "9105:8080"
prometheus_424">对接prometheus
配置 prometheus.yml,新增 scrape_configs[3].job_name
  # 对接cadvisor
  - job_name: "docker"
    static_configs:
    - targets: ['xxx.xxx.xxx.xxx:9105']
完整配置:
# my global config
global:
  scrape_interval:     15s # Set the scrape interval to every 15 seconds. Default is every 1 minute.
  evaluation_interval: 15s # Evaluate rules every 15 seconds. The default is every 1 minute.
  # scrape_timeout is set to the global default (10s).

# Alertmanager configuration
alerting:
  alertmanagers:
  - static_configs:
    - targets:
      # - alertmanager:9093

# Load rules once and periodically evaluate them according to the global 'evaluation_interval'.
rule_files:
  # - "first_rules.yml"
  # - "second_rules.yml"

# A scrape configuration containing exactly one endpoint to scrape:
# Here it's Prometheus itself.
scrape_configs:
  # The job name is added as a label `job=<job_name>` to any timeseries scraped from this config.
  - job_name: 'prometheus'

    # metrics_path defaults to '/metrics'
    # scheme defaults to 'http'.

    static_configs:
    # 这里改为服务器ip以及分配的端口号
    - targets: ['192.168.0.100:9090']
  # 对接 linux
  - job_name: 'linux'
    static_configs:
    # 这里改为服务器ip以及分配的端口号
    - targets: ['192.168.0.100:9190']
      labels:
        instance: node-exporter
    # 监控mysql
  - job_name: mysql
    static_configs:
    - targets: ['192.168.0.100:9104']
        labels:
          instance: mysqld-exporter
  - job_name: docker
    static_configs:
    - targets: ['192.168.0.100:9105']
Grafana
Grafana是一个跨平台的开源的度量分析和可视化工具,可以通过将采集的数据查询然后可视化的展示,并及时通知。
主要特点
- 展示方式:快速灵活的客户端图表,面板插件有许多不同方式的可视化指标和日志,官方库中具有丰富的仪表盘插件,比如热图、折线图、图表等多种展示方式;
- 数据源:Graphite,InfluxDB,OpenTSDB,Prometheus,Elasticsearch,CloudWatch和KairosDB等;
- 通知提醒:以可视方式定义最重要指标的警报规则,Grafana将不断计算并发送通知,在数据达到阈值时通过Slack、PagerDuty等获得通知;
- 混合展示:在同一图表中混合使用不同的数据源,可以基于每个查询指定数据源,甚至自定义数据源;
- 注释:使用来自不同数据源的丰富事件注释图表,将鼠标悬停在事件上会显示完整的事件元数据和标记;
- 过滤器:Ad-hoc过滤器允许动态创建新的键/值过滤器,这些过滤器会自动应用于使用该数据源的所有查询。
官方提供的Dashboards库
https://grafana.com/grafana/dashboards
docker-compose 方式启动
version: '3'
services:
  # prometheus
  prometheus:
    image: prom/prometheus:latest
    hostname: prometheus
    container_name: prometheus
    restart: always
    ports:
     - "9090:9090"
    volumes:
     - $PWD/prometheus:/etc/prometheus
     - $PWD/prometheus/data:/prometheus
    privileged: true
    command:
     - '--config.file=/etc/prometheus/prometheus.yml'
     - '--web.console.libraries=/etc/prometheus/console_libraries'
     - '--web.console.templates=/etc/prometheus/consoles'
     - '--storage.tsdb.path=/prometheus'
     - '--web.enable-lifecycle'

  # node-exporter
  node-exporter:
    image: prom/node-exporter:latest
    hostname: node-exporter
    container_name: node-exporter
    restart: always
    ports:
     - "9190:9100"
    volumes:
     - /proc:/host/proc:ro
     - /sys:/host/sys:ro
     - /:/rootfs:ro
    privileged: true
    command:
     - '--path.procfs=/host/proc'
     - '--path.rootfs=/rootfs'
     - '--path.sysfs=/host/sys'
     - '--collector.filesystem.mount-points-exclude=^/(sys|proc|dev|host|etc)($$|/)'

  # mysqld-exporter
  mysqld-exporter:
    image: prom/mysqld-exporter:latest
    hostname: mysqld-exporter
    container_name: mysqld-exporter
    restart: always
    environment:
      - DATA_SOURCE_NAME=prometheus:hcloud1234@(192.168.0.229:43306)/
    ports:
     - "9104:9104"
    privileged: true

  # cadvisor
  cadvisor:
    image: google/cadvisor:latest
    hostname: cadvisor
    container_name: cadvisor
    restart: always
    volumes:
     - /sys:/sys:ro
     - /var/run:/var/run:rw
     - /:/rootfs:ro
     - /dev/disk/:/dev/disk:ro
     - /home/docker:/var/lib/docker:ro
    ports:
     - "9105:8080"

  # grafana
  grafana:
    image: grafana/grafana:latest
    hostname: grafana
    container_name: grafana
    restart: always
    environment:
     - GF_SERVER_ROOT_URL=https://192.168.0.100:9106
     - GF_SECURITY_ADMIN_PASSWORD=hancloud1234
    volumes:
     - $PWD/plugins/grafana/data:/var/lib/grafana
     - $PWD/plugins/grafana/grafana.ini:/etc/grafana/grafana.ini
    ports:
     - "9106:3000"
grafana.ini 配置文件
##################### Grafana Configuration Example #####################
#
# Everything has defaults so you only need to uncomment things you want to
# change

# possible values : production, development
;app_mode = production

# instance name, defaults to HOSTNAME environment variable value or hostname if HOSTNAME var is empty
;instance_name = ${HOSTNAME}

#################################### Paths ####################################
[paths]
# Path to where grafana can store temp files, sessions, and the sqlite3 db (if that is used)
;data = /var/lib/grafana

# Temporary files in `data` directory older than given duration will be removed
;temp_data_lifetime = 24h

# Directory where grafana can store logs
;logs = /var/log/grafana

# Directory where grafana will automatically scan and look for plugins
;plugins = /var/lib/grafana/plugins

# folder that contains provisioning config files that grafana will apply on startup and while running.
;provisioning = conf/provisioning

#################################### Server ####################################
[server]
# Protocol (http, https, h2, socket)
;protocol = http

# The ip address to bind to, empty will bind to all interfaces
;http_addr =

# The http port  to use
;http_port = 3000

# The public facing domain name used to access grafana from a browser
;domain = localhost

# Redirect to correct domain if host header does not match domain
# Prevents DNS rebinding attacks
;enforce_domain = false

# The full public facing url you use in browser, used for redirects and emails
# If you use reverse proxy and sub path specify full url (with sub path)
;root_url = %(protocol)s://%(domain)s:%(http_port)s/

# Serve Grafana from subpath specified in `root_url` setting. By default it is set to `false` for compatibility reasons.
;serve_from_sub_path = false

# Log web requests
;router_logging = false

# the path relative working path
;static_root_path = public

# enable gzip
;enable_gzip = false

# https certs & key file
;cert_file =
;cert_key =

# Unix socket path
;socket =

# CDN Url
;cdn_url =

# Sets the maximum time using a duration format (5s/5m/5ms) before timing out read of an incoming request and closing idle connections.
# `0` means there is no timeout for reading the request.
;read_timeout = 0

#################################### Database ####################################
[database]
# You can configure the database connection by specifying type, host, name, user and password
# as separate properties or as on string using the url properties.

# Either "mysql", "postgres" or "sqlite3", it's your choice
;type = sqlite3
;host = 127.0.0.1:3306
;name = grafana
;user = root
# If the password contains # or ; you have to wrap it with triple quotes. Ex """#password;"""
;password =

# Use either URL or the previous fields to configure the database
# Example: mysql://user:secret@host:port/database
;url =

# For "postgres" only, either "disable", "require" or "verify-full"
;ssl_mode = disable

# Database drivers may support different transaction isolation levels.
# Currently, only "mysql" driver supports isolation levels.
# If the value is empty - driver's default isolation level is applied.
# For "mysql" use "READ-UNCOMMITTED", "READ-COMMITTED", "REPEATABLE-READ" or "SERIALIZABLE".
;isolation_level =

;ca_cert_path =
;client_key_path =
;client_cert_path =
;server_cert_name =

# For "sqlite3" only, path relative to data_path setting
;path = grafana.db

# Max idle conn setting default is 2
;max_idle_conn = 2

# Max conn setting default is 0 (mean not set)
;max_open_conn =

# Connection Max Lifetime default is 14400 (means 14400 seconds or 4 hours)
;conn_max_lifetime = 14400

# Set to true to log the sql calls and execution times.
;log_queries =

# For "sqlite3" only. cache mode setting used for connecting to the database. (private, shared)
;cache_mode = private

################################### Data sources #########################
[datasources]
# Upper limit of data sources that Grafana will return. This limit is a temporary configuration and it will be deprecated when pagination will be introduced on the list data sources API.
;datasource_limit = 5000

#################################### Cache server #############################
[remote_cache]
# Either "redis", "memcached" or "database" default is "database"
;type = database

# cache connectionstring options
# database: will use Grafana primary database.
# redis: config like redis server e.g. `addr=127.0.0.1:6379,pool_size=100,db=0,ssl=false`. Only addr is required. ssl may be 'true', 'false', or 'insecure'.
# memcache: 127.0.0.1:11211
;connstr =

#################################### Data proxy ###########################
[dataproxy]

# This enables data proxy logging, default is false
;logging = false

# How long the data proxy waits to read the headers of the response before timing out, default is 30 seconds.
# This setting also applies to core backend HTTP data sources where query requests use an HTTP client with timeout set.
;timeout = 30

# How long the data proxy waits to establish a TCP connection before timing out, default is 10 seconds.
;dialTimeout = 10

# How many seconds the data proxy waits before sending a keepalive probe request.
;keep_alive_seconds = 30

# How many seconds the data proxy waits for a successful TLS Handshake before timing out.
;tls_handshake_timeout_seconds = 10

# How many seconds the data proxy will wait for a server's first response headers after
# fully writing the request headers if the request has an "Expect: 100-continue"
# header. A value of 0 will result in the body being sent immediately, without
# waiting for the server to approve.
;expect_continue_timeout_seconds = 1

# Optionally limits the total number of connections per host, including connections in the dialing,
# active, and idle states. On limit violation, dials will block.
# A value of zero (0) means no limit.
;max_conns_per_host = 0

# The maximum number of idle connections that Grafana will keep alive.
;max_idle_connections = 100

# How many seconds the data proxy keeps an idle connection open before timing out.
;idle_conn_timeout_seconds = 90

# If enabled and user is not anonymous, data proxy will add X-Grafana-User header with username into the request, default is false.
;send_user_header = false

#################################### Analytics ####################################
[analytics]
# Server reporting, sends usage counters to stats.grafana.org every 24 hours.
# No ip addresses are being tracked, only simple counters to track
# running instances, dashboard and error counts. It is very helpful to us.
# Change this option to false to disable reporting.
;reporting_enabled = true

# The name of the distributor of the Grafana instance. Ex hosted-grafana, grafana-labs
;reporting_distributor = grafana-labs

# Set to false to disable all checks to https://grafana.net
# for new versions (grafana itself and plugins), check is used
# in some UI views to notify that grafana or plugin update exists
# This option does not cause any auto updates, nor send any information
# only a GET request to http://grafana.com to get latest versions
;check_for_updates = true

# Google Analytics universal tracking code, only enabled if you specify an id here
;google_analytics_ua_id =

# Google Tag Manager ID, only enabled if you specify an id here
;google_tag_manager_id =

#################################### Security ####################################
[security]
# disable creation of admin user on first start of grafana
;disable_initial_admin_creation = false

# default admin user, created on startup
;admin_user = admin

# default admin password, can be changed before first start of grafana,  or in profile settings
;admin_password = admin

# used for signing
;secret_key = SW2YcwTIb9zpOOhoPsMm

# disable gravatar profile images
;disable_gravatar = false

# data source proxy whitelist (ip_or_domain:port separated by spaces)
;data_source_proxy_whitelist =

# disable protection against brute force login attempts
;disable_brute_force_login_protection = false

# set to true if you host Grafana behind HTTPS. default is false.
;cookie_secure = false

# set cookie SameSite attribute. defaults to `lax`. can be set to "lax", "strict", "none" and "disabled"
;cookie_samesite = lax

# set to true if you want to allow browsers to render Grafana in a <frame>, <iframe>, <embed> or <object>. default is false.
;allow_embedding = false

# Set to true if you want to enable http strict transport security (HSTS) response header.
# This is only sent when HTTPS is enabled in this configuration.
# HSTS tells browsers that the site should only be accessed using HTTPS.
;strict_transport_security = false

# Sets how long a browser should cache HSTS. Only applied if strict_transport_security is enabled.
;strict_transport_security_max_age_seconds = 86400

# Set to true if to enable HSTS preloading option. Only applied if strict_transport_security is enabled.
;strict_transport_security_preload = false

# Set to true if to enable the HSTS includeSubDomains option. Only applied if strict_transport_security is enabled.
;strict_transport_security_subdomains = false

# Set to true to enable the X-Content-Type-Options response header.
# The X-Content-Type-Options response HTTP header is a marker used by the server to indicate that the MIME types advertised
# in the Content-Type headers should not be changed and be followed.
;x_content_type_options = true

# Set to true to enable the X-XSS-Protection header, which tells browsers to stop pages from loading
# when they detect reflected cross-site scripting (XSS) attacks.
;x_xss_protection = true

# Enable adding the Content-Security-Policy header to your requests.
# CSP allows to control resources the user agent is allowed to load and helps prevent XSS attacks.
;content_security_policy = false

# Set Content Security Policy template used when adding the Content-Security-Policy header to your requests.
# $NONCE in the template includes a random nonce.
# $ROOT_PATH is server.root_url without the protocol.
;content_security_policy_template = """script-src 'self' 'unsafe-eval' 'unsafe-inline' 'strict-dynamic' $NONCE;object-src 'none';font-src 'self';style-src 'self' 'unsafe-inline' blob:;img-src * data:;base-uri 'self';connect-src 'self' grafana.com ws://$ROOT_PATH wss://$ROOT_PATH;manifest-src 'self';media-src 'none';form-action 'self';"""

#################################### Snapshots ###########################
[snapshots]
# snapshot sharing options
;external_enabled = true
;external_snapshot_url = https://snapshots-origin.raintank.io
;external_snapshot_name = Publish to snapshot.raintank.io

# Set to true to enable this Grafana instance act as an external snapshot server and allow unauthenticated requests for
# creating and deleting snapshots.
;public_mode = false

# remove expired snapshot
;snapshot_remove_expired = true

#################################### Dashboards History ##################
[dashboards]
# Number dashboard versions to keep (per dashboard). Default: 20, Minimum: 1
;versions_to_keep = 20

# Minimum dashboard refresh interval. When set, this will restrict users to set the refresh interval of a dashboard lower than given interval. Per default this is 5 seconds.
# The interval string is a possibly signed sequence of decimal numbers, followed by a unit suffix (ms, s, m, h, d), e.g. 30s or 1m.
;min_refresh_interval = 5s

# Path to the default home dashboard. If this value is empty, then Grafana uses StaticRootPath + "dashboards/home.json"
;default_home_dashboard_path =

#################################### Users ###############################
[users]
# disable user signup / registration
;allow_sign_up = true

# Allow non admin users to create organizations
;allow_org_create = true

# Set to true to automatically assign new users to the default organization (id 1)
;auto_assign_org = true

# Set this value to automatically add new users to the provided organization (if auto_assign_org above is set to true)
;auto_assign_org_id = 1

# Default role new users will be automatically assigned (if disabled above is set to true)
;auto_assign_org_role = Viewer

# Require email validation before sign up completes
;verify_email_enabled = false

# Background text for the user field on the login page
;login_hint = email or username
;password_hint = password

# Default UI theme ("dark" or "light")
;default_theme = dark

# Path to a custom home page. Users are only redirected to this if the default home dashboard is used. It should match a frontend route and contain a leading slash.
; home_page =

# External user management, these options affect the organization users view
;external_manage_link_url =
;external_manage_link_name =
;external_manage_info =

# Viewers can edit/inspect dashboard settings in the browser. But not save the dashboard.
;viewers_can_edit = false

# Editors can administrate dashboard, folders and teams they create
;editors_can_admin = false

# The duration in time a user invitation remains valid before expiring. This setting should be expressed as a duration. Examples: 6h (hours), 2d (days), 1w (week). Default is 24h (24 hours). The minimum supported duration is 15m (15 minutes).
;user_invite_max_lifetime_duration = 24h

# Enter a comma-separated list of users login to hide them in the Grafana UI. These users are shown to Grafana admins and themselves.
; hidden_users =

[auth]
# Login cookie name
;login_cookie_name = grafana_session

# The maximum lifetime (duration) an authenticated user can be inactive before being required to login at next visit. Default is 7 days (7d). This setting should be expressed as a duration, e.g. 5m (minutes), 6h (hours), 10d (days), 2w (weeks), 1M (month). The lifetime resets at each successful token rotation.
;login_maximum_inactive_lifetime_duration =

# The maximum lifetime (duration) an authenticated user can be logged in since login time before being required to login. Default is 30 days (30d). This setting should be expressed as a duration, e.g. 5m (minutes), 6h (hours), 10d (days), 2w (weeks), 1M (month).
;login_maximum_lifetime_duration =

# How often should auth tokens be rotated for authenticated users when being active. The default is each 10 minutes.
;token_rotation_interval_minutes = 10

# Set to true to disable (hide) the login form, useful if you use OAuth, defaults to false
;disable_login_form = false

# Set to true to disable the sign out link in the side menu. Useful if you use auth.proxy or auth.jwt, defaults to false
;disable_signout_menu = false

# URL to redirect the user to after sign out
;signout_redirect_url =

# Set to true to attempt login with OAuth automatically, skipping the login screen.
# This setting is ignored if multiple OAuth providers are configured.
;oauth_auto_login = false

# OAuth state max age cookie duration in seconds. Defaults to 600 seconds.
;oauth_state_cookie_max_age = 600

# limit of api_key seconds to live before expiration
;api_key_max_seconds_to_live = -1

# Set to true to enable SigV4 authentication option for HTTP-based datasources.
;sigv4_auth_enabled = false

#################################### Anonymous Auth ######################
[auth.anonymous]
# enable anonymous access
;enabled = false

# specify organization name that should be used for unauthenticated users
;org_name = Main Org.

# specify role for unauthenticated users
;org_role = Viewer

# mask the Grafana version number for unauthenticated users
;hide_version = false

#################################### GitHub Auth ##########################
[auth.github]
;enabled = false
;allow_sign_up = true
;client_id = some_id
;client_secret = some_secret
;scopes = user:email,read:org
;auth_url = https://github.com/login/oauth/authorize
;token_url = https://github.com/login/oauth/access_token
;api_url = https://api.github.com/user
;allowed_domains =
;team_ids =
;allowed_organizations =

#################################### GitLab Auth #########################
[auth.gitlab]
;enabled = false
;allow_sign_up = true
;client_id = some_id
;client_secret = some_secret
;scopes = api
;auth_url = https://gitlab.com/oauth/authorize
;token_url = https://gitlab.com/oauth/token
;api_url = https://gitlab.com/api/v4
;allowed_domains =
;allowed_groups =

#################################### Google Auth ##########################
[auth.google]
;enabled = false
;allow_sign_up = true
;client_id = some_client_id
;client_secret = some_client_secret
;scopes = https://www.googleapis.com/auth/userinfo.profile https://www.googleapis.com/auth/userinfo.email
;auth_url = https://accounts.google.com/o/oauth2/auth
;token_url = https://accounts.google.com/o/oauth2/token
;api_url = https://www.googleapis.com/oauth2/v1/userinfo
;allowed_domains =
;hosted_domain =

#################################### Grafana.com Auth ####################
[auth.grafana_com]
;enabled = false
;allow_sign_up = true
;client_id = some_id
;client_secret = some_secret
;scopes = user:email
;allowed_organizations =

#################################### Azure AD OAuth #######################
[auth.azuread]
;name = Azure AD
;enabled = false
;allow_sign_up = true
;client_id = some_client_id
;client_secret = some_client_secret
;scopes = openid email profile
;auth_url = https://login.microsoftonline.com/<tenant-id>/oauth2/v2.0/authorize
;token_url = https://login.microsoftonline.com/<tenant-id>/oauth2/v2.0/token
;allowed_domains =
;allowed_groups =

#################################### Okta OAuth #######################
[auth.okta]
;name = Okta
;enabled = false
;allow_sign_up = true
;client_id = some_id
;client_secret = some_secret
;scopes = openid profile email groups
;auth_url = https://<tenant-id>.okta.com/oauth2/v1/authorize
;token_url = https://<tenant-id>.okta.com/oauth2/v1/token
;api_url = https://<tenant-id>.okta.com/oauth2/v1/userinfo
;allowed_domains =
;allowed_groups =
;role_attribute_path =
;role_attribute_strict = false

#################################### Generic OAuth ##########################
[auth.generic_oauth]
;enabled = false
;name = OAuth
;allow_sign_up = true
;client_id = some_id
;client_secret = some_secret
;scopes = user:email,read:org
;empty_scopes = false
;email_attribute_name = email:primary
;email_attribute_path =
;login_attribute_path =
;name_attribute_path =
;id_token_attribute_name =
;auth_url = https://foo.bar/login/oauth/authorize
;token_url = https://foo.bar/login/oauth/access_token
;api_url = https://foo.bar/user
;allowed_domains =
;team_ids =
;allowed_organizations =
;role_attribute_path =
;role_attribute_strict = false
;groups_attribute_path =
;tls_skip_verify_insecure = false
;tls_client_cert =
;tls_client_key =
;tls_client_ca =

#################################### Basic Auth ##########################
[auth.basic]
;enabled = true

#################################### Auth Proxy ##########################
[auth.proxy]
;enabled = false
;header_name = X-WEBAUTH-USER
;header_property = username
;auto_sign_up = true
;sync_ttl = 60
;whitelist = 192.168.1.1, 192.168.2.1
;headers = Email:X-User-Email, Name:X-User-Name
# Read the auth proxy docs for details on what the setting below enables
;enable_login_token = false

#################################### Auth JWT ##########################
[auth.jwt]
;enabled = true
;header_name = X-JWT-Assertion
;email_claim = sub
;username_claim = sub
;jwk_set_url = https://foo.bar/.well-known/jwks.json
;jwk_set_file = /path/to/jwks.json
;cache_ttl = 60m
;expected_claims = {"aud": ["foo", "bar"]}
;key_file = /path/to/key/file

#################################### Auth LDAP ##########################
[auth.ldap]
;enabled = false
;config_file = /etc/grafana/ldap.toml
;allow_sign_up = true

# LDAP background sync (Enterprise only)
# At 1 am every day
;sync_cron = "0 0 1 * * *"
;active_sync_enabled = true

#################################### AWS ###########################
[aws]
# Enter a comma-separated list of allowed AWS authentication providers.
# Options are: default (AWS SDK Default), keys (Access && secret key), credentials (Credentials field), ec2_iam_role (EC2 IAM Role)
; allowed_auth_providers = default,keys,credentials

# Allow AWS users to assume a role using temporary security credentials.
# If true, assume role will be enabled for all AWS authentication providers that are specified in aws_auth_providers
; assume_role_enabled = true

#################################### Azure ###############################
[azure]
# Azure cloud environment where Grafana is hosted
# Possible values are AzureCloud, AzureChinaCloud, AzureUSGovernment and AzureGermanCloud
# Default value is AzureCloud (i.e. public cloud)
;cloud = AzureCloud

# Specifies whether Grafana hosted in Azure service with Managed Identity configured (e.g. Azure Virtual Machines instance)
# If enabled, the managed identity can be used for authentication of Grafana in Azure services
# Disabled by default, needs to be explicitly enabled
;managed_identity_enabled = false

# Client ID to use for user-assigned managed identity
# Should be set for user-assigned identity and should be empty for system-assigned identity
;managed_identity_client_id =

#################################### SMTP / Emailing ##########################
[smtp]
;enabled = false
;host = localhost:25
;user =
# If the password contains # or ; you have to wrap it with triple quotes. Ex """#password;"""
;password =
;cert_file =
;key_file =
;skip_verify = false
;from_address = admin@grafana.localhost
;from_name = Grafana
# EHLO identity in SMTP dialog (defaults to instance_name)
;ehlo_identity = dashboard.example.com
# SMTP startTLS policy (defaults to 'OpportunisticStartTLS')
;startTLS_policy = NoStartTLS

[emails]
;welcome_email_on_sign_up = false
;templates_pattern = emails/*.html, emails/*.txt
;content_types = text/html

#################################### Logging ##########################
[log]
# Either "console", "file", "syslog". Default is console and  file
# Use space to separate multiple modes, e.g. "console file"
;mode = console file

# Either "debug", "info", "warn", "error", "critical", default is "info"
;level = info

# optional settings to set different levels for specific loggers. Ex filters = sqlstore:debug
;filters =

# For "console" mode only
[log.console]
;level =

# log line format, valid options are text, console and json
;format = console

# For "file" mode only
[log.file]
;level =

# log line format, valid options are text, console and json
;format = text

# This enables automated log rotate(switch of following options), default is true
;log_rotate = true

# Max line number of single file, default is 1000000
;max_lines = 1000000

# Max size shift of single file, default is 28 means 1 << 28, 256MB
;max_size_shift = 28

# Segment log daily, default is true
;daily_rotate = true

# Expired days of log file(delete after max days), default is 7
;max_days = 7

[log.syslog]
;level =

# log line format, valid options are text, console and json
;format = text

# Syslog network type and address. This can be udp, tcp, or unix. If left blank, the default unix endpoints will be used.
;network =
;address =

# Syslog facility. user, daemon and local0 through local7 are valid.
;facility =

# Syslog tag. By default, the process' argv[0] is used.
;tag =

[log.frontend]
# Should Sentry javascript agent be initialized
;enabled = false

# Sentry DSN if you want to send events to Sentry.
;sentry_dsn =

# Custom HTTP endpoint to send events captured by the Sentry agent to. Default will log the events to stdout.
;custom_endpoint = /log

# Rate of events to be reported between 0 (none) and 1 (all), float
;sample_rate = 1.0

# Requests per second limit enforced an extended period, for Grafana backend log ingestion endpoint (/log).
;log_endpoint_requests_per_second_limit = 3

# Max requests accepted per short interval of time for Grafana backend log ingestion endpoint (/log).
;log_endpoint_burst_limit = 15

#################################### Usage Quotas ########################
[quota]
; enabled = false

#### set quotas to -1 to make unlimited. ####
# limit number of users per Org.
; org_user = 10

# limit number of dashboards per Org.
; org_dashboard = 100

# limit number of data_sources per Org.
; org_data_source = 10

# limit number of api_keys per Org.
; org_api_key = 10

# limit number of alerts per Org.
;org_alert_rule = 100

# limit number of orgs a user can create.
; user_org = 10

# Global limit of users.
; global_user = -1

# global limit of orgs.
; global_org = -1

# global limit of dashboards
; global_dashboard = -1

# global limit of api_keys
; global_api_key = -1

# global limit on number of logged in users.
; global_session = -1

# global limit of alerts
;global_alert_rule = -1

#################################### Alerting ############################
[alerting]
# Disable alerting engine & UI features
;enabled = true
# Makes it possible to turn off alert rule execution but alerting UI is visible
;execute_alerts = true

# Default setting for new alert rules. Defaults to categorize error and timeouts as alerting. (alerting, keep_state)
;error_or_timeout = alerting

# Default setting for how Grafana handles nodata or null values in alerting. (alerting, no_data, keep_state, ok)
;nodata_or_nullvalues = no_data

# Alert notifications can include images, but rendering many images at the same time can overload the server
# This limit will protect the server from render overloading and make sure notifications are sent out quickly
;concurrent_render_limit = 5


# Default setting for alert calculation timeout. Default value is 30
;evaluation_timeout_seconds = 30

# Default setting for alert notification timeout. Default value is 30
;notification_timeout_seconds = 30

# Default setting for max attempts to sending alert notifications. Default value is 3
;max_attempts = 3

# Makes it possible to enforce a minimal interval between evaluations, to reduce load on the backend
;min_interval_seconds = 1

# Configures for how long alert annotations are stored. Default is 0, which keeps them forever.
# This setting should be expressed as a duration. Examples: 6h (hours), 10d (days), 2w (weeks), 1M (month).
;max_annotation_age =

# Configures max number of alert annotations that Grafana stores. Default value is 0, which keeps all alert annotations.
;max_annotations_to_keep =

#################################### Annotations #########################
[annotations]
# Configures the batch size for the annotation clean-up job. This setting is used for dashboard, API, and alert annotations.
;cleanupjob_batchsize = 100

[annotations.dashboard]
# Dashboard annotations means that annotations are associated with the dashboard they are created on.

# Configures how long dashboard annotations are stored. Default is 0, which keeps them forever.
# This setting should be expressed as a duration. Examples: 6h (hours), 10d (days), 2w (weeks), 1M (month).
;max_age =

# Configures max number of dashboard annotations that Grafana stores. Default value is 0, which keeps all dashboard annotations.
;max_annotations_to_keep =

[annotations.api]
# API annotations means that the annotations have been created using the API without any
# association with a dashboard.

# Configures how long Grafana stores API annotations. Default is 0, which keeps them forever.
# This setting should be expressed as a duration. Examples: 6h (hours), 10d (days), 2w (weeks), 1M (month).
;max_age =

# Configures max number of API annotations that Grafana keeps. Default value is 0, which keeps all API annotations.
;max_annotations_to_keep =

#################################### Explore #############################
[explore]
# Enable the Explore section
;enabled = true

#################################### Internal Grafana Metrics ##########################
# Metrics available at HTTP API Url /metrics
[metrics]
# Disable / Enable internal metrics
;enabled           = true
# Graphite Publish interval
;interval_seconds  = 10
# Disable total stats (stat_totals_*) metrics to be generated
;disable_total_stats = false

#If both are set, basic auth will be required for the metrics endpoint.
; basic_auth_username =
; basic_auth_password =

# Metrics environment info adds dimensions to the `grafana_environment_info` metric, which
# can expose more information about the Grafana instance.
[metrics.environment_info]
#exampleLabel1 = exampleValue1
#exampleLabel2 = exampleValue2

# Send internal metrics to Graphite
[metrics.graphite]
# Enable by setting the address setting (ex localhost:2003)
;address =
;prefix = prod.grafana.%(instance_name)s.

#################################### Grafana.com integration  ##########################
# Url used to import dashboards directly from Grafana.com
[grafana_com]
;url = https://grafana.com

#################################### Distributed tracing ############
[tracing.jaeger]
# Enable by setting the address sending traces to jaeger (ex localhost:6831)
;address = localhost:6831
# Tag that will always be included in when creating new spans. ex (tag1:value1,tag2:value2)
;always_included_tag = tag1:value1
# Type specifies the type of the sampler: const, probabilistic, rateLimiting, or remote
;sampler_type = const
# jaeger samplerconfig param
# for "const" sampler, 0 or 1 for always false/true respectively
# for "probabilistic" sampler, a probability between 0 and 1
# for "rateLimiting" sampler, the number of spans per second
# for "remote" sampler, param is the same as for "probabilistic"
# and indicates the initial sampling rate before the actual one
# is received from the mothership
;sampler_param = 1
# sampling_server_url is the URL of a sampling manager providing a sampling strategy.
;sampling_server_url =
# Whether or not to use Zipkin propagation (x-b3- HTTP headers).
;zipkin_propagation = false
# Setting this to true disables shared RPC spans.
# Not disabling is the most common setting when using Zipkin elsewhere in your infrastructure.
;disable_shared_zipkin_spans = false

#################################### External image storage ##########################
[external_image_storage]
# Used for uploading images to public servers so they can be included in slack/email messages.
# you can choose between (s3, webdav, gcs, azure_blob, local)
;provider =

[external_image_storage.s3]
;endpoint =
;path_style_access =
;bucket =
;region =
;path =
;access_key =
;secret_key =

[external_image_storage.webdav]
;url =
;public_url =
;username =
;password =

[external_image_storage.gcs]
;key_file =
;bucket =
;path =

[external_image_storage.azure_blob]
;account_name =
;account_key =
;container_name =

[external_image_storage.local]
# does not require any configuration

[rendering]
# Options to configure a remote HTTP image rendering service, e.g. using https://github.com/grafana/grafana-image-renderer.
# URL to a remote HTTP image renderer service, e.g. http://localhost:8081/render, will enable Grafana to render panels and dashboards to PNG-images using HTTP requests to an external service.
;server_url =
# If the remote HTTP image renderer service runs on a different server than the Grafana server you may have to configure this to a URL where Grafana is reachable, e.g. http://grafana.domain/.
;callback_url =
# Concurrent render request limit affects when the /render HTTP endpoint is used. Rendering many images at the same time can overload the server,
# which this setting can help protect against by only allowing a certain amount of concurrent requests.
;concurrent_render_request_limit = 30

[panels]
# If set to true Grafana will allow script tags in text panels. Not recommended as it enable XSS vulnerabilities.
;disable_sanitize_html = false

[plugins]
;enable_alpha = false
;app_tls_skip_verify_insecure = false
# Enter a comma-separated list of plugin identifiers to identify plugins to load even if they are unsigned. Plugins with modified signatures are never loaded.
;allow_loading_unsigned_plugins =
# Enable or disable installing plugins directly from within Grafana.
;plugin_admin_enabled = false
;plugin_admin_external_manage_enabled = false
;plugin_catalog_url = https://grafana.com/grafana/plugins/

#################################### Grafana Live ##########################################
[live]
# max_connections to Grafana Live WebSocket endpoint per Grafana server instance. See Grafana Live docs
# if you are planning to make it higher than default 100 since this can require some OS and infrastructure
# tuning. 0 disables Live, -1 means unlimited connections.
;max_connections = 100

# allowed_origins is a comma-separated list of origins that can establish connection with Grafana Live.
# If not set then origin will be matched over root_url. Supports wildcard symbol "*".
;allowed_origins =

# engine defines an HA (high availability) engine to use for Grafana Live. By default no engine used - in
# this case Live features work only on a single Grafana server. Available options: "redis".
# Setting ha_engine is an EXPERIMENTAL feature.
;ha_engine =

# ha_engine_address sets a connection address for Live HA engine. Depending on engine type address format can differ.
# For now we only support Redis connection address in "host:port" format.
# This option is EXPERIMENTAL.
;ha_engine_address = "127.0.0.1:6379"

#################################### Grafana Image Renderer Plugin ##########################
[plugin.grafana-image-renderer]
# Instruct headless browser instance to use a default timezone when not provided by Grafana, e.g. when rendering panel image of alert.
# See ICU’s metaZones.txt (https://cs.chromium.org/chromium/src/third_party/icu/source/data/misc/metaZones.txt) for a list of supported
# timezone IDs. Fallbacks to TZ environment variable if not set.
;rendering_timezone =

# Instruct headless browser instance to use a default language when not provided by Grafana, e.g. when rendering panel image of alert.
# Please refer to the HTTP header Accept-Language to understand how to format this value, e.g. 'fr-CH, fr;q=0.9, en;q=0.8, de;q=0.7, *;q=0.5'.
;rendering_language =

# Instruct headless browser instance to use a default device scale factor when not provided by Grafana, e.g. when rendering panel image of alert.
# Default is 1. Using a higher value will produce more detailed images (higher DPI), but will require more disk space to store an image.
;rendering_viewport_device_scale_factor =

# Instruct headless browser instance whether to ignore HTTPS errors during navigation. Per default HTTPS errors are not ignored. Due to
# the security risk it's not recommended to ignore HTTPS errors.
;rendering_ignore_https_errors =

# Instruct headless browser instance whether to capture and log verbose information when rendering an image. Default is false and will
# only capture and log error messages. When enabled, debug messages are captured and logged as well.
# For the verbose information to be included in the Grafana server log you have to adjust the rendering log level to debug, configure
# [log].filter = rendering:debug.
;rendering_verbose_logging =

# Instruct headless browser instance whether to output its debug and error messages into running process of remote rendering service.
# Default is false. This can be useful to enable (true) when troubleshooting.
;rendering_dumpio =

# Additional arguments to pass to the headless browser instance. Default is --no-sandbox. The list of Chromium flags can be found
# here (https://peter.sh/experiments/chromium-command-line-switches/). Multiple arguments is separated with comma-character.
;rendering_args =

# You can configure the plugin to use a different browser binary instead of the pre-packaged version of Chromium.
# Please note that this is not recommended, since you may encounter problems if the installed version of Chrome/Chromium is not
# compatible with the plugin.
;rendering_chrome_bin =

# Instruct how headless browser instances are created. Default is 'default' and will create a new browser instance on each request.
# Mode 'clustered' will make sure that only a maximum of browsers/incognito pages can execute concurrently.
# Mode 'reusable' will have one browser instance and will create a new incognito page on each request.
;rendering_mode =

# When rendering_mode = clustered you can instruct how many browsers or incognito pages can execute concurrently. Default is 'browser'
# and will cluster using browser instances.
# Mode 'context' will cluster using incognito pages.
;rendering_clustering_mode =
# When rendering_mode = clustered you can define maximum number of browser instances/incognito pages that can execute concurrently..
;rendering_clustering_max_concurrency =

# Limit the maximum viewport width, height and device scale factor that can be requested.
;rendering_viewport_max_width =
;rendering_viewport_max_height =
;rendering_viewport_max_device_scale_factor =

# Change the listening host and port of the gRPC server. Default host is 127.0.0.1 and default port is 0 and will automatically assign
# a port not in use.
;grpc_host =
;grpc_port =

[enterprise]
# Path to a valid Grafana Enterprise license.jwt file
;license_path =

[feature_toggles]
# enable features, separated by spaces
;enable =

[date_formats]
# For information on what formatting patterns that are supported https://momentjs.com/docs/#/displaying/

# Default system date format used in time range picker and other places where full time is displayed
;full_date = YYYY-MM-DD HH:mm:ss

# Used by graph and other places where we only show small intervals
;interval_second = HH:mm:ss
;interval_minute = HH:mm
;interval_hour = MM/DD HH:mm
;interval_day = MM/DD
;interval_month = YYYY-MM
;interval_year = YYYY

# Experimental feature
;use_browser_locale = false

# Default timezone for user preferences. Options are 'browser' for the browser local timezone or a timezone name from IANA Time Zone database, e.g. 'UTC' or 'Europe/Amsterdam' etc.
;default_timezone = browser

[expressions]
# Enable or disable the expressions functionality.
;enabled = true

[geomap]
# Set the JSON configuration for the default basemap
;default_baselayer_config = `{
;  "type": "xyz",
;  "config": {
;    "attribution": "Open street map",
;    "url": "https://tile.openstreetmap.org/{z}/{x}/{y}.png"
;  }
;}`

# Enable or disable loading other base map layers
;enable_custom_baselayers = true
访问
http://ip:9106
admin/hancloud1234
注意防火墙或安全组开放端口
Alertmanager
- Alertmanager 主要用于接收 Prometheus 发送的告警信息,它支持丰富的告警通知渠道,例如邮件、微信、钉钉、Slack 等常用沟通工具,而且很容易做到告警信息进行去重,降噪,分组等,是一款很好用的告警通知系统。
docker-compose 方式启动
version: '3'
services:
  # prometheus
  prometheus:
    image: prom/prometheus:latest
    hostname: prometheus
    container_name: prometheus
    restart: always
    ports:
     - "9090:9090"
    volumes:
     - $PWD/prometheus:/etc/prometheus
     - $PWD/prometheus/data:/prometheus
    privileged: true
    command:
     - '--config.file=/etc/prometheus/prometheus.yml'
     - '--web.console.libraries=/etc/prometheus/console_libraries'
     - '--web.console.templates=/etc/prometheus/consoles'
     - '--storage.tsdb.path=/prometheus'
     - '--web.enable-lifecycle'

  # node-exporter
  node-exporter:
    image: prom/node-exporter:latest
    hostname: node-exporter
    container_name: node-exporter
    restart: always
    ports:
     - "9190:9100"
    volumes:
     - /proc:/host/proc:ro
     - /sys:/host/sys:ro
     - /:/rootfs:ro
    privileged: true
    command:
     - '--path.procfs=/host/proc'
     - '--path.rootfs=/rootfs'
     - '--path.sysfs=/host/sys'
     - '--collector.filesystem.mount-points-exclude=^/(sys|proc|dev|host|etc)($$|/)'

  # mysqld-exporter
  mysqld-exporter:
    image: prom/mysqld-exporter:latest
    hostname: mysqld-exporter
    container_name: mysqld-exporter
    restart: always
    environment:
      - DATA_SOURCE_NAME=prometheus:hcloud1234@(192.168.0.229:43306)/
    ports:
     - "9104:9104"
    privileged: true

  # cadvisor
  cadvisor:
    image: google/cadvisor:latest
    hostname: cadvisor
    container_name: cadvisor
    restart: always
    volumes:
     - /sys:/sys:ro
     - /var/run:/var/run:rw
     - /:/rootfs:ro
     - /dev/disk/:/dev/disk:ro
     - /home/docker:/var/lib/docker:ro
    ports:
     - "9105:8080"

  # grafana
  grafana:
    image: grafana/grafana:latest
    hostname: grafana
    container_name: grafana
    restart: always
    environment:
     - GF_SERVER_ROOT_URL=https://192.168.0.100:9106
     - GF_SECURITY_ADMIN_PASSWORD=hancloud1234
    volumes:
     - $PWD/plugins/grafana/data:/var/lib/grafana
     - $PWD/plugins/grafana/grafana.ini:/etc/grafana/grafana.ini
    ports:
     - "9106:3000"

  # alertmanager
  alertmanager:
    image: prom/alertmanager:latest
    hostname: alertmanager
    container_name: alertmanager
    restart: always
    volumes:
     - $PWD/plugins/alertmanager/alertmanager.yml:/etc/alertmanager/alertmanager.yml
     - $PWD/plugins/alertmanager/data:/etc/alertmanager/data
     - $PWD/plugins/alertmanager/templates:/etc/alertmanager/templates
    ports:
     - "9107:9093"
    command:
     - '--config.file=/etc/alertmanager/alertmanager.yml'
     - '--storage.path=/etc/alertmanager/data'
alertmanager.yml 配置文件
route:
  group_by: ['alertname']
  group_wait: 30s
  group_interval: 5m
  repeat_interval: 1h
  receiver: 'web.hook'
receivers:
- name: 'web.hook'
  webhook_configs:
  - url: 'http://127.0.0.1:5001/'
inhibit_rules:
  - source_match:
      severity: 'critical'
    target_match:
      severity: 'warning'
    equal: ['alertname', 'dev', 'instance']
对接企业微信告警
配置alertmanager.yml
替换如下:
global:
  # 在没有报警的情况下声明为已解决的时间
  resolve_timeout: 5m

templates:
  # 告警模板文件
  - "/etc/alertmanager/templates/wechat.tmpl"

route:
  # 接收到告警后到自定义分组
  group_by: ["alertname"]
  # 分组创建后初始化等待时长
  group_wait: 10s
  # 告警信息发送之前的等待时长
  group_interval: 30s
  # 重复报警的间隔时长
  repeat_interval: 5m
  # 默认消息接收
  receiver: "wechat"

receivers:
  # 微信
  - name: "wechat"
    wechat_configs:
      # 是否发送恢复信息
      - send_resolved: true
        # 填写应用 AgentId
        agent_id: "1000073"
        # 填写应用 Secret
        api_secret: "bJMaKf_51FGi_8YzZob-7wfyh5vPs5jXLec1ZF2u-Zg"
        # 填写企业 ID
        corp_id: "ww9b984c07156da054"
        # 填写接收消息的群体,可以写@all,也可以写具体帐号名
        to_user: "LiJian"
创建wechat.tmpl文件
在$PWD/plugins/alertmanager/templates目录下创建wechat.tmpl,内容如下:
{{ define "wechat.default.message" }}
{{- if gt (len .Alerts.Firing) 0 -}}
{{- range $index, $alert := .Alerts -}}
{{- if eq $index 0 -}}
==========告警通知==========
告警类型: {{ $alert.Labels.alertname }}
告警状态: {{ $alert.Status }}
告警级别: {{ $alert.Labels.level }}
{{- end }}
==========告警详情==========
告警主题: {{ $alert.Annotations.summary }}
告警详情: {{ $alert.Annotations.description }}
故障时间: {{ $alert.StartsAt.Local }}
{{ if gt (len $alert.Labels.instance) 0 -}}故障实例: {{ $alert.Labels.instance }}{{- end -}}
{{- end }}
{{- end }}

{{- if gt (len .Alerts.Resolved) 0 -}}
{{- range $index, $alert := .Alerts -}}
{{- if eq $index 0 -}}
==========恢复通知==========
告警类型: {{ $alert.Labels.alertname }}
告警状态: {{ $alert.Status }}
告警级别: {{ $alert.Labels.level }}
{{- end }}
==========恢复详情==========
告警主题: {{ $alert.Annotations.summary }}
告警详情: {{ $alert.Annotations.description }}
故障时间: {{ $alert.StartsAt.Local }}
恢复时间: {{ $alert.EndsAt.Local }}
{{ if gt (len $alert.Labels.instance) 0 -}}故障实例: {{ $alert.Labels.instance }}{{- end -}}
{{- end }}
{{- end }}
{{- end }}
创建alert_rules.yml文件
在$PWD/prometheus/rules文件夹根目录增加alert_rules.yml配置文件,内容如下:
groups:
  - name: alert_rules
    rules:
      - alert: CpuUsageAlertWarning
        expr: sum(avg(irate(node_cpu_seconds_total{mode!='idle'}[5m])) without (cpu)) by (instance) > 0.60
        for: 2m
        labels:
          level: warning
        annotations:
          summary: "Instance {{ $labels.instance }} CPU usage high"
          description: "{{ $labels.instance }} CPU usage above 60% (current value: {{ $value }})"
      - alert: CpuUsageAlertSerious
        #expr: sum(avg(irate(node_cpu_seconds_total{mode!='idle'}[5m])) without (cpu)) by (instance) > 0.85
        expr: (100 - (avg by (instance) (irate(node_cpu_seconds_total{job=~".*",mode="idle"}[5m])) * 100)) > 85
        for: 3m
        labels:
          level: serious
        annotations:
          summary: "Instance {{ $labels.instance }} CPU usage high"
          description: "{{ $labels.instance }} CPU usage above 85% (current value: {{ $value }})"
      - alert: MemUsageAlertWarning
        expr: avg by(instance) ((1 - (node_memory_MemFree_bytes + node_memory_Buffers_bytes + node_memory_Cached_bytes) / node_memory_MemTotal_bytes) * 100) > 70
        for: 2m
        labels:
          level: warning
        annotations:
          summary: "Instance {{ $labels.instance }} MEM usage high"
          description: "{{$labels.instance}}: MEM usage is above 70% (current value is: {{ $value }})"
      - alert: MemUsageAlertSerious
        expr: (node_memory_MemTotal_bytes - node_memory_MemAvailable_bytes)/node_memory_MemTotal_bytes > 0.90
        for: 3m
        labels:
          level: serious
        annotations:
          summary: "Instance {{ $labels.instance }} MEM usage high"
          description: "{{ $labels.instance }} MEM usage above 90% (current value: {{ $value }})"
      - alert: DiskUsageAlertWarning
        expr: (1 - node_filesystem_free_bytes{fstype!="rootfs",mountpoint!="",mountpoint!~"/(run|var|sys|dev).*"} / node_filesystem_size_bytes) * 100 > 80
        for: 2m
        labels:
          level: warning
        annotations:
          summary: "Instance {{ $labels.instance }} Disk usage high"
          description: "{{$labels.instance}}: Disk usage is above 80% (current value is: {{ $value }})"
      - alert: DiskUsageAlertSerious
        expr: (1 - node_filesystem_free_bytes{fstype!="rootfs",mountpoint!="",mountpoint!~"/(run|var|sys|dev).*"} / node_filesystem_size_bytes) * 100 > 90
        for: 3m
        labels:
          level: serious
        annotations:
          summary: "Instance {{ $labels.instance }} Disk usage high"
          description: "{{$labels.instance}}: Disk usage is above 90% (current value is: {{ $value }})"
      - alert: NodeFileDescriptorUsage
        expr: avg by (instance) (node_filefd_allocated{} / node_filefd_maximum{}) * 100 > 60
        for: 2m
        labels:
          level: warning
        annotations:
          summary: "Instance {{ $labels.instance }} File Descriptor usage high"
          description: "{{$labels.instance}}: File Descriptor usage is above 60% (current value is: {{ $value }})"
      - alert: NodeLoad15
        expr: avg by (instance) (node_load15{}) > 80
        for: 2m
        labels:
          level: warning
        annotations:
          summary: "Instance {{ $labels.instance }} Load15 usage high"
          description: "{{$labels.instance}}: Load15 is above 80 (current value is: {{ $value }})"
      - alert: NodeAgentStatus
        expr: avg by (instance) (up{}) == 0
        for: 2m
        labels:
          level: warning
        annotations:
          summary: "{{$labels.instance}}: has been down"
          description: "{{$labels.instance}}: Node_Exporter Agent is down (current value is: {{ $value }})"
      - alert: NodeProcsBlocked
        expr: avg by (instance) (node_procs_blocked{}) > 10
        for: 2m
        labels:
          level: warning
        annotations:
          summary: "Instance {{ $labels.instance }}  Process Blocked usage high"
          description: "{{$labels.instance}}: Node Blocked Procs detected! above 10 (current value is: {{ $value }})"
      - alert: NetworkTransmitRate
        #expr:  avg by (instance) (floor(irate(node_network_transmit_bytes_total{device="ens192"}[2m]) / 1024 / 1024)) > 50
        expr:  avg by (instance) (floor(irate(node_network_transmit_bytes_total{}[2m]) / 1024 / 1024 * 8 )) > 40
        for: 1m
        labels:
          level: warning
        annotations:
          summary: "Instance {{ $labels.instance }} Network Transmit Rate usage high"
          description: "{{$labels.instance}}: Node Transmit Rate (Upload) is above 40Mbps/s (current value is: {{ $value }}Mbps/s)"
      - alert: NetworkReceiveRate
        #expr:  avg by (instance) (floor(irate(node_network_receive_bytes_total{device="ens192"}[2m]) / 1024 / 1024)) > 50
        expr:  avg by (instance) (floor(irate(node_network_receive_bytes_total{}[2m]) / 1024 / 1024 * 8 )) > 40
        for: 1m
        labels:
          level: warning
        annotations:
          summary: "Instance {{ $labels.instance }} Network Receive Rate usage high"
          description: "{{$labels.instance}}: Node Receive Rate (Download) is above 40Mbps/s (current value is: {{ $value }}Mbps/s)"
      - alert: DiskReadRate
        expr: avg by (instance) (floor(irate(node_disk_read_bytes_total{}[2m]) / 1024 )) > 200
        for: 2m
        labels:
          level: warning
        annotations:
          summary: "Instance {{ $labels.instance }} Disk Read Rate usage high"
          description: "{{$labels.instance}}: Node Disk Read Rate is above 200KB/s (current value is: {{ $value }}KB/s)"
      - alert: DiskWriteRate
        expr: avg by (instance) (floor(irate(node_disk_written_bytes_total{}[2m]) / 1024 / 1024 )) > 20
        for: 2m
        labels:
          level: warning
        annotations:
          summary: "Instance {{ $labels.instance }} Disk Write Rate usage high"
          description: "{{$labels.instance}}: Node Disk Write Rate is above 20MB/s (current value is: {{ $value }}MB/s)"
修改prometheys.yaml
相关信息如下:
global:
  scrape_interval:     15s
  evaluation_interval: 15s

alerting:
  alertmanagers:
  - static_configs:
    # alertmanager服务地址
    - targets: ['xxx.xxx.xxx.xxx:9107']

rule_files:
  - "rules/alert_rules.yml"
完整配置如下:
# my global config
global:
  scrape_interval:     15s # Set the scrape interval to every 15 seconds. Default is every 1 minute.
  evaluation_interval: 15s # Evaluate rules every 15 seconds. The default is every 1 minute.
  # scrape_timeout is set to the global default (10s).

# Alertmanager configuration
alerting:
  alertmanagers:
  - static_configs:
    - targets:
       - 192.168.0.100:9107

# Load rules once and periodically evaluate them according to the global 'evaluation_interval'.
rule_files:
  - "rules/alert_rules.yml"
  # - "first_rules.yml"
  # - "second_rules.yml"

# A scrape configuration containing exactly one endpoint to scrape:
# Here it's Prometheus itself.
scrape_configs:
  # The job name is added as a label `job=<job_name>` to any timeseries scraped from this config.
  - job_name: 'prometheus'
    static_configs:
    - targets: ['192.168.0.100:9090']
  - job_name: 'linux'
    static_configs:
    - targets: ['192.168.0.100:9190']
      labels:
        instance: localhost
  - job_name: mysql
    static_configs:
    - targets: ['192.168.0.100:9104']
      labels:
        instance: mysqld-exporter
  - job_name: docker
    static_configs:
    - targets: ['192.168.0.100:9105']
redis_exporter
https://github.com/oliver006/redis_exporter
用于监控redis使用情况
docker-compose 方式启动
version: '3'
services:
  # prometheus
  prometheus:
    image: prom/prometheus:latest
    hostname: prometheus
    container_name: prometheus
    restart: always
    ports:
     - "9090:9090"
    volumes:
     - $PWD/prometheus:/etc/prometheus
     - $PWD/prometheus/data:/prometheus
    privileged: true
    command:
     - '--config.file=/etc/prometheus/prometheus.yml'
     - '--web.console.libraries=/etc/prometheus/console_libraries'
     - '--web.console.templates=/etc/prometheus/consoles'
     - '--storage.tsdb.path=/prometheus'
     - '--web.enable-lifecycle'

  # node-exporter
  node-exporter:
    image: prom/node-exporter:latest
    hostname: node-exporter
    container_name: node-exporter
    restart: always
    ports:
     - "9190:9100"
    volumes:
     - /proc:/host/proc:ro
     - /sys:/host/sys:ro
     - /:/rootfs:ro
    privileged: true
    command:
     - '--path.procfs=/host/proc'
     - '--path.rootfs=/rootfs'
     - '--path.sysfs=/host/sys'
     - '--collector.filesystem.mount-points-exclude=^/(sys|proc|dev|host|etc)($$|/)'

  # mysqld-exporter
  mysqld-exporter:
    image: prom/mysqld-exporter:latest
    hostname: mysqld-exporter
    container_name: mysqld-exporter
    restart: always
    environment:
      - DATA_SOURCE_NAME=prometheus:hcloud1234@(192.168.0.229:43306)/
    ports:
     - "9104:9104"
    privileged: true

  # cadvisor
  cadvisor:
    image: google/cadvisor:latest
    hostname: cadvisor
    container_name: cadvisor
    restart: always
    volumes:
     - /sys:/sys:ro
     - /var/run:/var/run:rw
     - /:/rootfs:ro
     - /dev/disk/:/dev/disk:ro
     - /home/docker:/var/lib/docker:ro
    ports:
     - "9105:8080"

  # grafana
  grafana:
    image: grafana/grafana:latest
    hostname: grafana
    container_name: grafana
    restart: always
    environment:
     - GF_SERVER_ROOT_URL=https://192.168.0.100:9106
     - GF_SECURITY_ADMIN_PASSWORD=hancloud1234
    volumes:
     - $PWD/plugins/grafana/data:/var/lib/grafana
     - $PWD/plugins/grafana/grafana.ini:/etc/grafana/grafana.ini
    ports:
     - "9106:3000"

  # alertmanager
  alertmanager:
    image: prom/alertmanager:latest
    hostname: alertmanager
    container_name: alertmanager
    restart: always
    volumes:
     - $PWD/plugins/alertmanager/alertmanager.yml:/etc/alertmanager/alertmanager.yml
     - $PWD/plugins/alertmanager/data:/etc/alertmanager/data
     - $PWD/plugins/alertmanager/templates:/etc/alertmanager/templates
    ports:
     - "9107:9093"
    command:
     - '--config.file=/etc/alertmanager/alertmanager.yml'
     - '--storage.path=/etc/alertmanager/data'

  # redis_exporter
  redis_exporter:
    image: oliver006/redis_exporter:latest
    hostname: redis_exporter
    container_name: redis_exporter
    restart: always
    ports:
     - "9108:9121"
    environment:
     - REDIS_ADDR=redis://192.168.0.229:46379
     # 注意密码,!会产生不解释行为导致无法执行
     - REDIS_PASSWORD=hcloud1234!@#$
     - TZ=Asia/Shanghai
prometheus_2131">对接prometheus
配置 prometheus.yml,新增 scrape_configs[4].job_name
scrape_configs:
  - job_name: 'redis_exporter'
    static_configs:
    - targets: ['xxx.xxx.xxx.xxx:9108']
完整配置如下:
# my global config
global:
  scrape_interval:     15s # Set the scrape interval to every 15 seconds. Default is every 1 minute.
  evaluation_interval: 15s # Evaluate rules every 15 seconds. The default is every 1 minute.
  # scrape_timeout is set to the global default (10s).

# Alertmanager configuration
alerting:
  alertmanagers:
  - static_configs:
    - targets:
       - 192.168.0.100:9107

# Load rules once and periodically evaluate them according to the global 'evaluation_interval'.
rule_files:
  - "rules/alert_rules.yml"
  # - "first_rules.yml"
  # - "second_rules.yml"

# A scrape configuration containing exactly one endpoint to scrape:
# Here it's Prometheus itself.
scrape_configs:
  # The job name is added as a label `job=<job_name>` to any timeseries scraped from this config.
  - job_name: prometheus
    static_configs:
    - targets: ['192.168.0.100:9090']
  - job_name: linux
    static_configs:
    - targets: ['192.168.0.100:9190']
      labels:
        instance: localhost
  - job_name: mysql
    static_configs:
    - targets: ['192.168.0.100:9104']
      labels:
        instance: mysqld-exporter
  - job_name: docker
    static_configs:
    - targets: ['192.168.0.100:9105']
  - job_name: redis_exporter
    static_configs:
    - targets: ['192.168.0.100:9108']
对接SCSDM
主要监控,jvm及系统运行信息、hikiriCP(还未接入)
开启actuator
引入依赖
        <!-- Tag-应用监控埋点actuator-->
        <dependency>
            <groupId>org.springframework.boot</groupId>
            <artifactId>spring-boot-starter-actuator</artifactId>
        </dependency>
        <!-- Tag-应用监控埋点actuator-->
		<!-- Tag-将actuator监控的指标转为prometheus格式-->
        <dependency>
            <groupId>io.micrometer</groupId>
            <artifactId>micrometer-registry-prometheus</artifactId>
            <version>1.7.1</version>
        </dependency>
  		<dependency>
            <groupId>io.micrometer</groupId>
            <artifactId>micrometer-core</artifactId>
            <version>1.7.1</version>
        </dependency>
        <dependency>
            <groupId>io.github.mweirauch</groupId>
            <artifactId>micrometer-jvm-extras</artifactId>
            <version>0.1.2</version>
        </dependency>
        <!-- Tag-将actuator监控的指标转为prometheus格式-->
bootstrap.yml 配置
management:
  endpoints:
    web:
      exposure:
        include: "*"
        exclude: env,beans
  endpoint:
    metrics:
      enabled: true
    prometheus:
      enabled: true
  metrics:
    tags:
      application: ${spring.application.name}
    export:
      prometheus:
        enabled: true
多数据源监控
pom修改dynamic-datasource-spring-boot-starter版本
  <dependency>
            <groupId>com.baomidou</groupId>
            <artifactId>dynamic-datasource-spring-boot-starter</artifactId>
            <version>3.4.1</version>
        </dependency>
增加重写配置,重写这个类的方法,在自己项目路径下创建org.springframework.boot.actuate.autoconfigure.metrics.jdbc包,在此包创建HikariDataSourceMetricsPostProcessor,
/*
 * Copyright 2012-2018 the original author or authors.
 *
 * Licensed under the Apache License, Version 2.0 (the "License");
 * you may not use this file except in compliance with the License.
 * You may obtain a copy of the License at
 *
 *      http://www.apache.org/licenses/LICENSE-2.0
 *
 * Unless required by applicable law or agreed to in writing, software
 * distributed under the License is distributed on an "AS IS" BASIS,
 * WITHOUT WARRANTIES OR CONDITIONS OF ANY KIND, either express or implied.
 * See the License for the specific language governing permissions and
 * limitations under the License.
 */

package org.springframework.boot.actuate.autoconfigure.metrics.jdbc;

import javax.sql.DataSource;

import com.baomidou.dynamic.datasource.DynamicRoutingDataSource;
import com.zaxxer.hikari.HikariDataSource;
import com.zaxxer.hikari.metrics.micrometer.MicrometerMetricsTrackerFactory;
import io.micrometer.core.instrument.MeterRegistry;
import org.apache.commons.logging.Log;
import org.apache.commons.logging.LogFactory;

import org.springframework.beans.factory.config.BeanPostProcessor;
import org.springframework.boot.jdbc.DataSourceUnwrapper;
import org.springframework.context.ApplicationContext;
import org.springframework.core.Ordered;

import java.util.Map;

/**
 * {@link BeanPostProcessor} that configures Hikari metrics. Such arrangement is necessary
 * because a {@link HikariDataSource} instance cannot be modified once its configuration
 * has completed.
 *
 * @author Stephane Nicoll
 */
class HikariDataSourceMetricsPostProcessor implements BeanPostProcessor, Ordered {

    private static final Log logger = LogFactory
            .getLog(HikariDataSourceMetricsPostProcessor.class);

    private final ApplicationContext context;

    private volatile MeterRegistry meterRegistry;

    HikariDataSourceMetricsPostProcessor(ApplicationContext context) {
        this.context = context;
    }

    @Override
    public Object postProcessAfterInitialization(Object bean, String beanName) {
        HikariDataSource hikariDataSource = determineHikariDataSource(bean);
        if (hikariDataSource != null) {
            Map<String, DataSource> dataSourceMap = ((DynamicRoutingDataSource) bean).getDataSources();
            for(String key: dataSourceMap.keySet()){
                HikariDataSource dataSource = determineHikariDataSource(dataSourceMap.get(key));
                bindMetricsRegistryToHikariDataSource(getMeterRegistry(), dataSource );
            }
        }
        return bean;
    }

    private HikariDataSource determineHikariDataSource(Object bean) {
        if (bean instanceof DataSource) {
            return DataSourceUnwrapper.unwrap((DataSource) bean, HikariDataSource.class);
        }
        return null;
    }

    private void bindMetricsRegistryToHikariDataSource(MeterRegistry registry,
                                                       HikariDataSource dataSource) {
        if (!hasExisingMetrics(dataSource)) {
            try {
                dataSource.setMetricsTrackerFactory(
                        new MicrometerMetricsTrackerFactory(registry));
            }
            catch (Exception ex) {
                logger.warn("Failed to bind Hikari metrics: " + ex.getMessage());
            }
        }
    }

    private boolean hasExisingMetrics(HikariDataSource dataSource) {
        return dataSource.getMetricRegistry() != null
                || dataSource.getMetricsTrackerFactory() != null;
    }

    private MeterRegistry getMeterRegistry() {
        if (this.meterRegistry == null) {
            this.meterRegistry = this.context.getBean(MeterRegistry.class);
        }
        return this.meterRegistry;
    }

    @Override
    public int getOrder() {
        return Ordered.HIGHEST_PRECEDENCE;
    }

}
多模块导入的情况下,该方法失效,就再将DataSourcePoolMetricsAutoConfiguration进行重写 ,在加个注解 @Primary
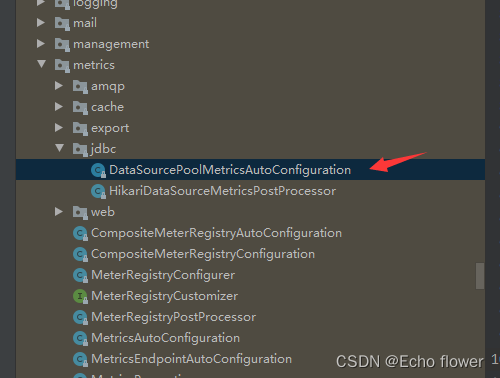
prometheus_2377">pushgateway 推送应用信息到prometheus
pom增加
   <dependency>
            <groupId>io.prometheus</groupId>
            <artifactId>simpleclient_pushgateway</artifactId>
            <version>0.11.0</version>
        </dependency>
yml
management:
  endpoints:
    web:
      exposure:
        include: "*"
        exclude: env,beans
  endpoint:
    metrics:
      enabled: true
    prometheus:
      enabled: true
  metrics:
    tags:
      application: ${spring.application.name}
    export:
      prometheus:
        pushgateway:
          #PUSHGATEWAY address
          baseUrl: 192.168.0.100:9091
          # Push cycle
          pushRate: 15s
          #job definition name
          job : ${spring.application.name}
          # Enable push
          enabled: true
          username: admin
          password: hcloud&1234
application注入参数
 @Bean
    MeterRegistryCustomizer<MeterRegistry> configurer(
            @Value("${spring.application.name}") String applicationName) {
        return (registry) -> registry.config().commonTags("application", applicationName);
    }
prometheus_2437">完整prometheus
192.168.0.100是当前部署docker-compose里面服务的主机ip
# my global config
global:
  scrape_interval:     15s # Set the scrape interval to every 15 seconds. Default is every 1 minute.
  evaluation_interval: 15s # Evaluate rules every 15 seconds. The default is every 1 minute.
  # scrape_timeout is set to the global default (10s).

# Alertmanager configuration
alerting:
  alertmanagers:
  - static_configs:
    - targets:
       labels:
         instance: localhost
       - alertmanager:9093

# Load rules once and periodically evaluate them according to the global 'evaluation_interval'.
rule_files:
  - "rules/alert_rules.yml"
  # - "first_rules.yml"
  # - "second_rules.yml"

# A scrape configuration containing exactly one endpoint to scrape:
# Here it's Prometheus itself.
scrape_configs:
  # The job name is added as a label `job=<job_name>` to any timeseries scraped from this config.
  - job_name: prometheus
    basic_auth:
      username: admin
      password: hcloud&1234
    static_configs:
    - targets: ['prometheus:9090']
      labels:
        instance: localhost
  - job_name: host-node-exporter
    static_configs:
    - targets: ['node-exporter:9100']
      labels:
        instance: localhost
  - job_name: mysqld-exporter
    static_configs:
    - targets: ['mysqld-exporter:9104']
      labels:
        instance: mysqld-exporter
  - job_name: cadvisor
    static_configs:
    - targets: ['cadvisor:8080']
      labels:
        instance: localhost
  - job_name: redis_exporter
    static_configs:
    - targets: ['redis_exporter:9121']
      labels:
        instance: redis_exporter
  - job_name: pushgateway
    basic_auth:
      username: admin
      password: hcloud&1234
    static_configs:
    - targets: ['pushgateway:9091']
      labels:
        instance: localhost
完整docker-compose
192.168.0.100是当前部署docker-compose里面服务的主机ip
version: '3'
services:
  prometheus:
    image: prom/prometheus:v2.4.0
    hostname: prometheus
    container_name: prometheus
    restart: always
    ports:
     - "9090:9090"
    volumes:
     - $PWD/prometheus:/etc/prometheus
     - $PWD/prometheus/data:/prometheus
    privileged: true
    command:
     - '--config.file=/etc/prometheus/prometheus.yml'
     - '--web.console.libraries=/etc/prometheus/console_libraries'
     - '--web.console.templates=/etc/prometheus/consoles'
     - '--storage.tsdb.path=/prometheus'
     - '--storage.tsdb.retention.time=15d'
     - '--web.enable-lifecycle'

  node-exporter:
    image: prom/node-exporter:v1.2.2
    hostname: node-exporter
    container_name: node-exporter
    restart: always
    ports:
     - "9190:9100"
    volumes:
     - /proc:/host/proc:ro
     - /sys:/host/sys:ro
     - /:/rootfs:ro
    privileged: true
    command:
     - '--path.procfs=/host/proc'
     - '--path.rootfs=/rootfs'
     - '--path.sysfs=/host/sys'
     - '--collector.filesystem.mount-points-exclude=^/(sys|proc|dev|host|etc)($$|/)'

  mysqld-exporter:
    image: prom/mysqld-exporter:v0.13.0
    hostname: mysqld-exporter
    container_name: mysqld-exporter
    restart: always
    environment:
      # 需要修改为具体mysql地址和密码  账号 prometheus 密码 hcloud1234 ip端口192.168.0.229:43306
      - DATA_SOURCE_NAME=prometheus:hcloud1234@(192.168.0.229:43306)/
    ports:
     - "9104:9104"
    privileged: true

  cadvisor:
    image: google/cadvisor:v0.32.0
    hostname: cadvisor
    container_name: cadvisor
    restart: always
    volumes:
     - /sys:/sys:ro
     - /var/run:/var/run:rw
     - /:/rootfs:ro
     - /dev/disk/:/dev/disk:ro
     - /home/docker:/var/lib/docker:ro
    ports:
     - "9105:8080"

  grafana:
    image: grafana/grafana:8.1.1
    hostname: grafana
    container_name: grafana
    restart: always
    environment:
     - GF_SECURITY_ADMIN_PASSWORD=hancloud1234
    volumes:
     - $PWD/plugins/grafana/data:/var/lib/grafana
     - $PWD/plugins/grafana/grafana.ini:/etc/grafana/grafana.ini
    ports:
     - "9106:3000"

  # alertmanager
  alertmanager:
    image: prom/alertmanager:v0.22.2
    hostname: alertmanager
    container_name: alertmanager
    restart: always
    volumes:
     - $PWD/plugins/alertmanager/alertmanager.yml:/etc/alertmanager/alertmanager.yml
     - $PWD/plugins/alertmanager/data:/etc/alertmanager/data
     - $PWD/plugins/alertmanager/templates:/etc/alertmanager/templates
    ports:
     - "9107:9093"
    command:
     - '--config.file=/etc/alertmanager/alertmanager.yml'
     - '--storage.path=/etc/alertmanager/data'

  # redis_exporter
  redis_exporter:
    image: oliver006/redis_exporter:v1.25.0
    hostname: redis_exporter
    container_name: redis_exporter
    restart: always
    ports:
     - "9108:9121"
    environment:
     - REDIS_ADDR=redis://192.168.0.229:46379
     # 注意密码,!会产生不解释行为导致无法执行
     - REDIS_PASSWORD=hcloud1234
     - TZ=Asia/Shanghai
  pushgateway:
    image: prom/pushgateway:v1.4.1
    hostname: pushgateway
    container_name: pushgateway
    restart: always
    ports:
     - "9091:9091"
部署流程
创建相应目录
mkdir -p /home/prometheus && cd /home/prometheus
prometheusdeployzip__homeprometheus__2640">将部署文件 prometheusdeploy.zip 拷贝到 /home/prometheus ,并解压镜像
unzip prometheusdeploy.zip && cd /home/prometheus/images && docker load -i scs_monitor.tar.gz && chmod 777 -R /home/prometheus
修改monitor.env
monitor.env
# prometheus数据保留的天数
PROMETHEUSDATATIME=15d
# 监控mysql的配置
MYSQLUSERNAME=prometheus
MYSQLPASSWORD=hcloud1234
MYSQLIP=192.168.0.229
MYSQLPORT=43306

#grafana登录密码
GFSECURITYADMINPASSWORD=hancloud1234

# 监控redis的配置
REDISPASSWORD=hcloud1234
REDISIP=192.168.0.229
REDISPORT=46379
复制monitor.env 到当前目录 .env
\cp monitor.env .env
prometheus__2675">在/home/prometheus 目录启动
docker-compose up -d
访问
prometheus http://192.168.0.100:9090/
pushgateway http://192.168.0.100:9091/
grafana http://192.168.0.100:9106/ admin hancloud1234
简便部署
prometheusgrafana_2695">prometheus和grafana安装
创建相应目录
mkdir -p /home/prometheus && cd /home/prometheus
prometheuszip__homeprometheus__2703">将部署文件 prometheus.zip 拷贝到 /home/prometheus ,并解压
unzip prometheus.zip
修改monitor.env
monitor.env
# prometheus数据保留的天数
PROMETHEUSDATATIME=15d
# 监控mysql的配置
MYSQLUSERNAME=prometheus
MYSQLPASSWORD=hcloud1234
MYSQLIP=192.168.0.229
MYSQLPORT=43306

#grafana登录密码
GFSECURITYADMINPASSWORD=hancloud1234

# 监控redis的配置
REDISPASSWORD=hcloud1234
REDISIP=192.168.0.229
REDISPORT=46379
部署执行deploy.sh
chmod +x deploy.sh && ./deploy.sh
访问
prometheus http://192.168.0.100:9090/ admin hcloud&1234
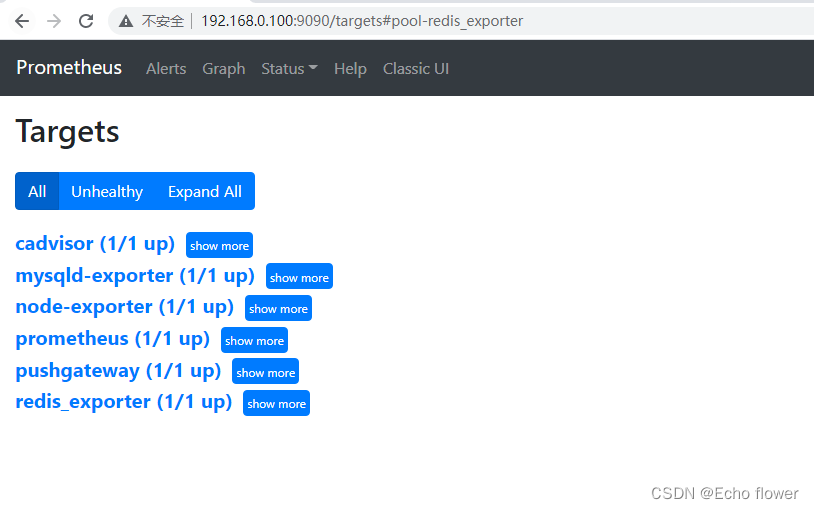
pushgateway http://192.168.0.100:9091/ admin hcloud&1234
grafana http://192.168.0.100:9106/ admin hancloud1234
在grafana 添加数据源
1.设置 找到 Data sources
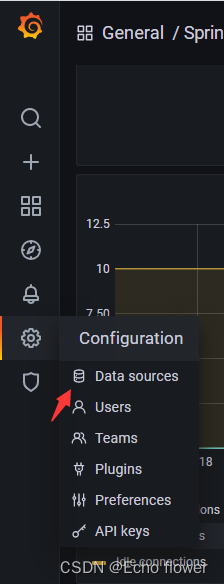
2.新增数据源
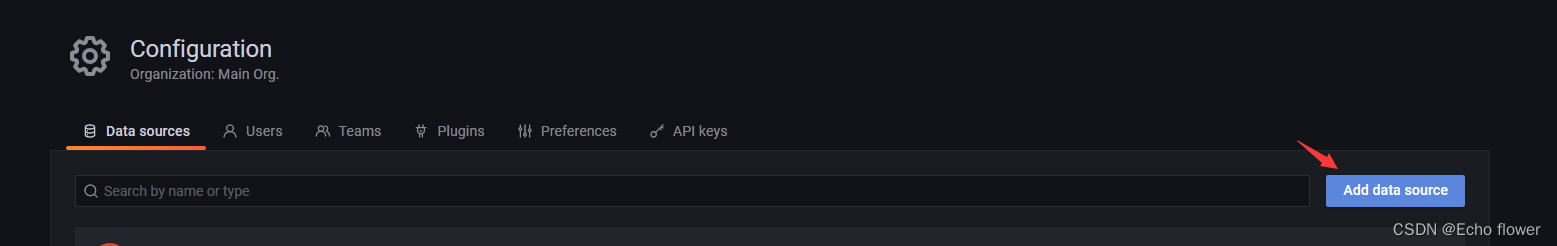
3.选择Prometheus
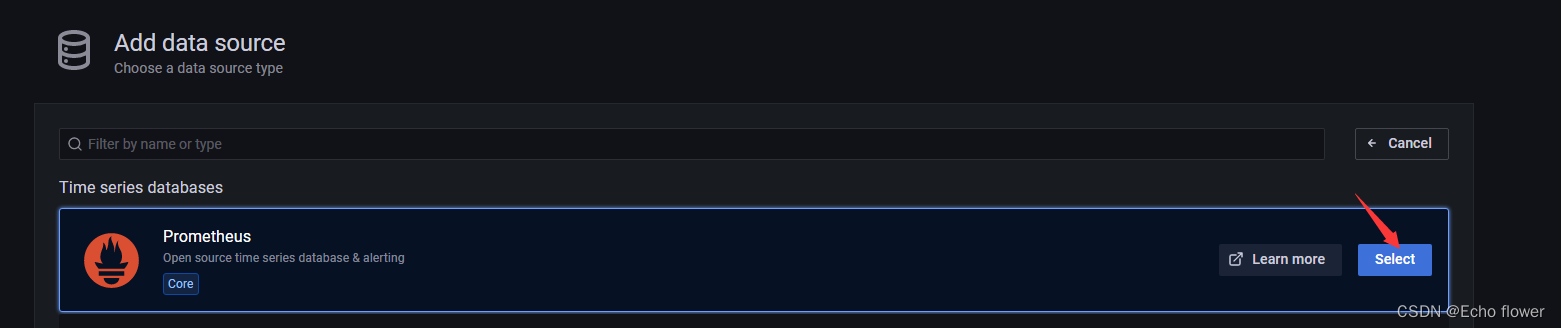
4.输入Prometheus的ip
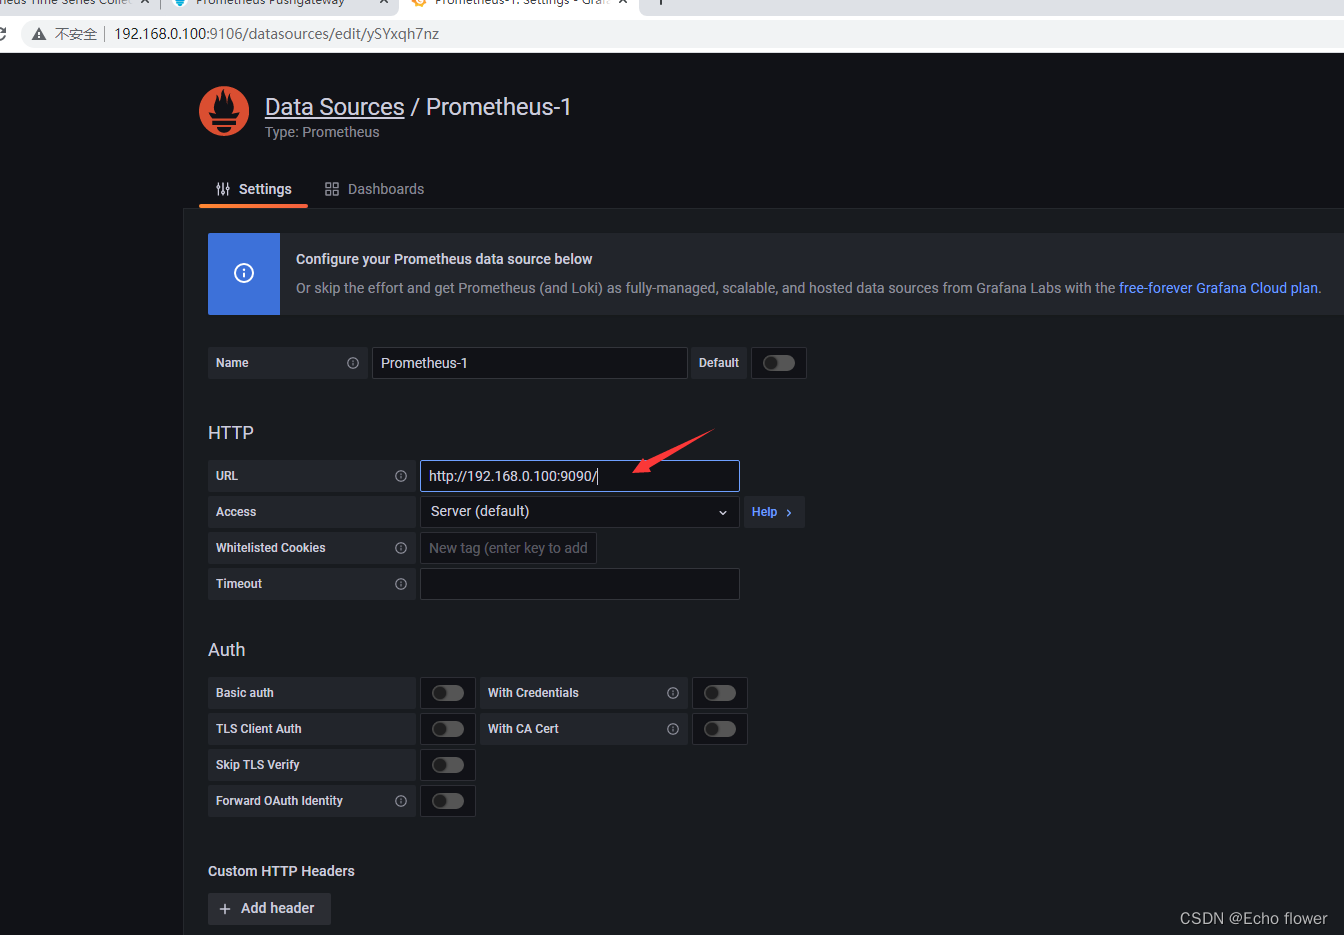
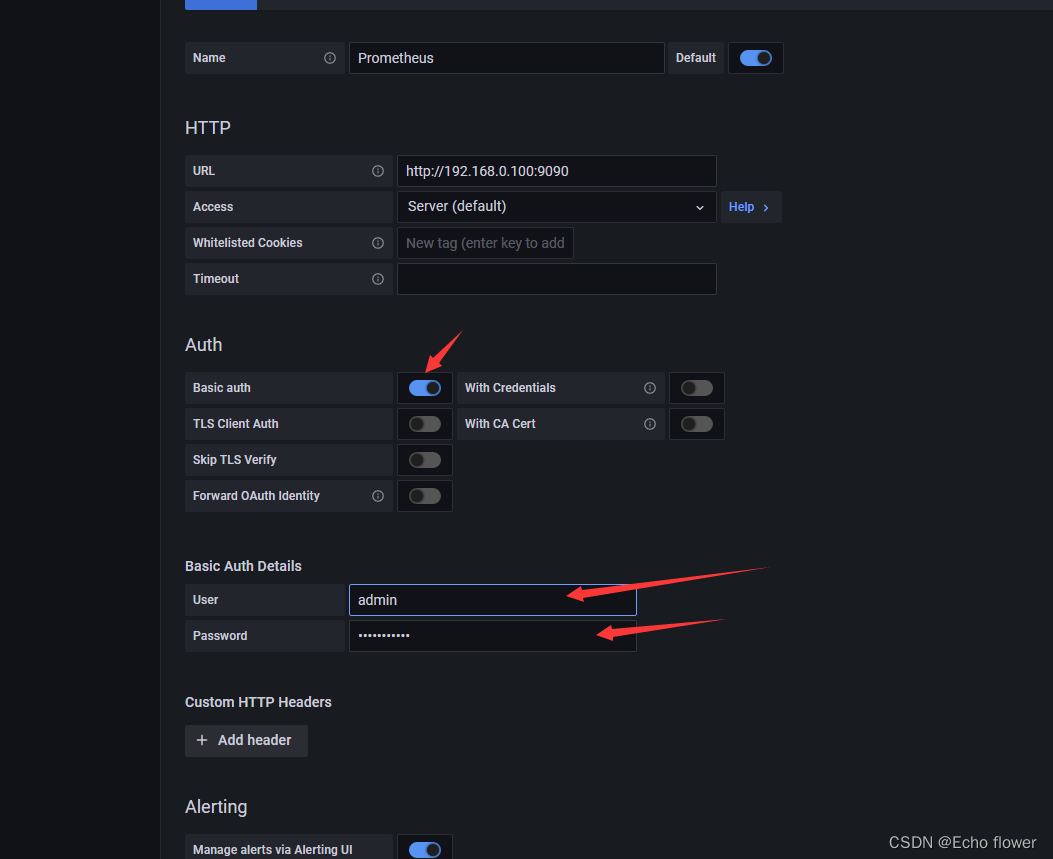
5.点击下面的save & test 出现下面情况,代表成功
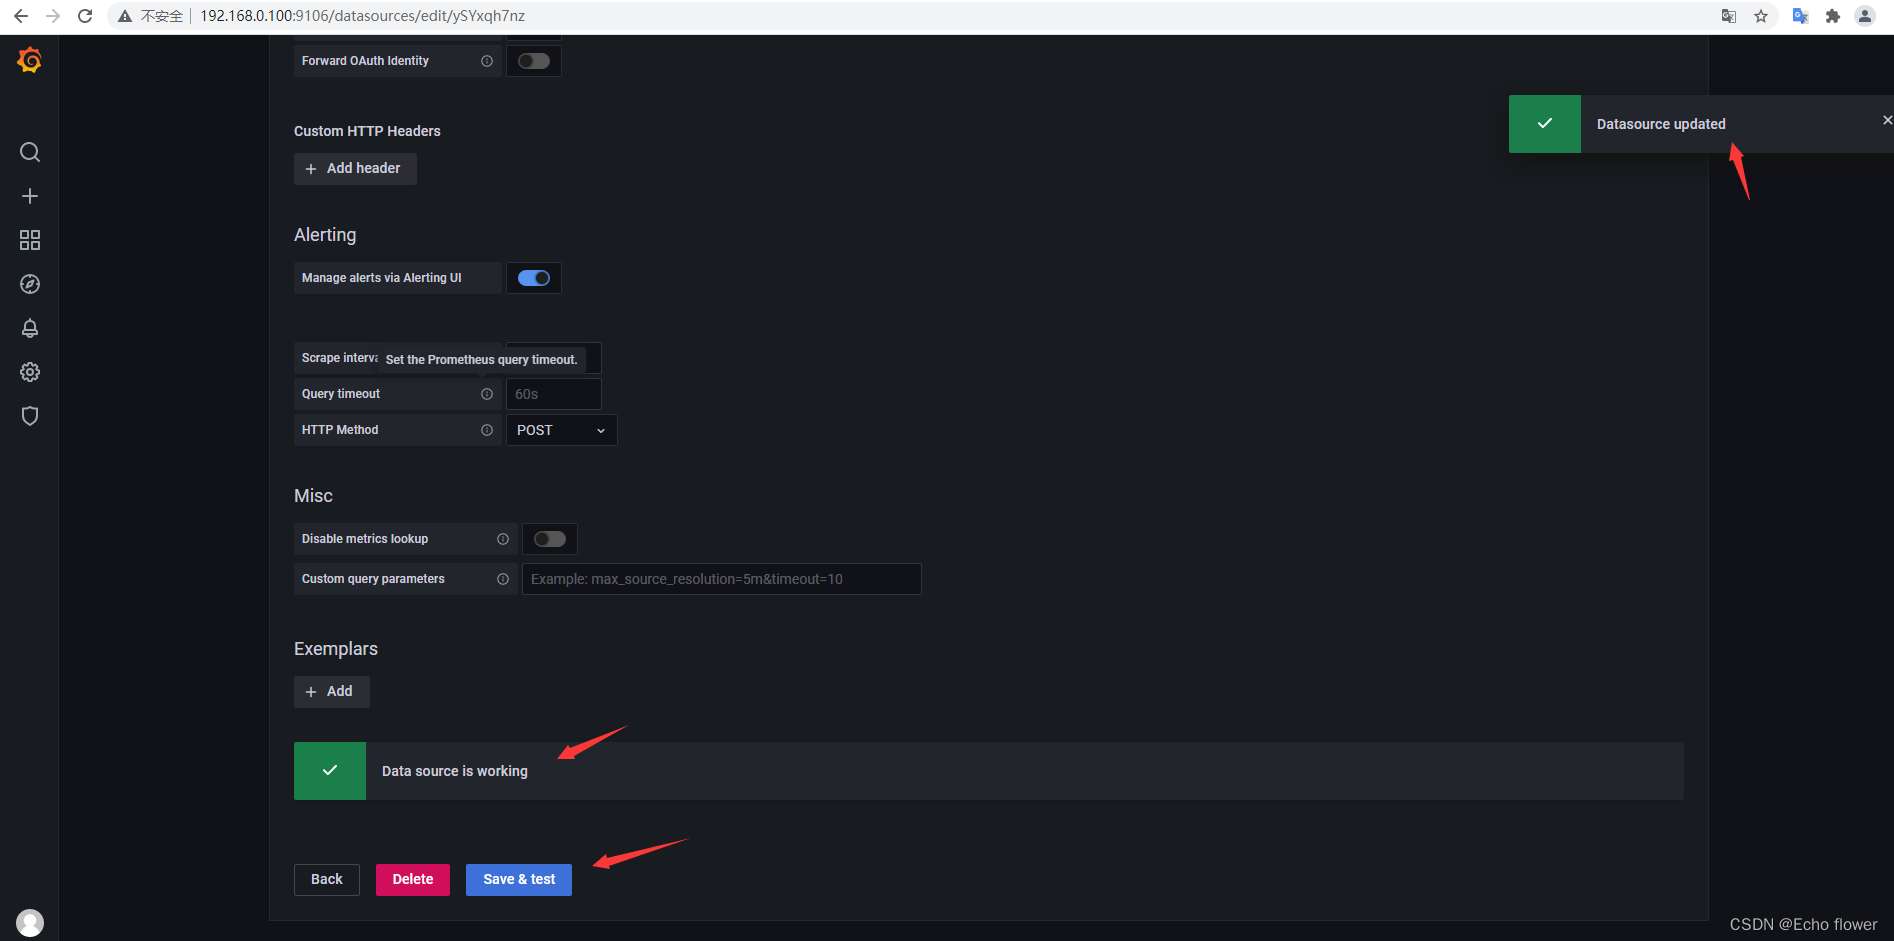
6.导入面板
将下面json文件所有都导入
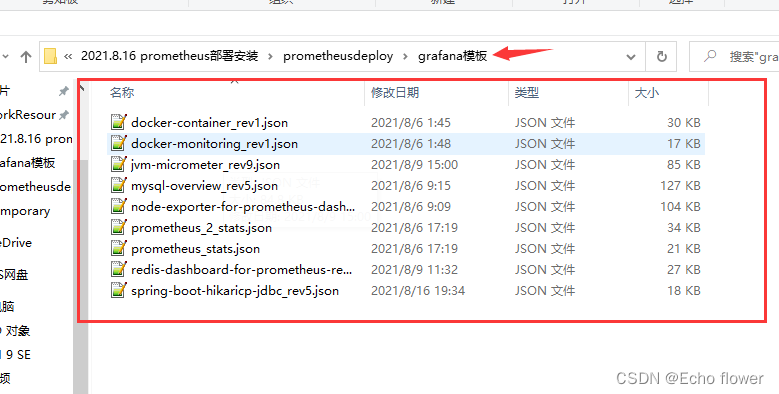
7.开始导入面板
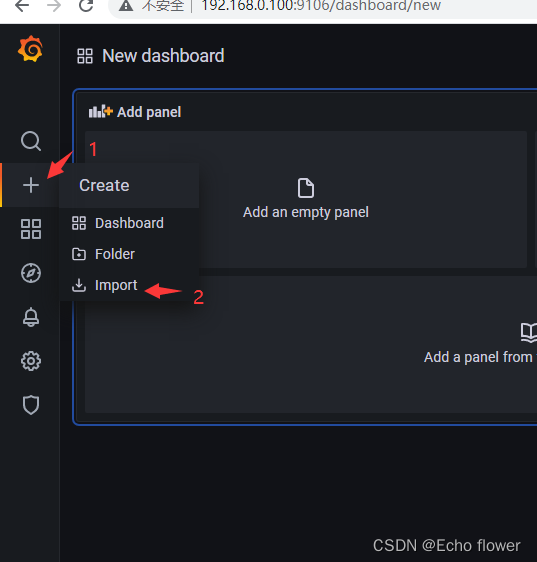
8.选择文件
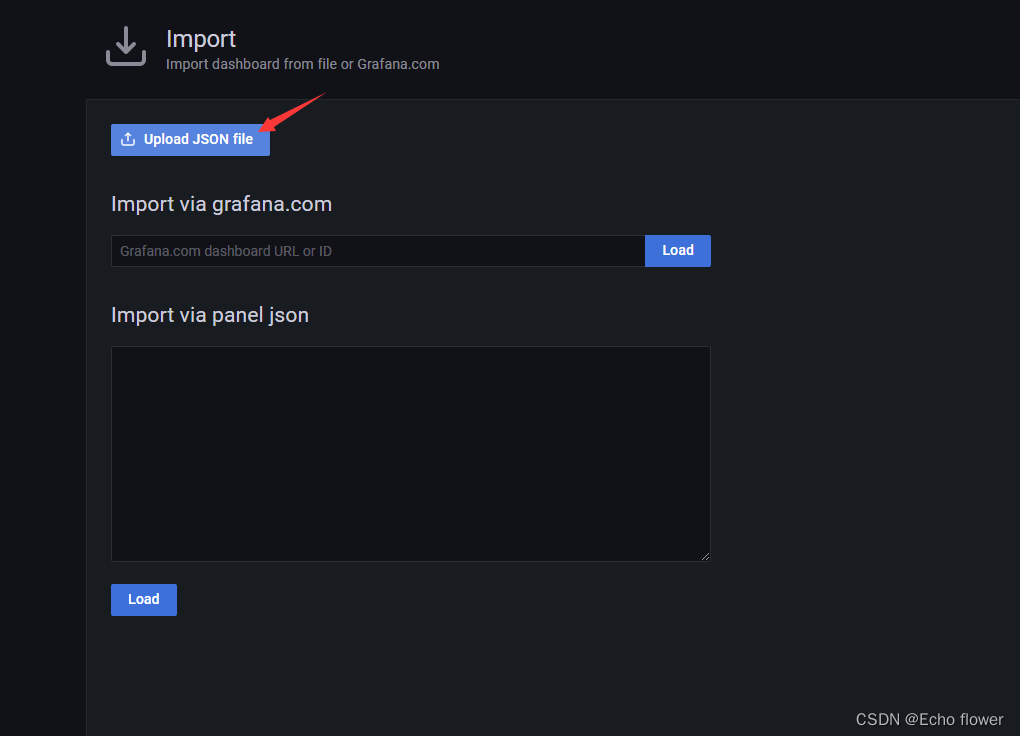
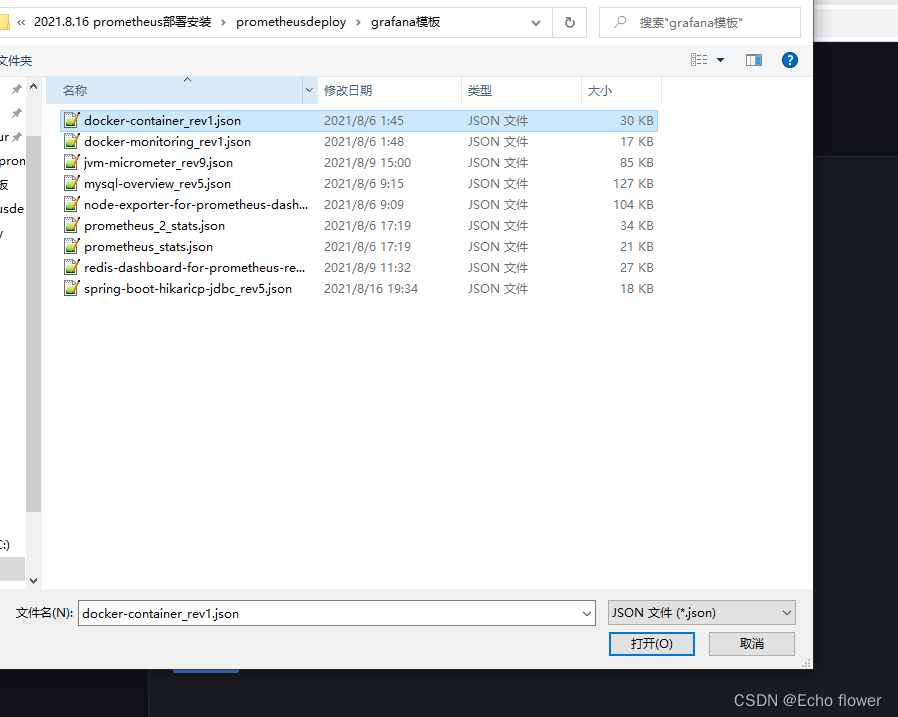
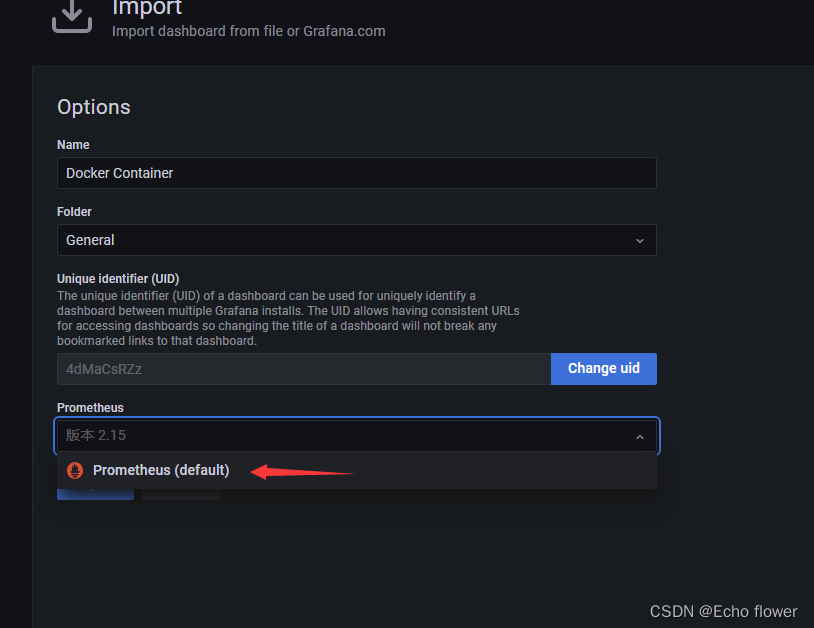
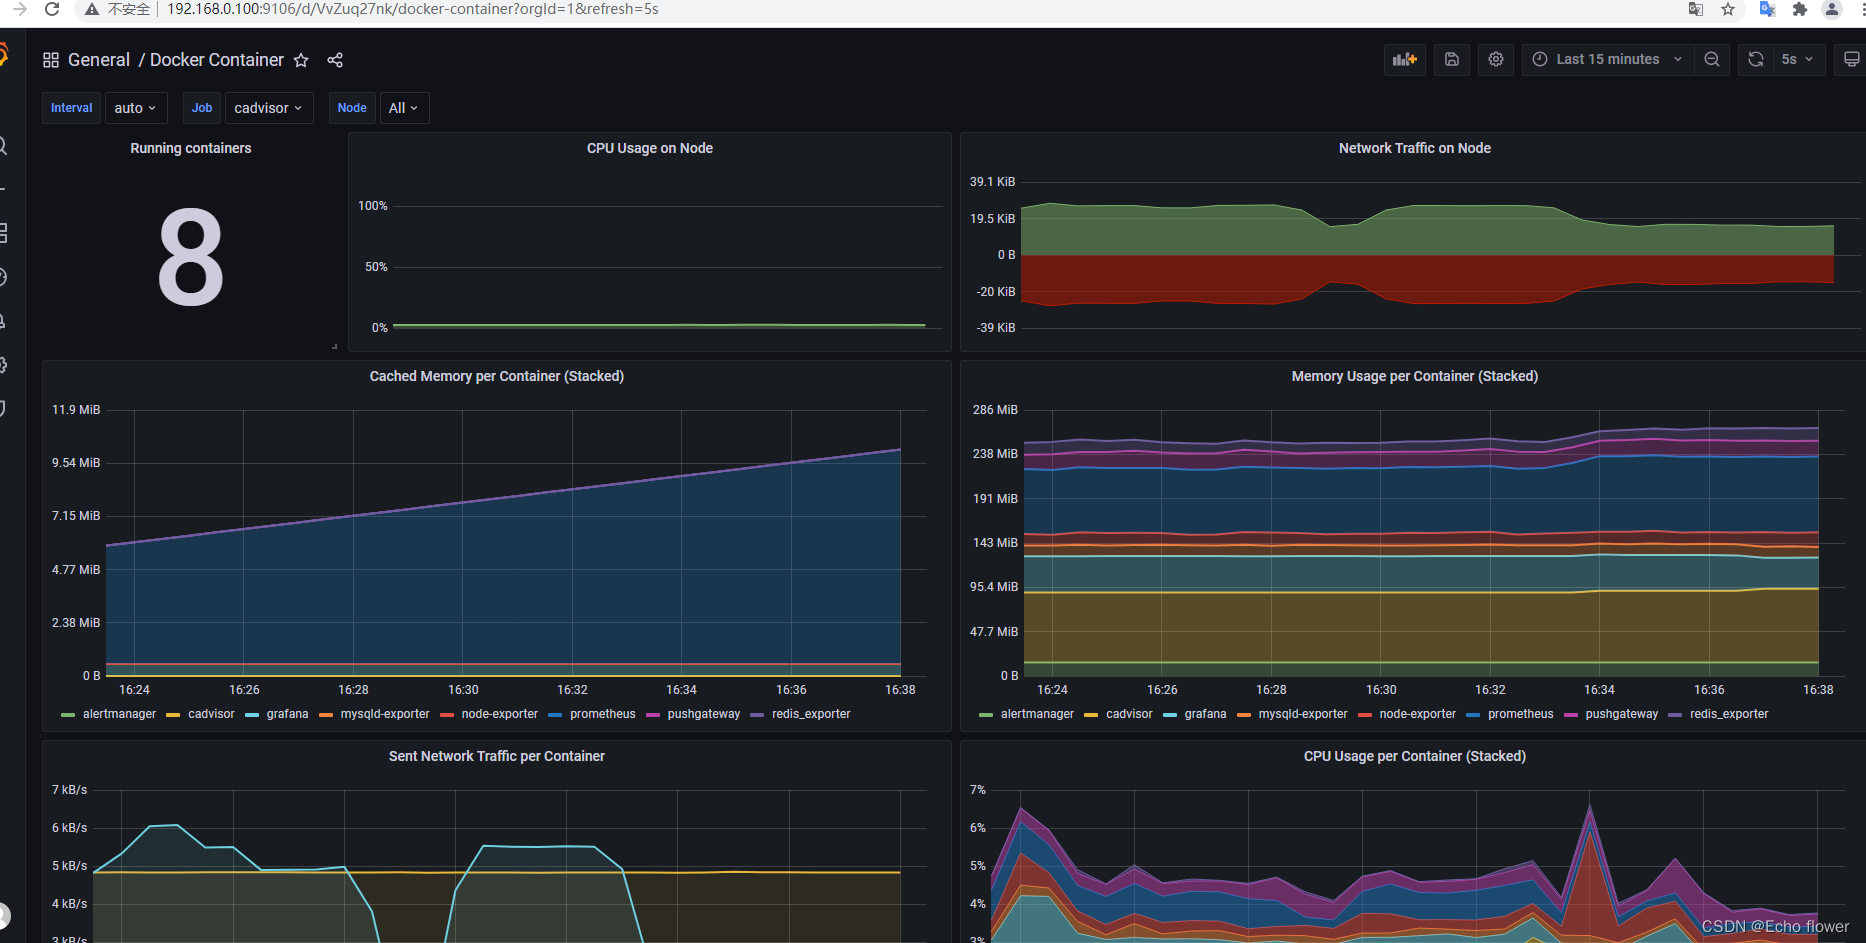
9.其他json文件全部导入
。。。。
主机上 安装主机监控和docker容器监控
创建相应目录
mkdir -p /home/prometheus && cd /home/prometheus
prometheusdeployzip__homeprometheus__2825">将部署文件 prometheusdeploy.zip 拷贝到 /home/prometheus ,并解压
unzip hosts.zip
部署执行deploy.sh
chmod +x deploy.sh && ./deploy.sh
prometheushomeprometheusprometheusprometheusyml__2837">在prometheus机器上修改/home/prometheus/prometheus/prometheus.yml 配置
增加
  - job_name: scs-node-exporter
	basic_auth:
      username: admin
      password: hcloud&1234
    static_configs:
    - targets: ['192.168.0.101:9190']
      labels:
        instance: localhost1
  - job_name: scs-cadvisor
	basic_auth:
      username: admin
      password: hcloud&1234
    static_configs:
    - targets: ['192.168.0.101:9105']
      labels:
        instance: localhost1
  - job_name: 'scs-portal'
    metrics_path: /status/format/prometheus
    basic_auth:
      username: admin
      password: hcloud&1234
    static_configs:
    - targets: ['192.168.0.120']
      labels:
        instance: localhost1
prometheusprometheus_2869">在prometheus机器上重启prometheus
docker-compose stop prometheus && docker-compose start prometheus
访问 prometheus http://192.168.0.100:9090/ admin hcloud&1234

注意:instance,redis,mysql,docker,必须和node-exporterd 的instance一样,代表同一个机器上的服务
  - job_name: scs-node-exporter
	basic_auth:
      username: admin
      password: hcloud&1234
    static_configs:
    - targets: ['192.168.0.101:9190']
      labels:
        instance: localhost1
代码下载