内容预知
前言
1. 部署 Grafana
grafana%E7%9A%84%E4%B8%8B%E8%BD%BD%E4%B8%8E%E5%AE%89%E8%A3%85-toc" style="margin-left:40px;"> 1.1 grafana的下载与安装
grafana%C2%A0-toc" style="margin-left:80px;">(1)安装grafana
(2)配置数据源
grafana%20%E7%9B%91%E6%8E%A7%E9%9D%A2%E6%9D%BF%C2%A0-toc" style="margin-left:80px;">(3)导入 grafana 监控面板
(4)删除模板操作
grafana%E7%9A%84%E4%B8%AD%E6%96%87%E6%8F%92%E4%BB%B6%E5%AE%89%E8%A3%85-toc" style="margin-left:40px;"> 4.2 grafana的中文插件安装
2. 部署 Prometheus 服务发现
2.1 基于文件的服务发现
实验前准备
(1)创建用于服务发现的文件,在文件中配置所需的 target
(2)在载入的文件中添加新的node节点监控
2.2 基于 Consul 的服务发现
(1)部署Consul服务
(2)在consul中注册service
prometheus%20%E9%85%8D%E7%BD%AE%E6%96%87%E4%BB%B6%EF%BC%8C%E8%AE%A9Prometheus%E5%9F%BA%E4%BA%8Econsul%E8%BF%9B%E8%A1%8C%E6%9C%8D%E5%8A%A1%E5%8F%91%E7%8E%B0-toc" style="margin-left:80px;"> (3)修改 prometheus 配置文件,让Prometheus基于consul进行服务发现
(4)在consul中添加node节点,从而改变Prometheus的监控节点
(5)consul注销与重新注册service
2.3 基于 Kubernetes API 的服务发现
前言
上一篇文章中我们介绍了Prometheus的组件,监控作用,部署方式,以及如何通过在客户机安装exporter再添加监控项的操作。但是不免会发现原生的Prometheus的图像化界面对于监控数据并不能其他很好的展示效果。所以本次我们将介绍一款开源非常适用于Prometheus的图形化软件grafana 。

除此之外,上面的exporter监控项都是通过手动添加,这样效率慢而且需要中止Prometheus的工作进程,所以本次我们将介绍几种让Prometheus自动完成服务发现的方法
1. 部署 Grafana
grafana%E7%9A%84%E4%B8%8B%E8%BD%BD%E4%B8%8E%E5%AE%89%E8%A3%85"> 1.1 grafana的下载与安装
grafana%C2%A0">(1)安装grafana
下载地址:https://grafana.com/grafana/download
          https://mirrors.bfsu.edu.cn/grafana/yum/rpm/

yum install -y grafana-7.4.0-1.x86_64.rpm

systemctl start grafana-server
systemctl enable grafana-server

netstat -natp | grep :3000
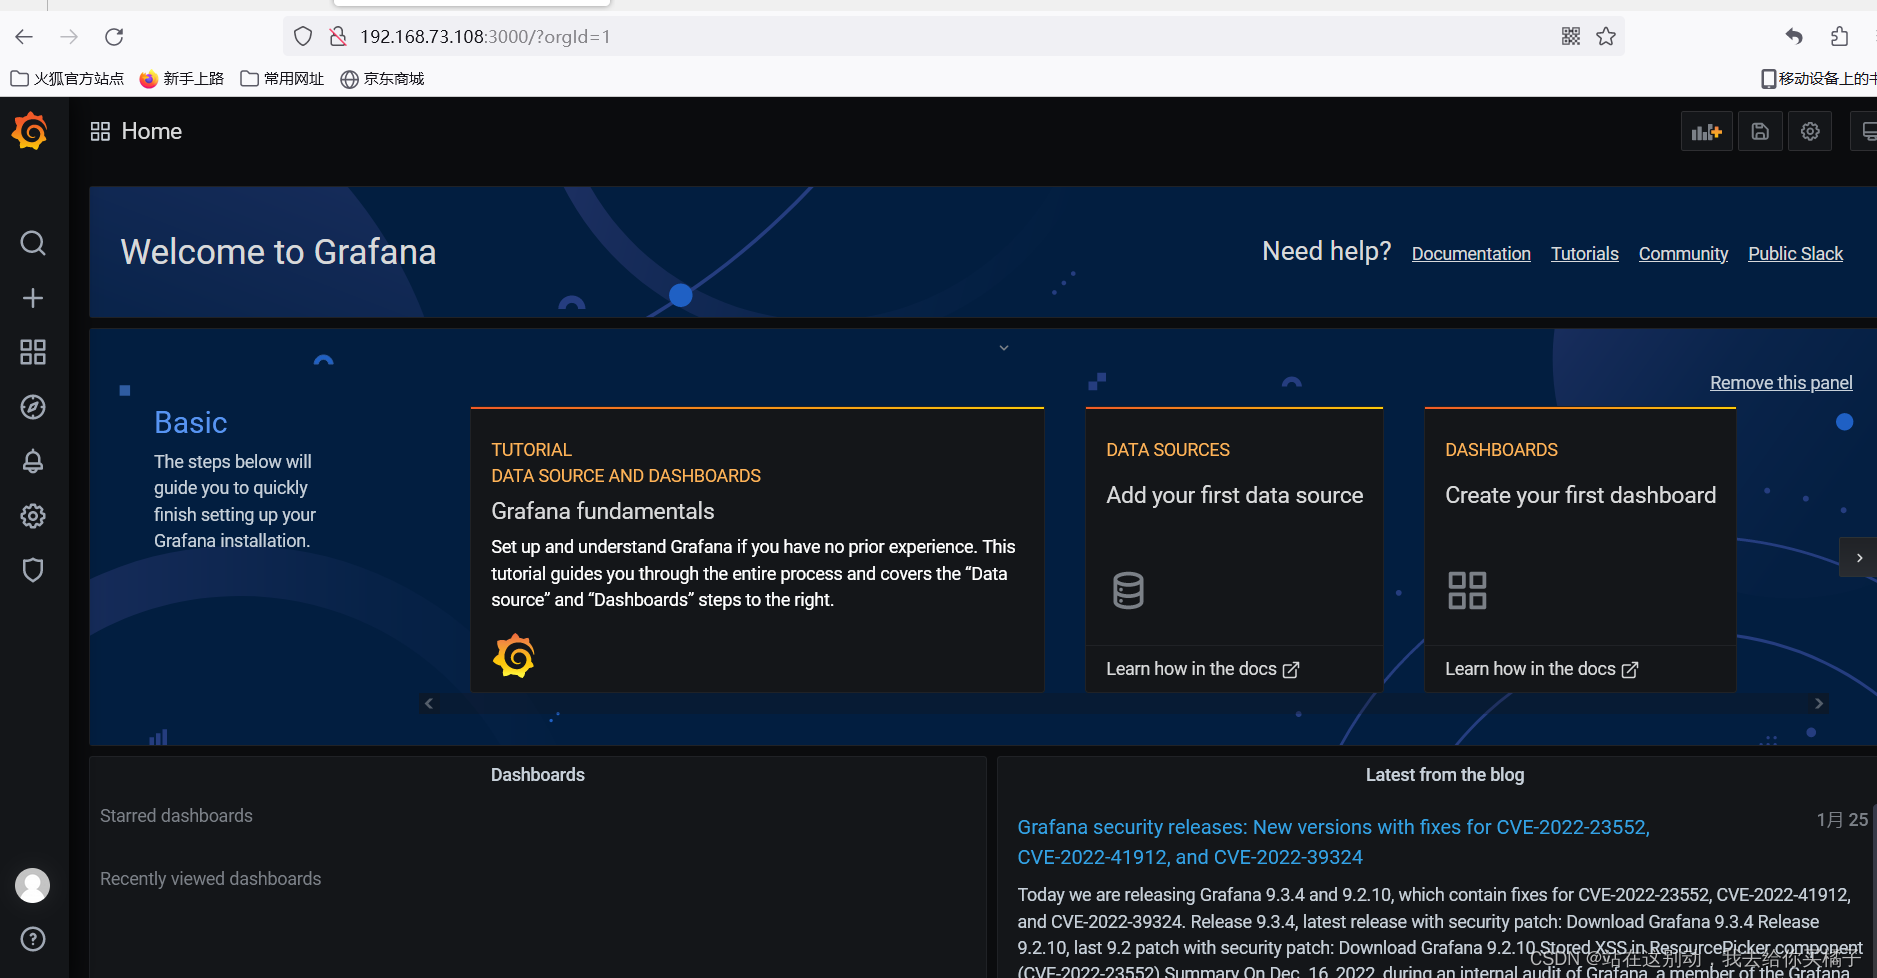
浏览器访问:http://192.168.73.108:3000 ,默认账号和密码为 admin/admin 
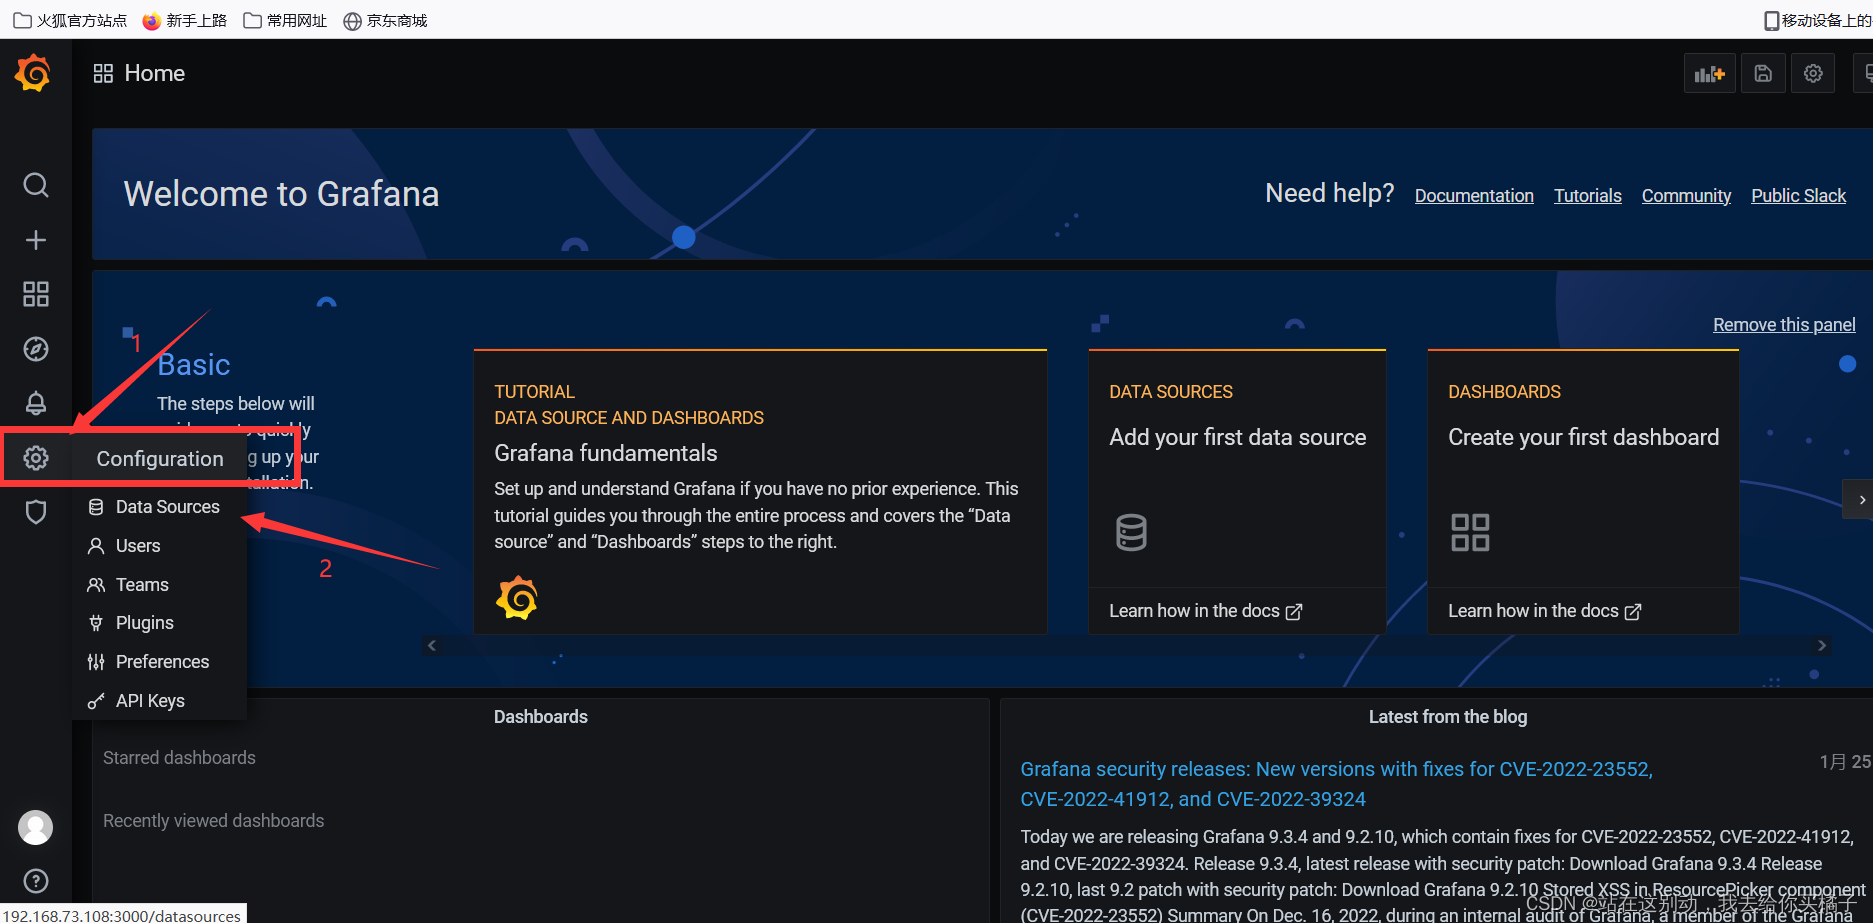
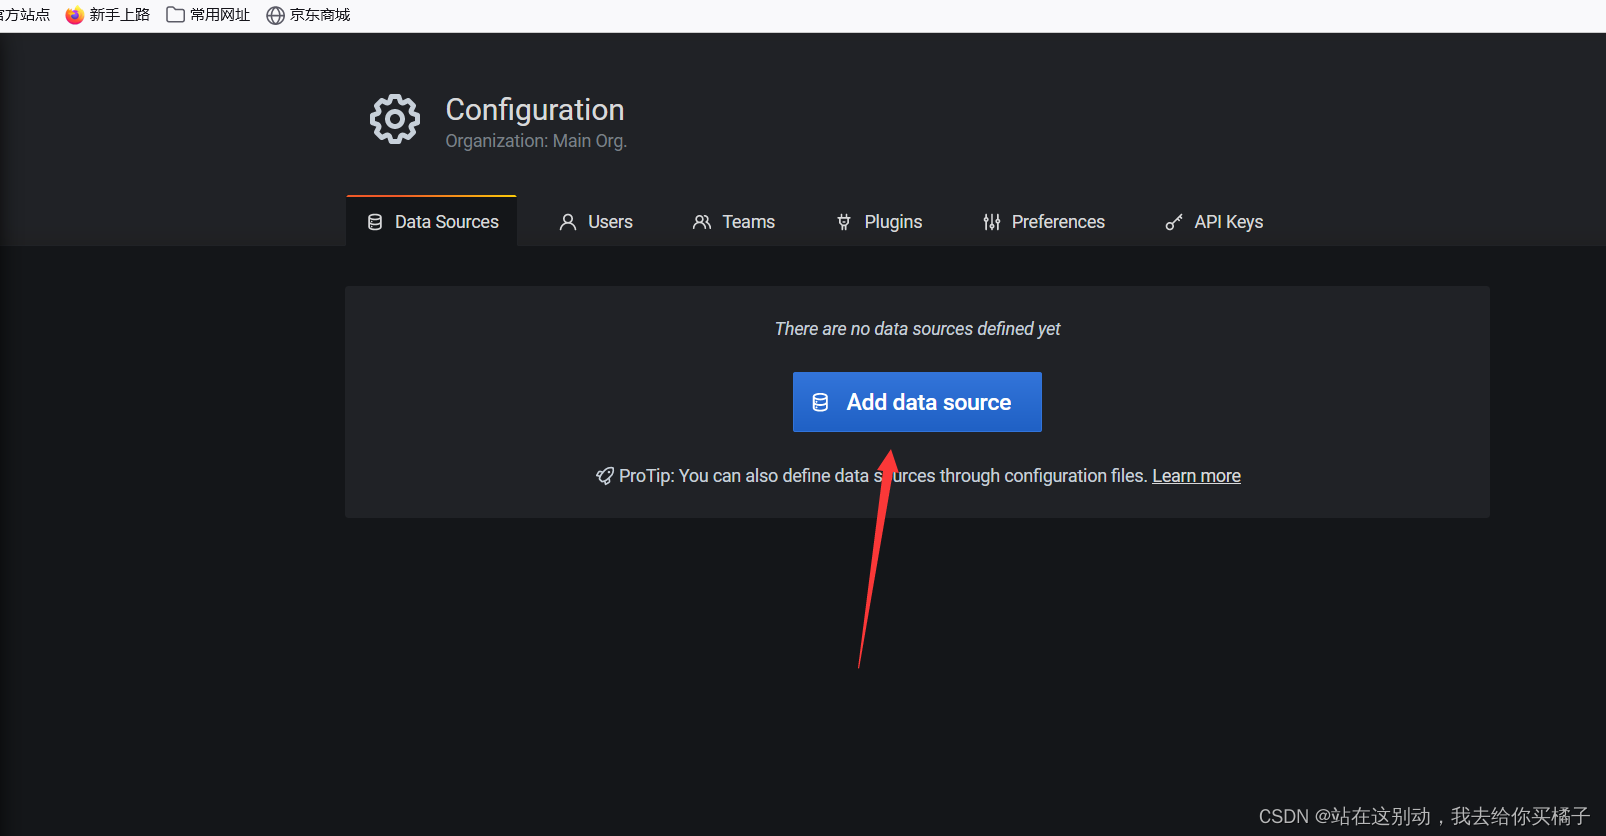
(2)配置数据源
Configuration -> Data Sources -> Add data source -> 选择 Prometheus
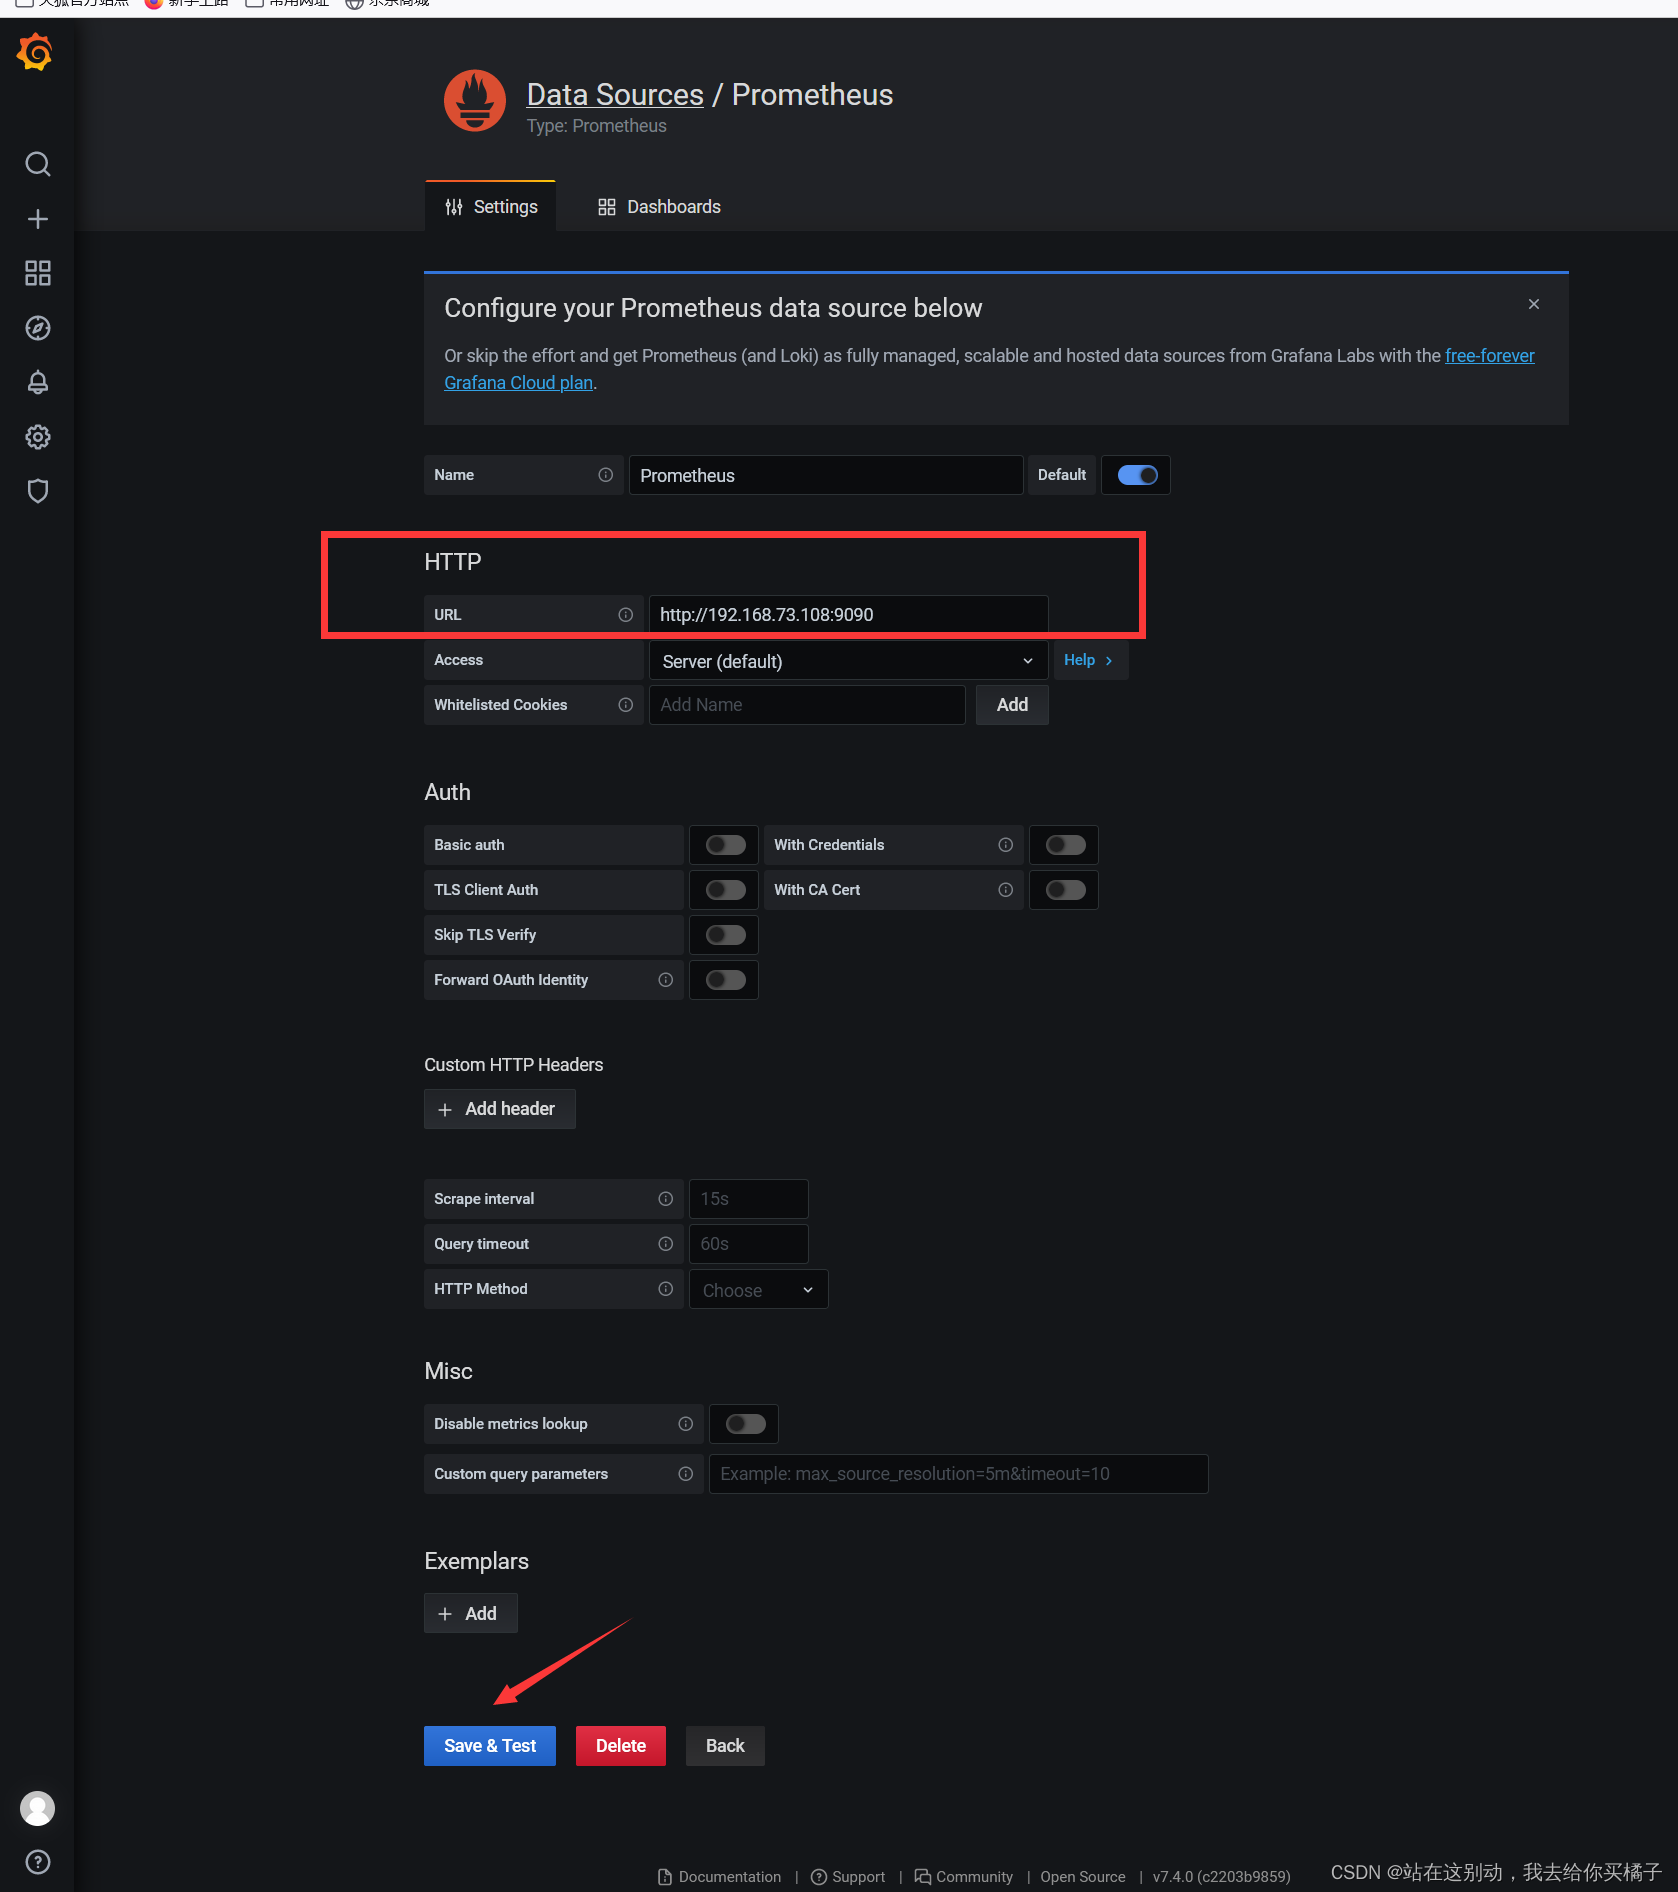
HTTP -> URL 输入 http://192.168.73.108:9090
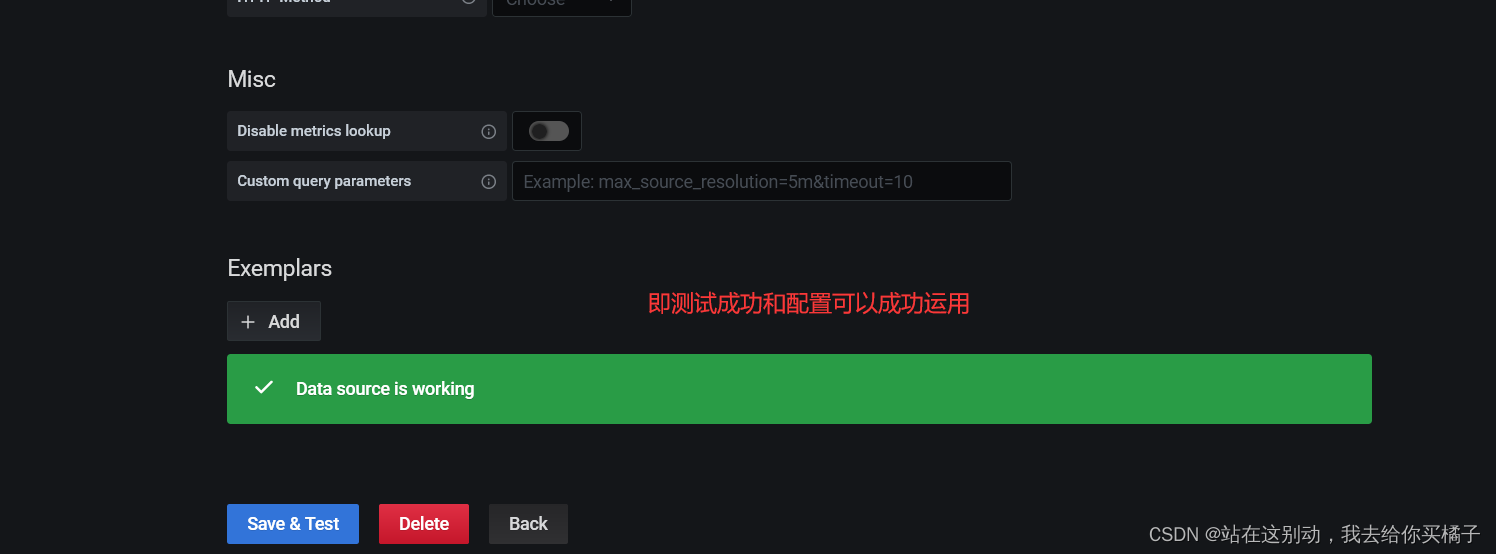
点击 Save & Test

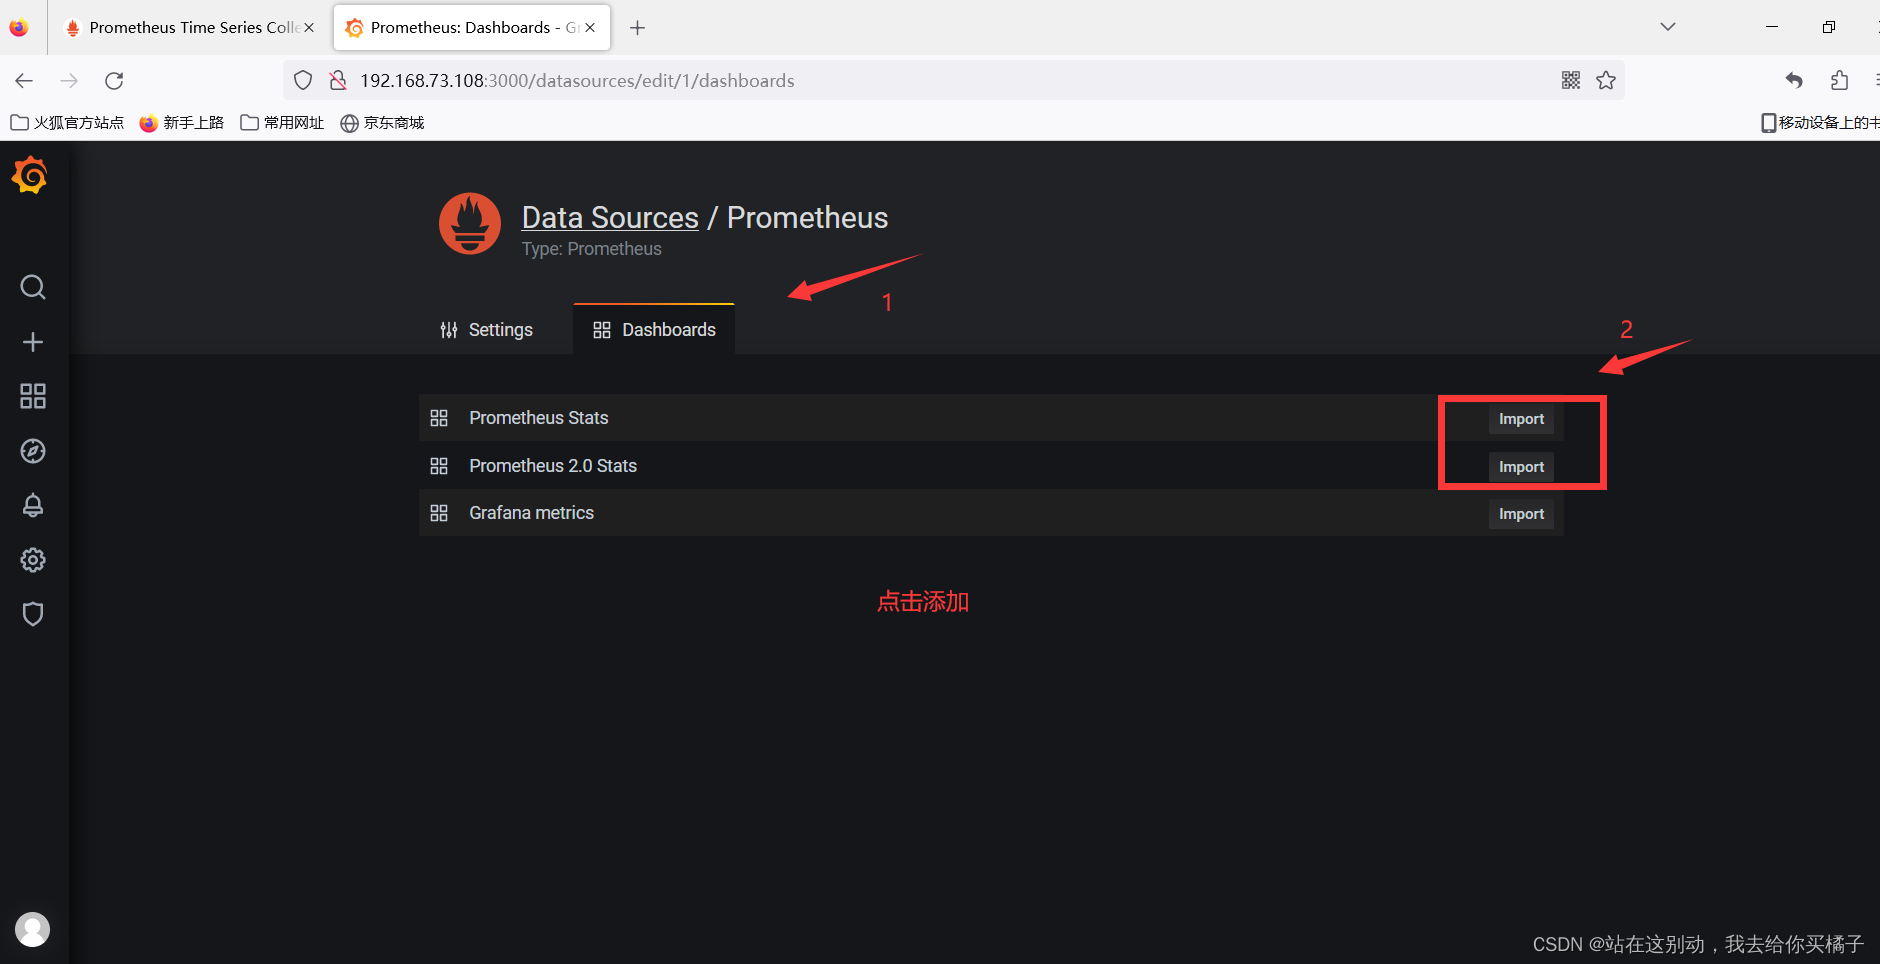
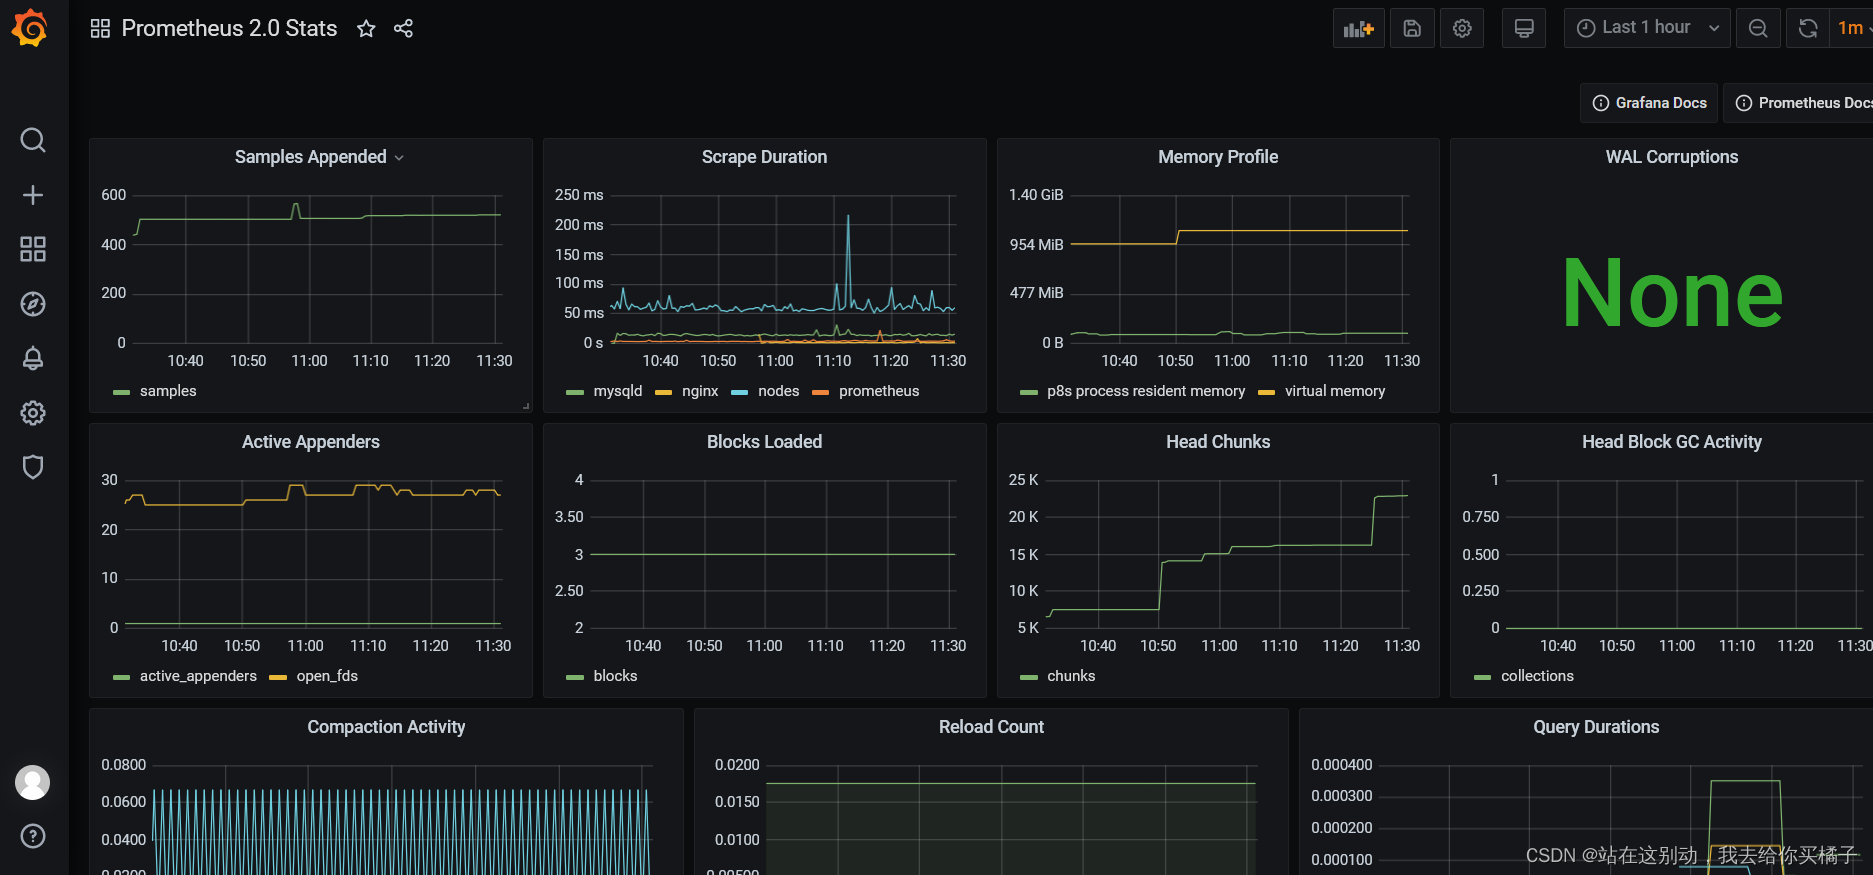
点击 上方菜单 Dashboards,Import 所有默认模板
Dashboards -> Manage ,选择 Prometheus 2.0 Stats 或 Prometheus Stats 即可看到 Prometheus job 实例的监控图像

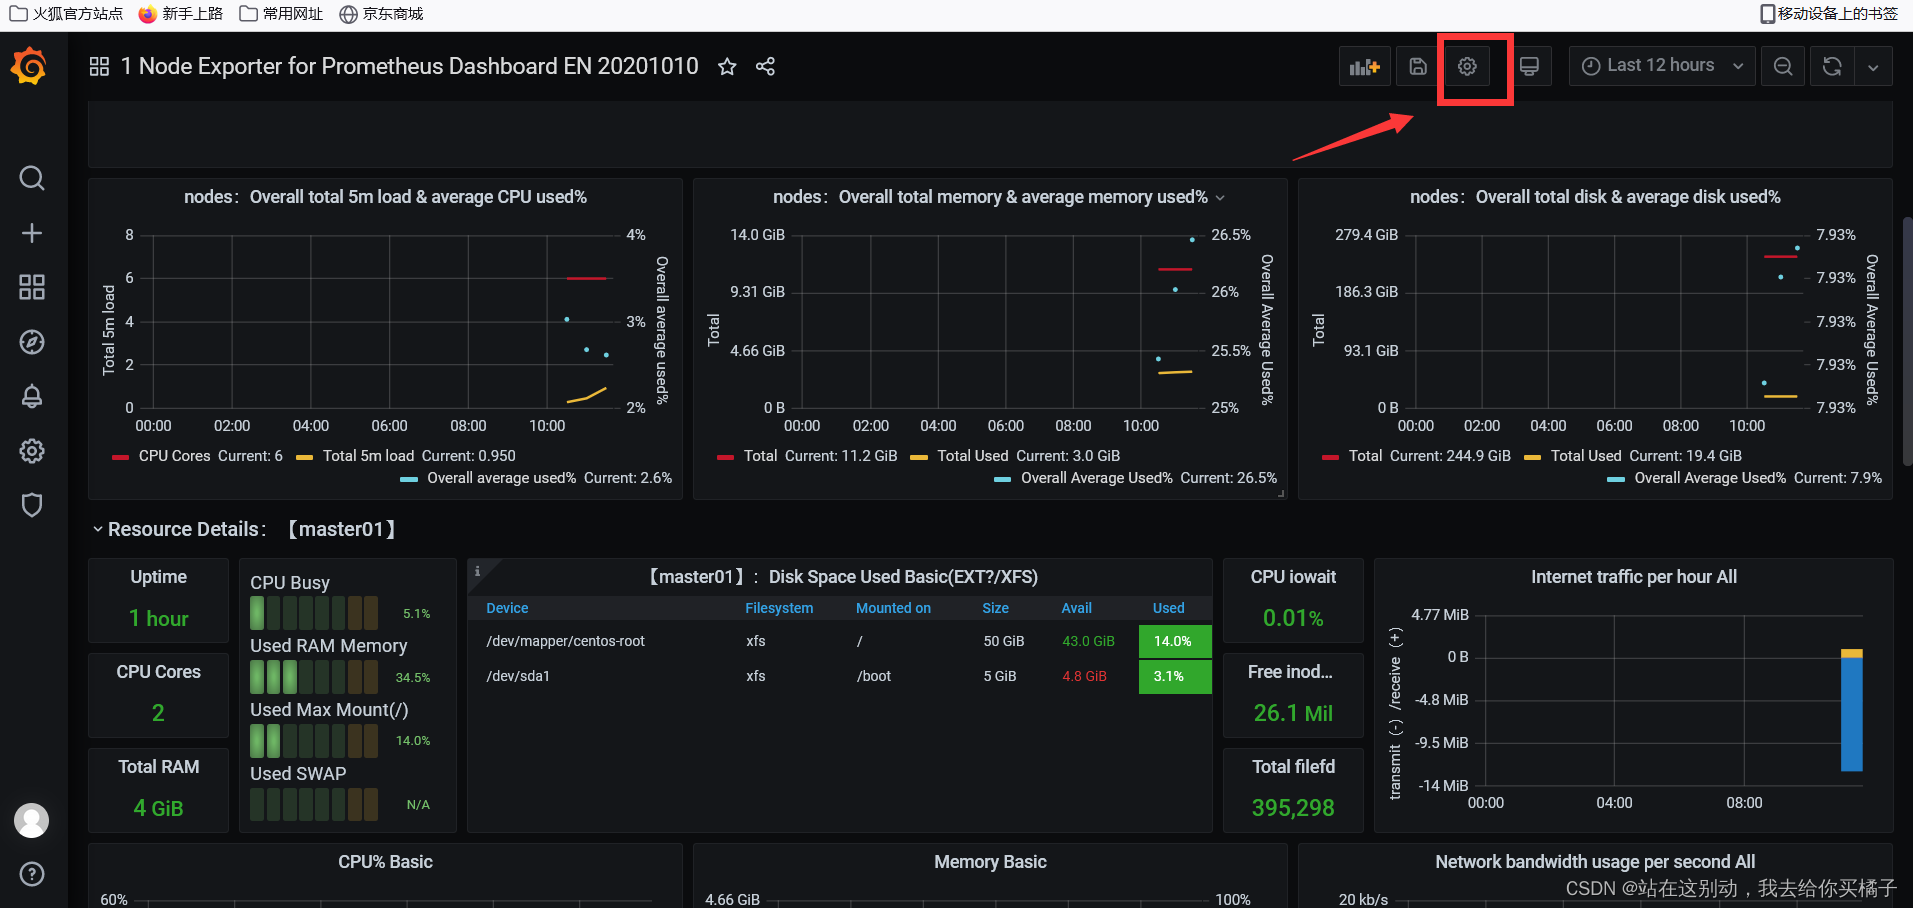
grafana%20%E7%9B%91%E6%8E%A7%E9%9D%A2%E6%9D%BF%C2%A0">(3)导入 grafana 监控面板
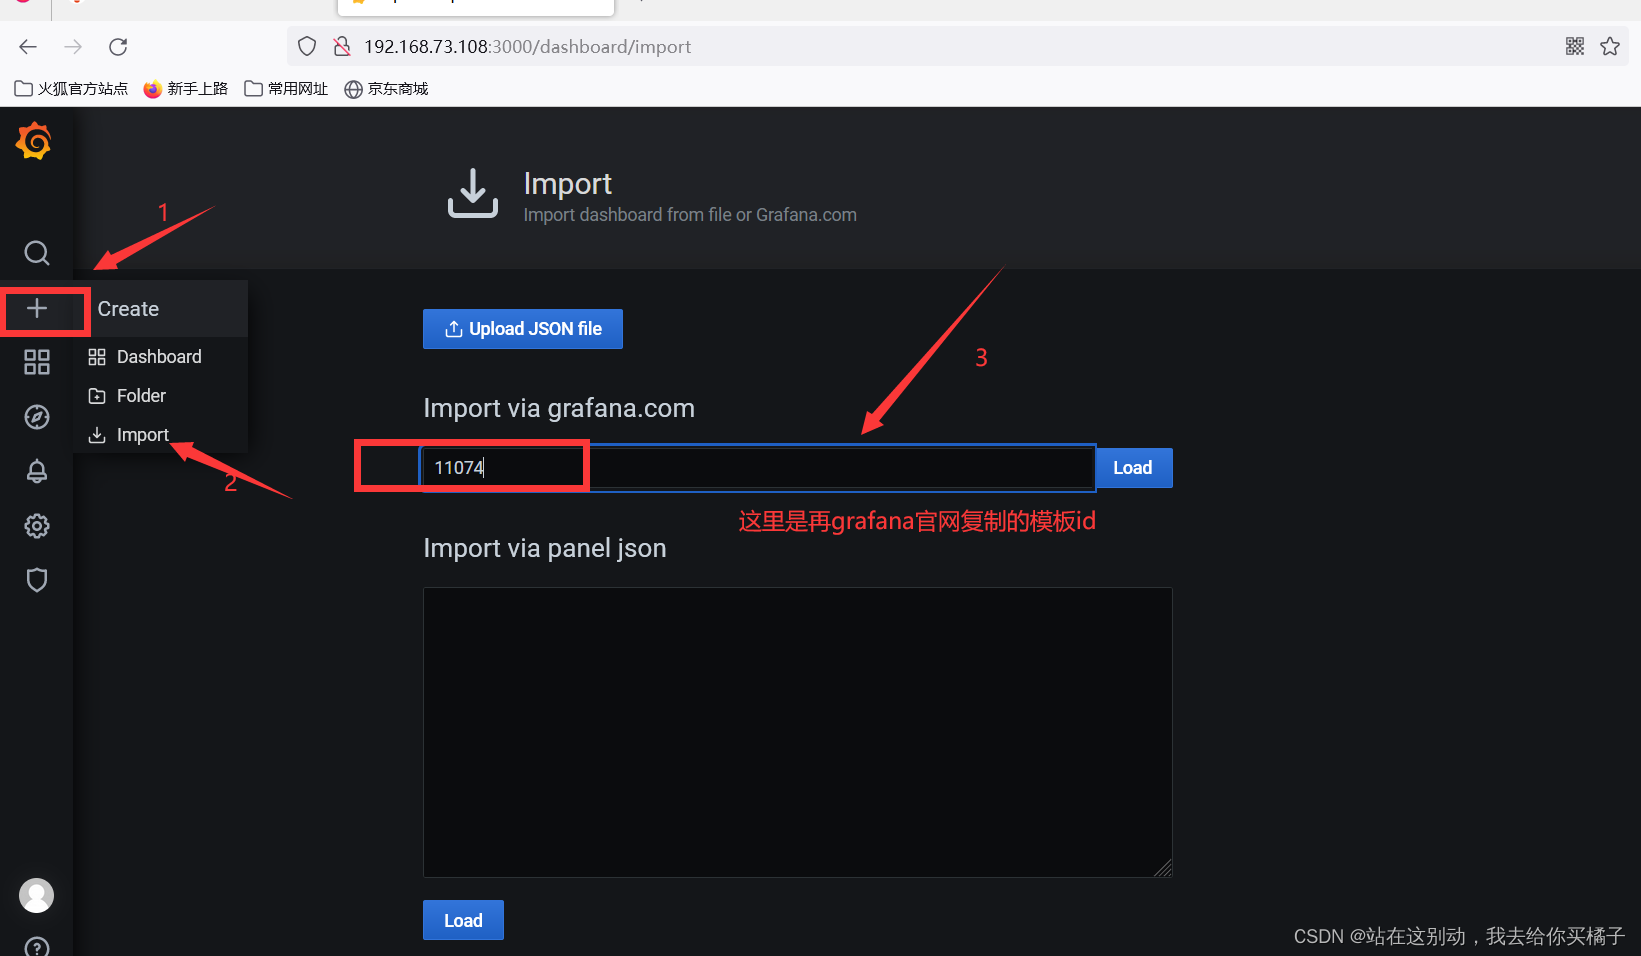
浏览器访问:https://grafana.com/grafana/dashboards ,在页面中搜索 node exporter ,选择适合的面板,点击 Copy ID 或者 Download JSON


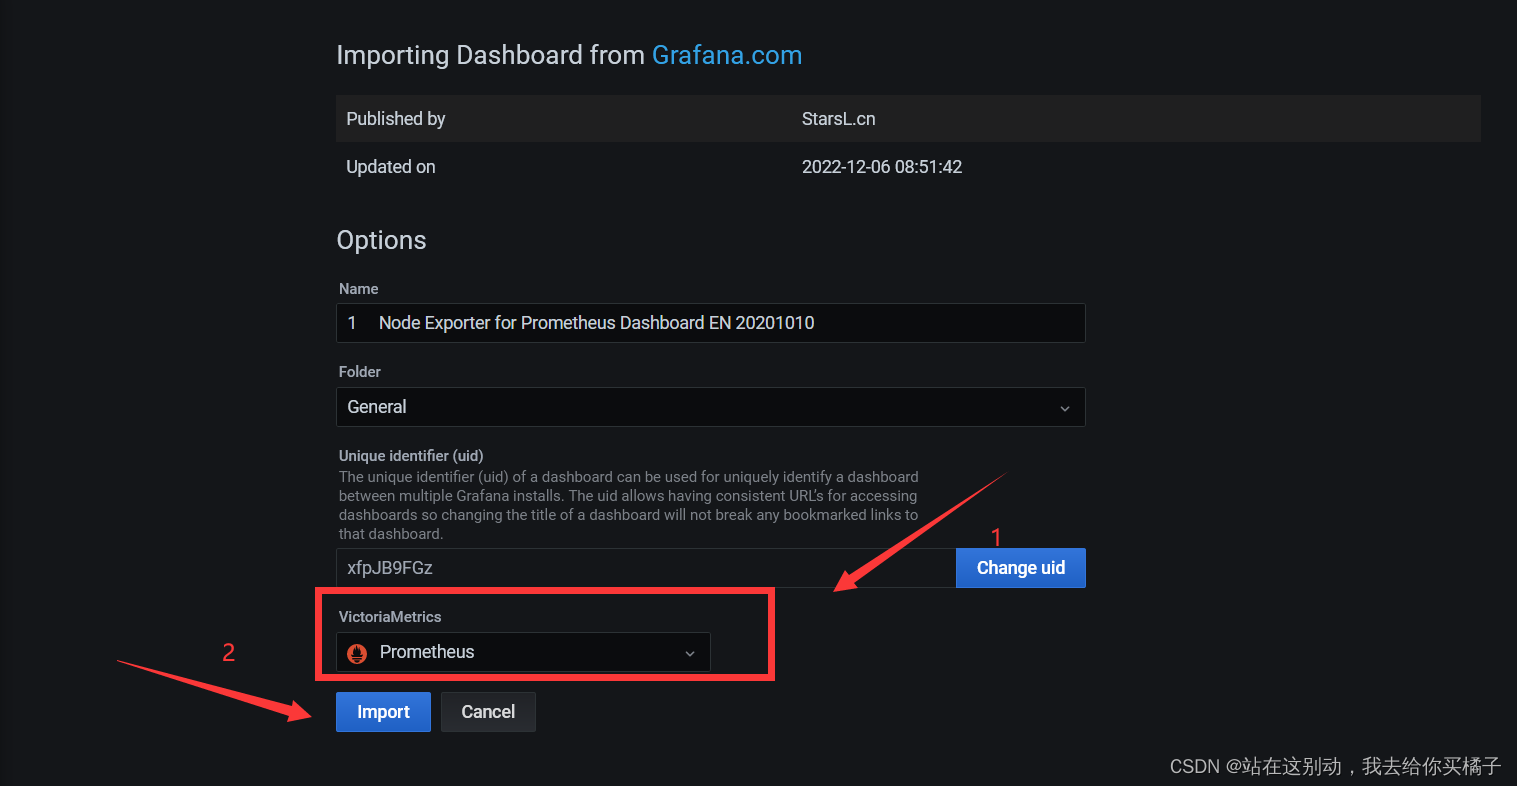
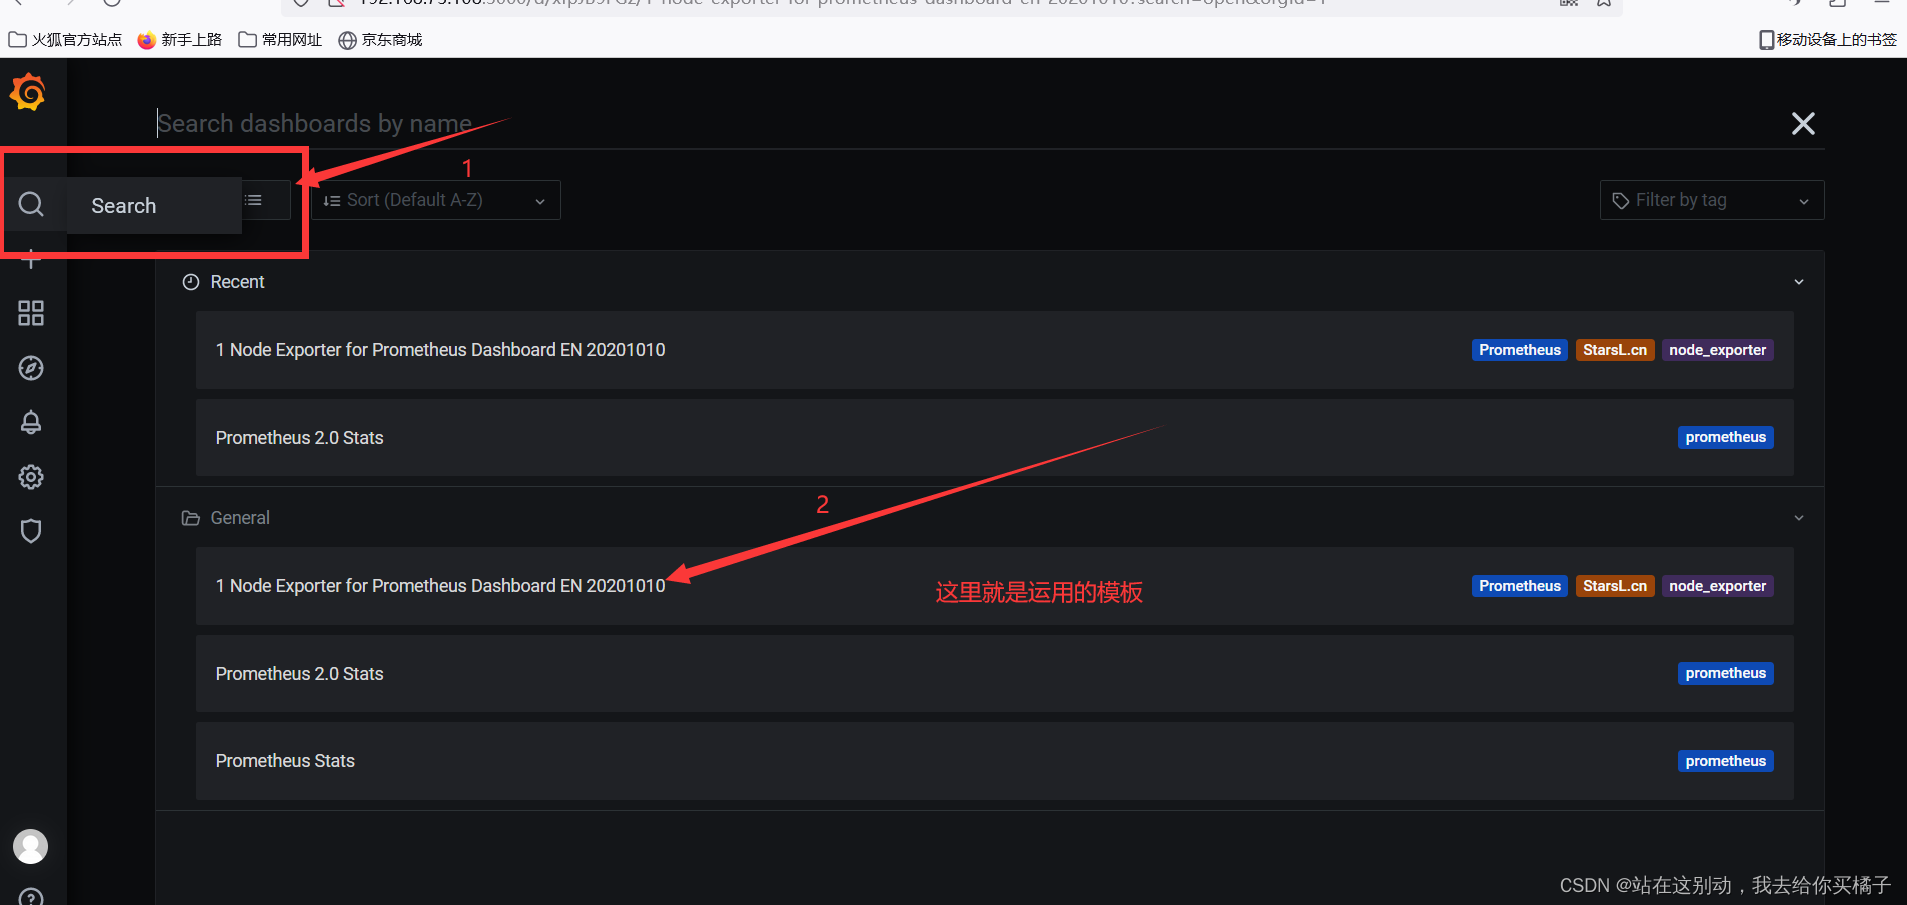
在 grafana 页面中,+ Create -> Import ,输入面板 ID 号或者上传 JSON 文件,点击 Load,即可导入监控面板

(4)删除模板操作

grafana%E7%9A%84%E4%B8%AD%E6%96%87%E6%8F%92%E4%BB%B6%E5%AE%89%E8%A3%85"> 4.2 grafana的中文插件安装
1、备份public目录

mv /usr/share/grafana/public /usr/share/grafana/public.source

2、备份/usr/sbin/grafana-server和grafana-cli

cp /usr/sbin/grafana-server /usr/sbin/grafana-server.source

cp /usr/sbin/grafana-cli /usr/sbin/grafana-cli.source

3、进入grafana-chinese目录 停止grafana服务,拷贝grafana/bin/linux-amd64/grafana-server 和 grafana-cli /usr/sbin目录

systemctl stop grafana-server
/bin/cp -rp bin/linux-amd64/grafana-server /usr/sbin/
/bin/cp -rp bin/linux-amd64/grafana-cli /usr/sbin/

4、拷贝grafana/public 到 /usr/share/grafana/

/bin/cp -rp public /usr/share/grafana/

5、启动grafana-server

systemctl start grafana-server
2. 部署 Prometheus 服务发现
2.1 基于文件的服务发现
基于文件的服务发现是仅仅略优于静态配置的服务发现方式,它不依赖于任何平台或第三方服务,因而也是最为简单和通用的实现方式。
Prometheus Server 会定期从文件中加载 Target 信息,文件可使用 YAML 和 JSON 格式,它含有定义的 Target 列表,以及可选的标签信息。
实验前准备
将就手动添加的监控项清除。

(1)创建用于服务发现的文件,在文件中配置所需的 target
cd /usr/local/prometheus
mkdir targets
vim targets/node-exporter.yaml
- targets:
- 192.168.73.105:9100
- 192.168.73.106:9100
labels:
app: node-exporter
job: node
#修改 prometheus 配置文件,发现 target 的配置,定义在配置文件的 job 之中
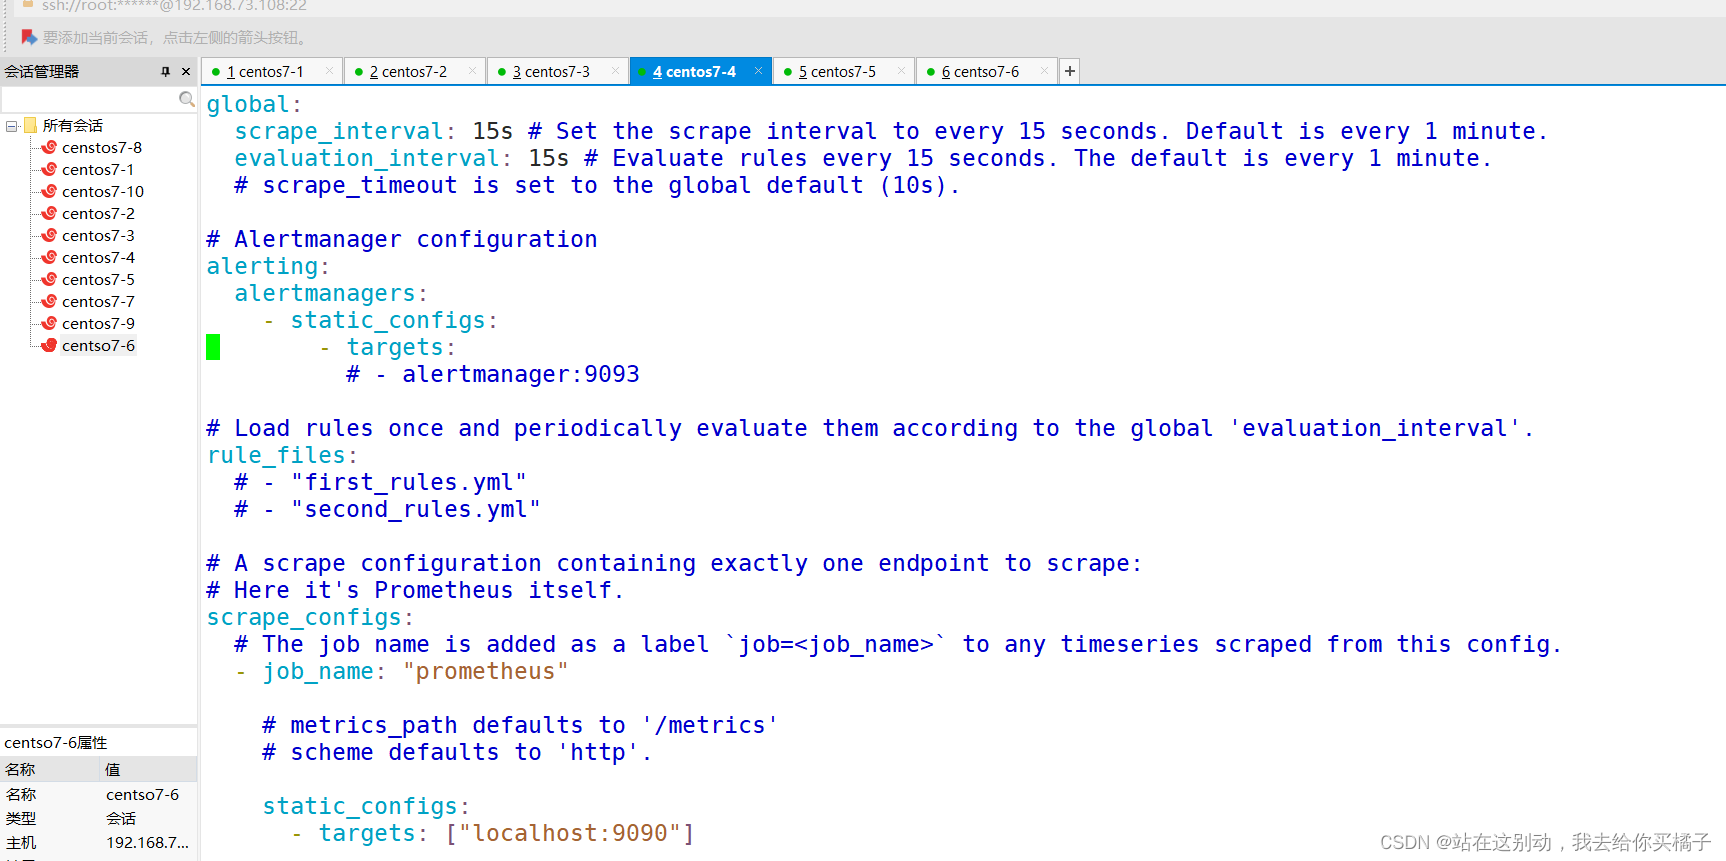
vim /usr/local/prometheus/prometheus.yml
......
scrape_configs:
- job_name: nodes
file_sd_configs: #指定使用文件服务发现
- files: #指定要加载的文件列表
- targets/node*.yaml #文件加载支持通配符
refresh_interval: 2m #每隔 2 分钟重新加载一次文件中定义的 Targets,默认为 5m
systemctl reload prometheus 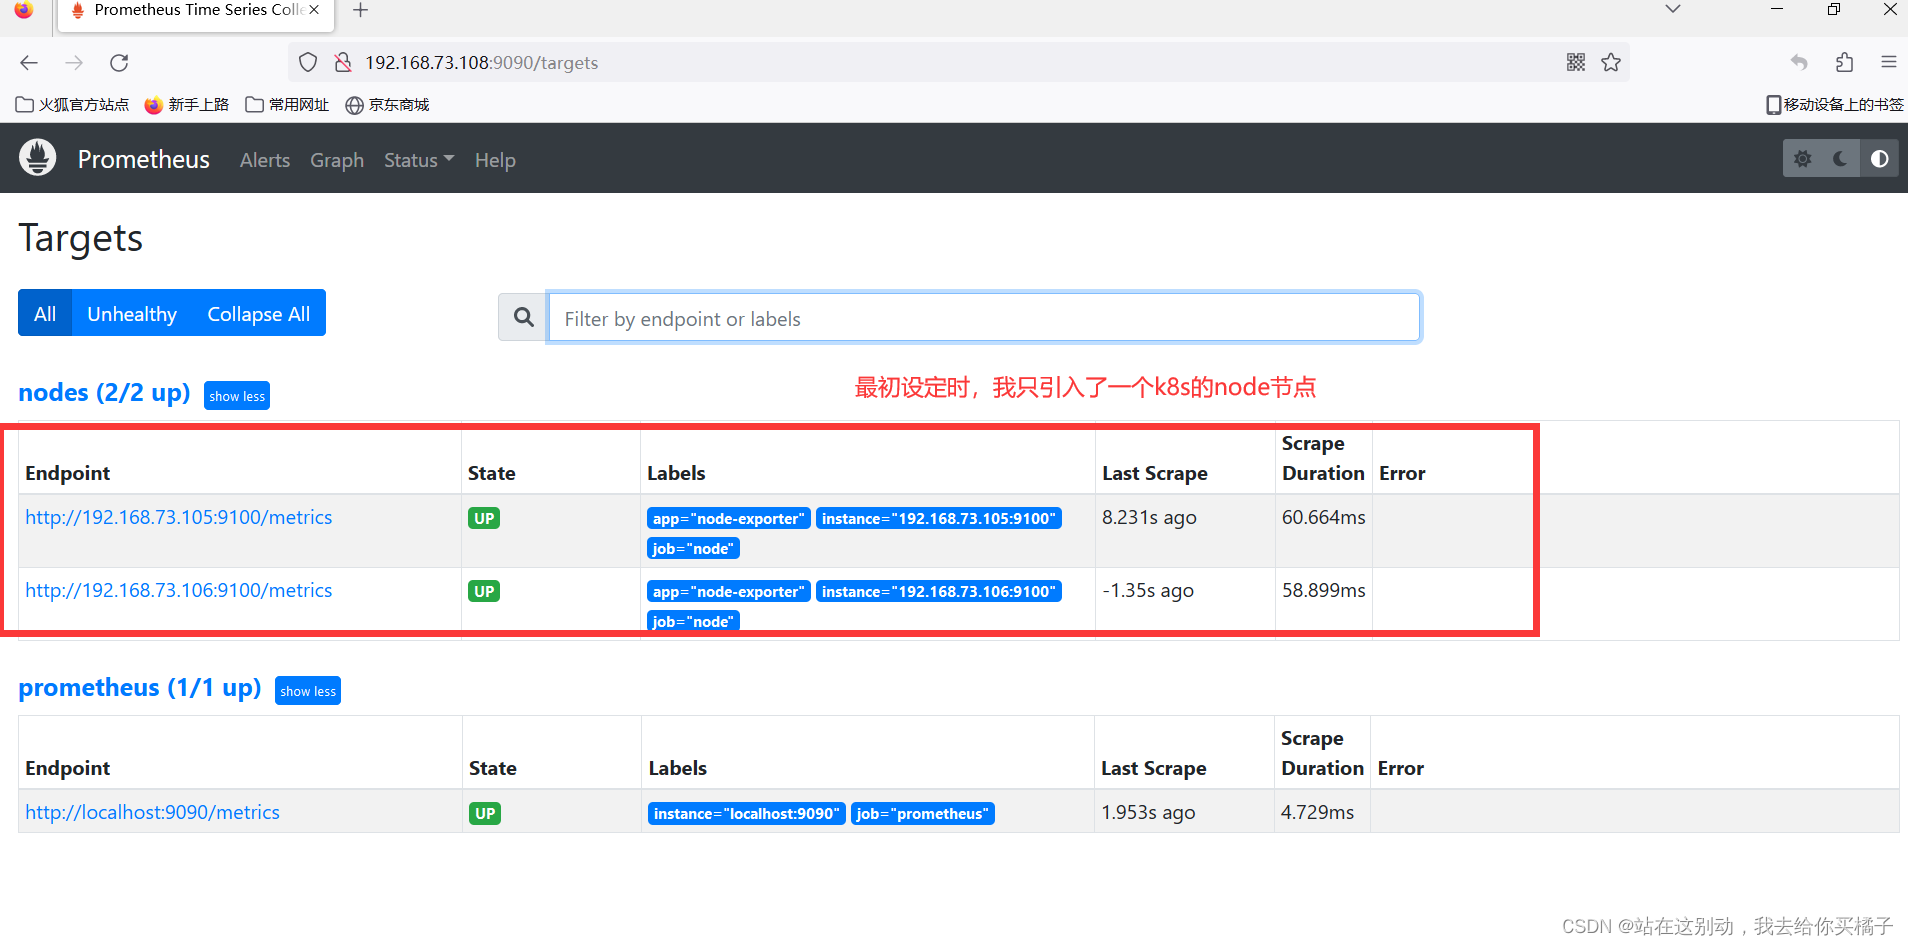
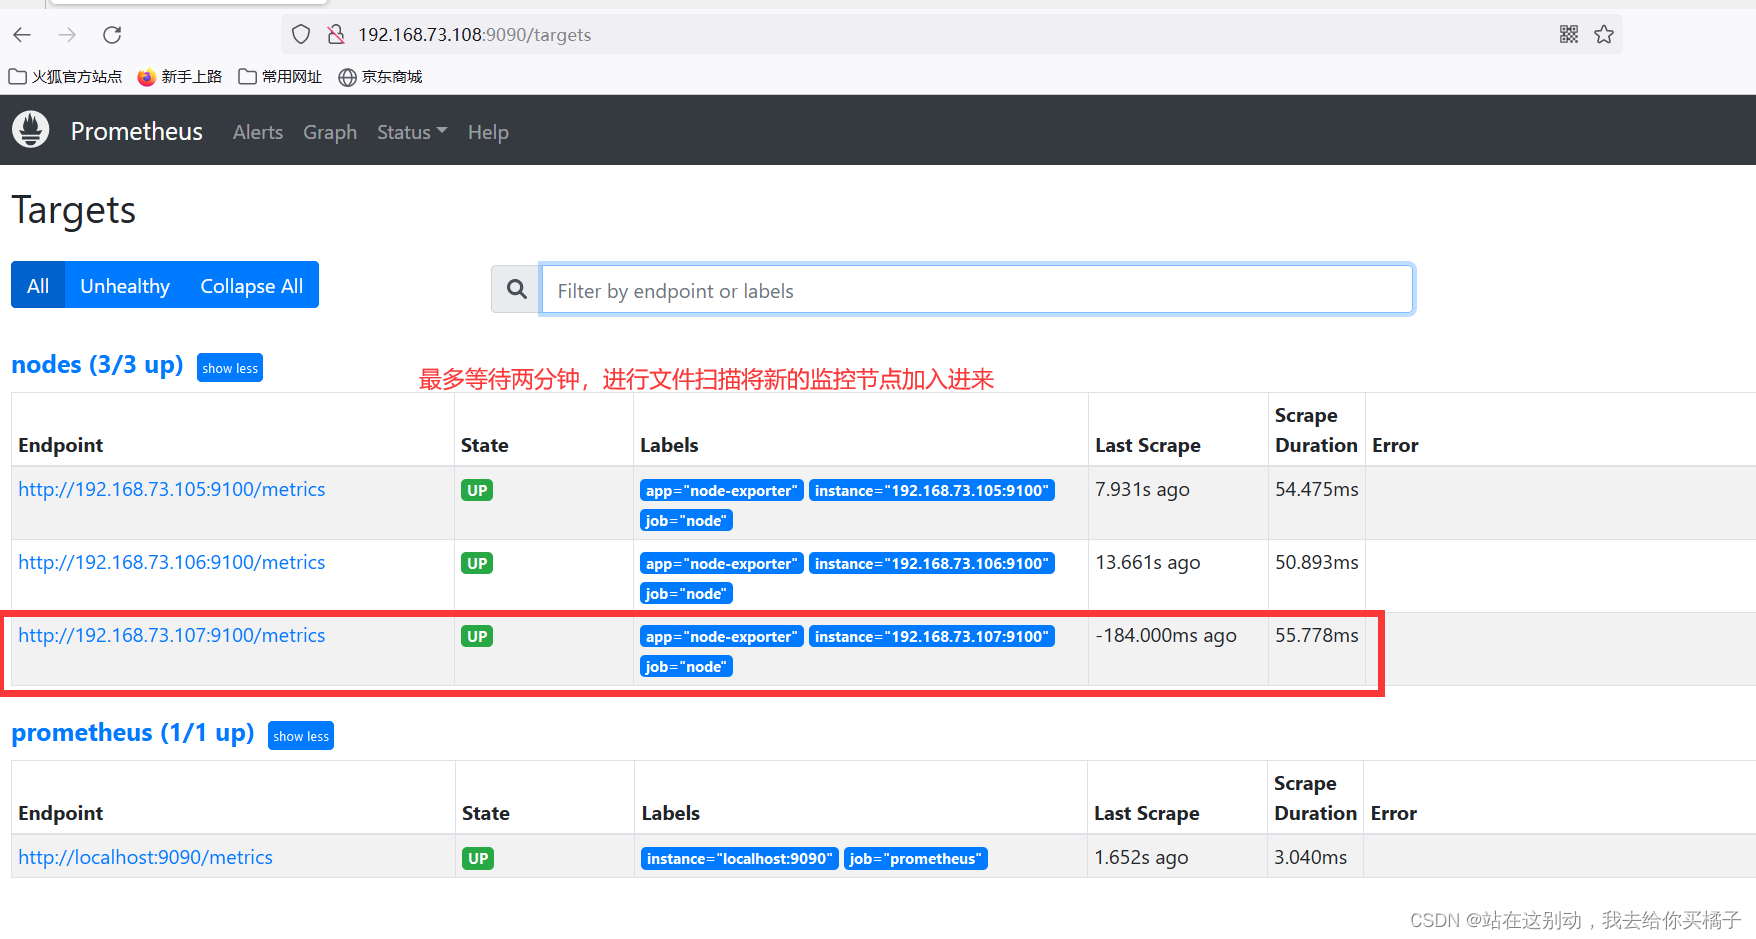
(2)在载入的文件中添加新的node节点监控

2.2 基于 Consul 的服务发现
Consul 是一款基于 golang 开发的开源工具,主要面向分布式,服务化的系统提供服务注册、服务发现和配置管理的功能。提供服务注册/发现、健康检查、Key/Value存储、多数据中心和分布式一致性保证等功能。
下载地址:https://www.consul.io/downloads/
(1)部署Consul服务
mkdir -p /opt/prometheus/consul
cd /opt/prometheus/consul
unzip consul_1.9.2_linux_amd64.zip
mv consul /usr/local/bin/

#创建 Consul 服务的数据目录和配置目录
mkdir /var/lib/consul-data
mkdir /etc/consul/

#使用 server 模式启动 Consul 服务
consul agent \
-server \
-bootstrap \
-ui \
-data-dir=/var/lib/consul-data \
-config-dir=/etc/consul/ \
-bind=192.168.73.108 \
-client=0.0.0.0 \
-node=consul-server01 &> /var/log/consul.log &

#查看 consul 集群成员
consul members 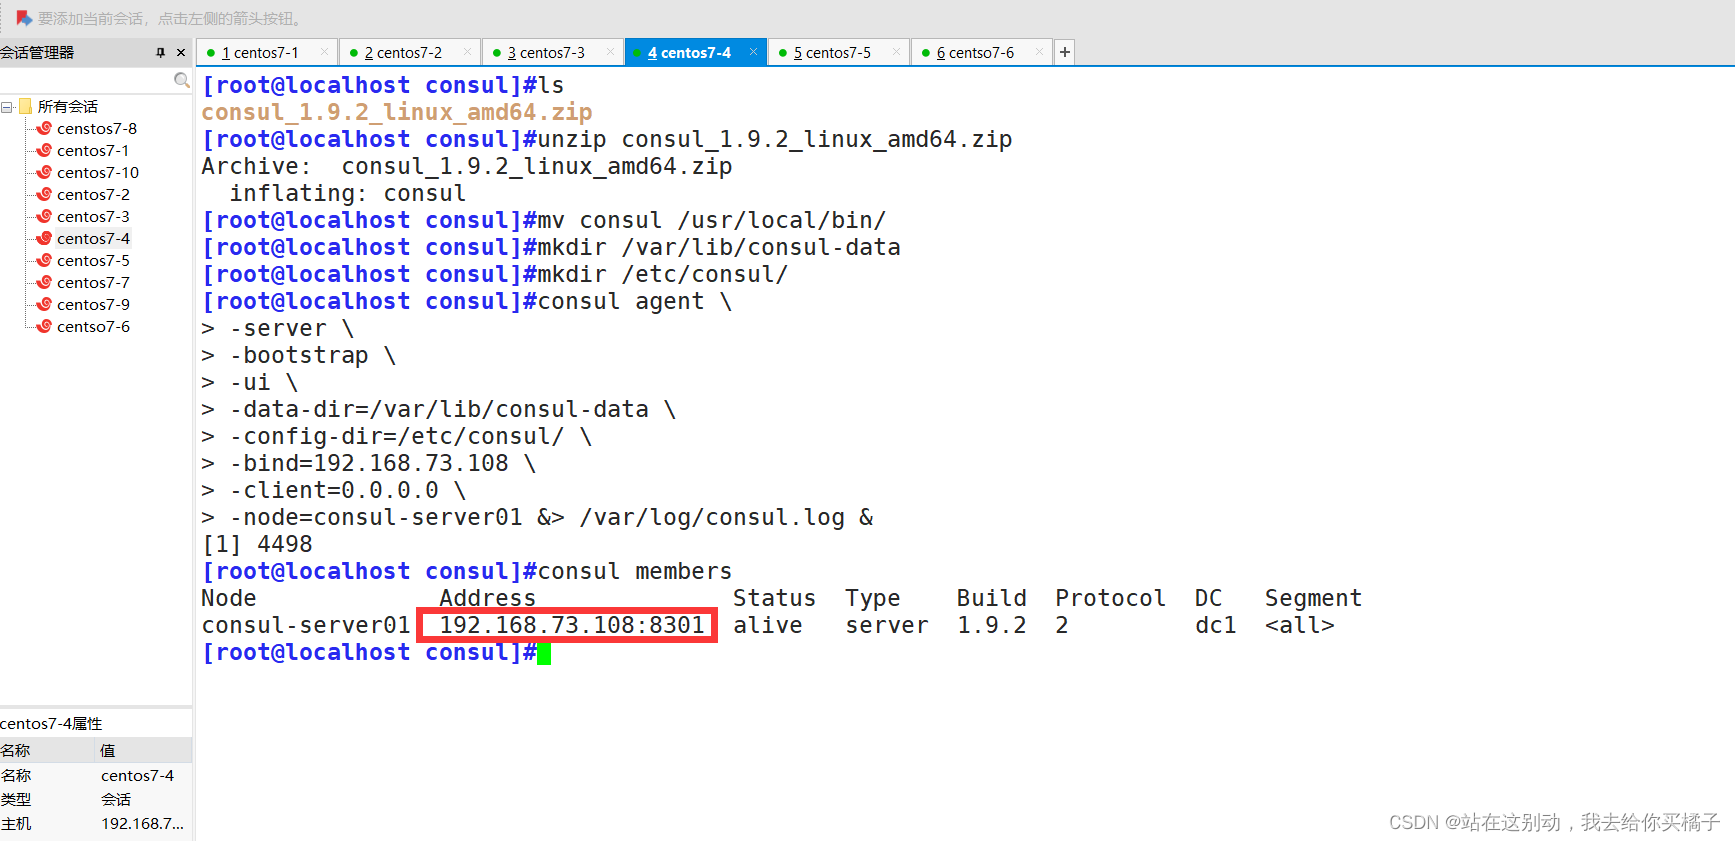
(2)在consul中注册service
#在配置目录中添加文件
vim /etc/consul/nodes.json
{
  "services": [
    {
      "id": "node_exporter-node01",
      "name": "node01",
      "address": "192.168.73.106",
      "port": 9100,
      "tags": ["nodes"],
      "checks": [{
        "http": "http://192.168.73.106:9100/metrics",
        "interval": "5s"
      }]
    },
    {
      "id": "node_exporter-node02",
      "name": "node02",
      "address": "192.168.73.107",
      "port": 9100,
      "tags": ["nodes"],
      "checks": [{
        "http": "http://192.168.73.107:9100/metrics",
        "interval": "5s"
      }]
    }
  ]
}
#让 consul 重新加载配置信息
consul reload

浏览器访问:http://192.168.73.108:8500 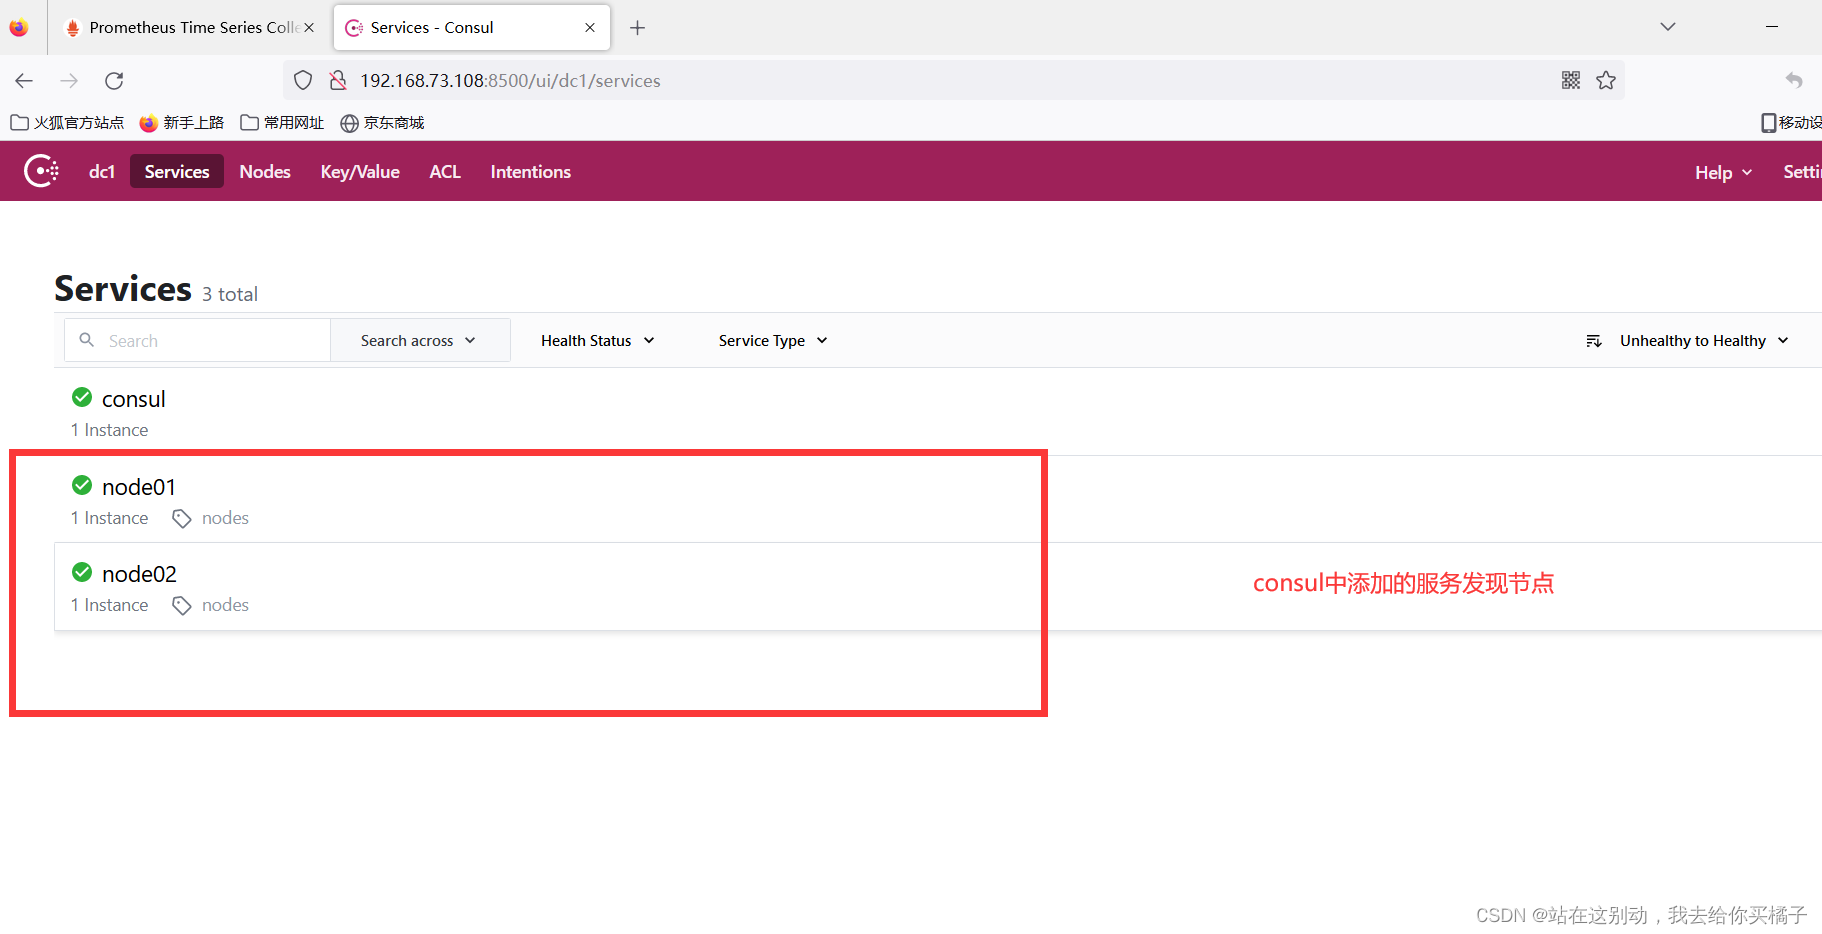
prometheus%20%E9%85%8D%E7%BD%AE%E6%96%87%E4%BB%B6%EF%BC%8C%E8%AE%A9Prometheus%E5%9F%BA%E4%BA%8Econsul%E8%BF%9B%E8%A1%8C%E6%9C%8D%E5%8A%A1%E5%8F%91%E7%8E%B0"> (3)修改 prometheus 配置文件,让Prometheus基于consul进行服务发现
(3)修改 prometheus 配置文件
vim /usr/local/prometheus/prometheus.yml
......
  - job_name: nodes
    consul_sd_configs:                  #指定使用 consul 服务发现
    - server: 192.168.73.108:8500        #指定 consul 服务的端点列表
      tags:                             #指定 consul 服务发现的 services 中哪些 service 能够加入到 prometheus 监控的标签
      - nodes
      refresh_interval: 2m


systemctl reload prometheus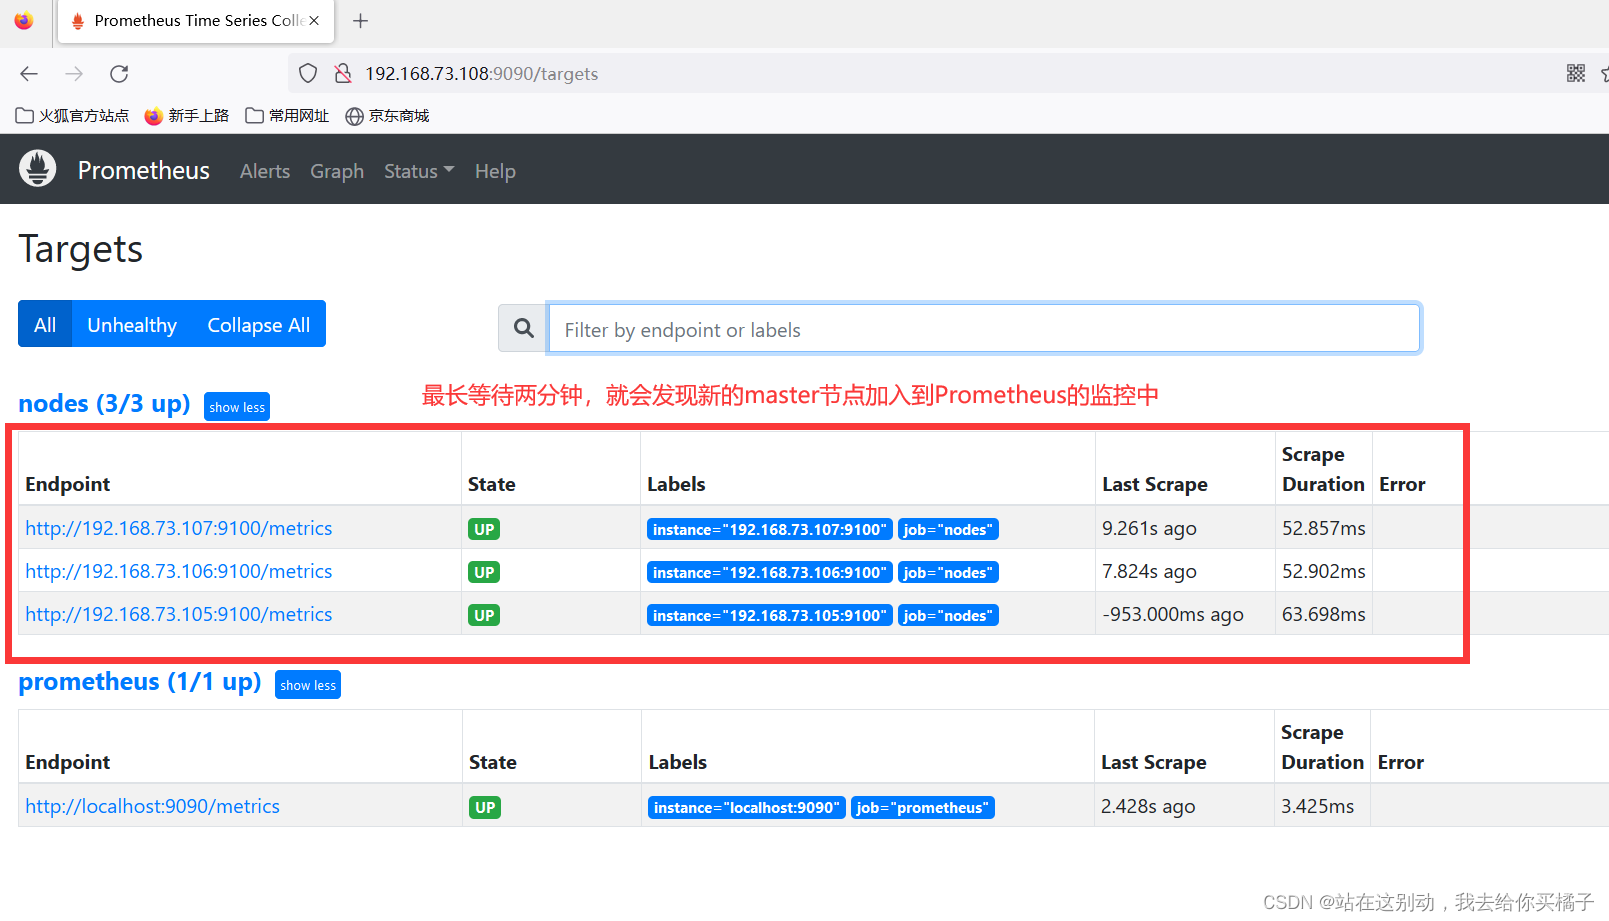
浏览器查看 Prometheus 页面的 Status -> Targets 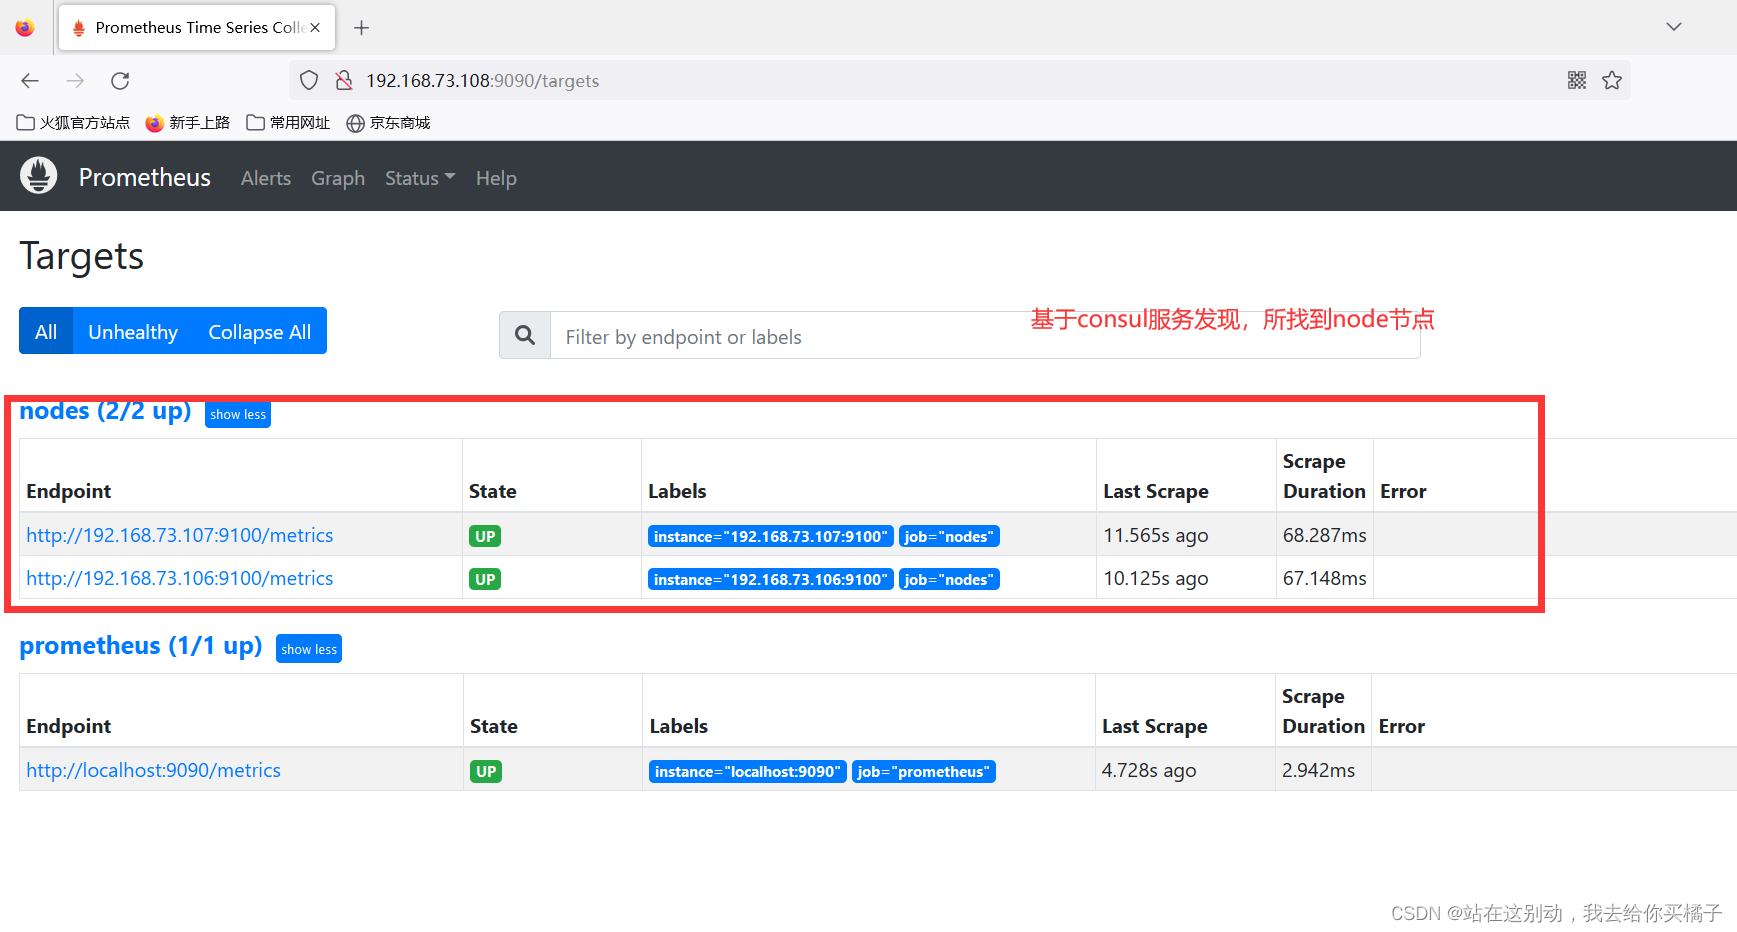
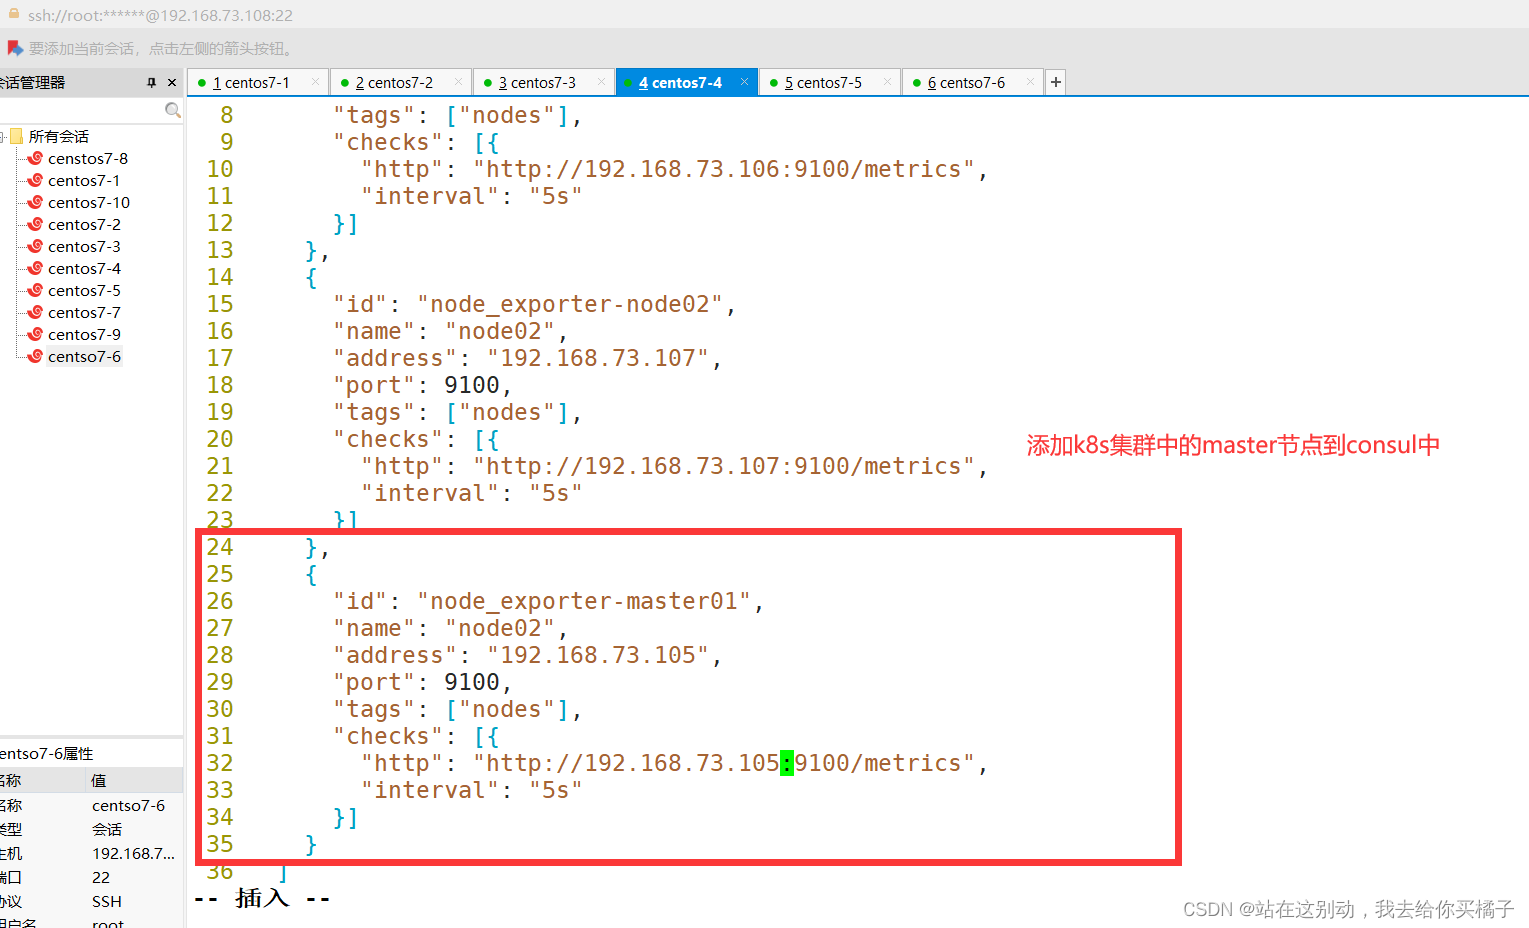
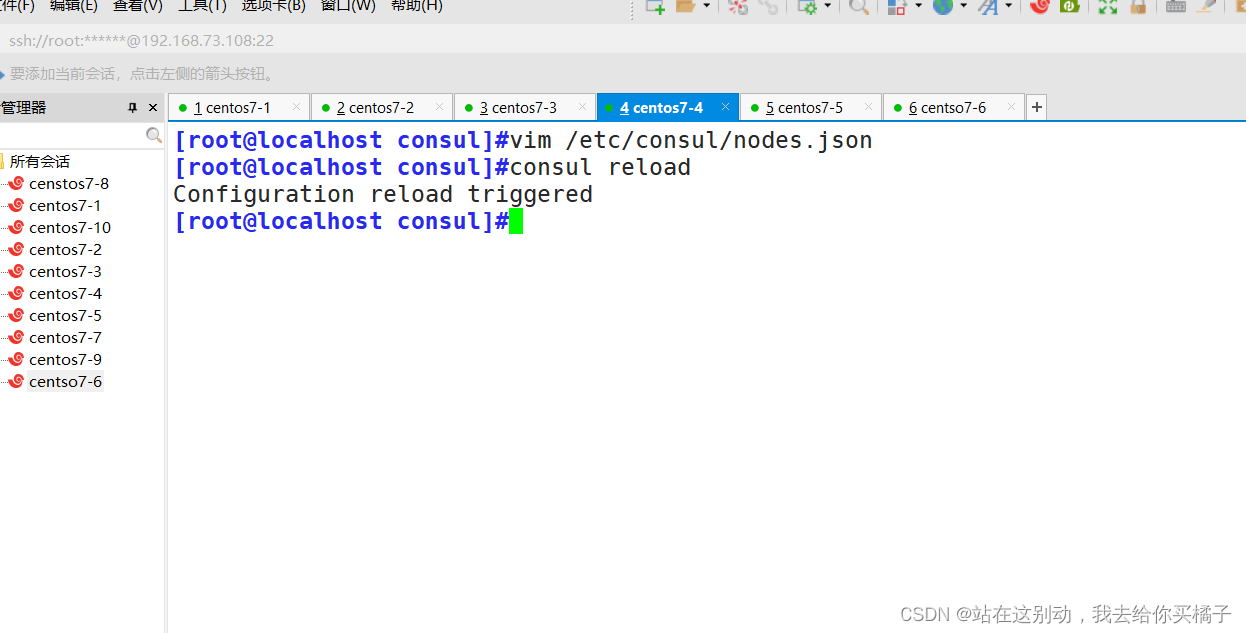
(4)在consul中添加node节点,从而改变Prometheus的监控节点
vim /etc/consul/nodes.json

{
  "services": [
    {
      "id": "node_exporter-node01",
      "name": "node01",
      "address": "192.168.73.106",
      "port": 9100,
      "tags": ["nodes"],
      "checks": [{
        "http": "http://192.168.73.106:9100/metrics",
        "interval": "5s"
      }]
    },
    {
      "id": "node_exporter-node02",
      "name": "node02",
      "address": "192.168.73.107",
      "port": 9100,
      "tags": ["nodes"],
      "checks": [{
        "http": "http://192.168.73.107:9100/metrics",
        "interval": "5s"
      }]
    },
   ########向consul中新添加的master节点##################
    {
      "id": "node_exporter-master01",
      "name": "node02",
      "address": "192.168.73.105",
      "port": 9100,
      "tags": ["nodes"],
      "checks": [{
        "http": "http://192.168.73.105:9100/metrics",
        "interval": "5s"
      }]
    }
  ]
}


#让 consul 重新加载配置信息
consul reload
(5)consul注销与重新注册service
#让 consul 注销 Service
consul services deregister -id="node_exporter-node02"

#重新注册
consul services register /etc/consul/nodes.json
2.3 基于 Kubernetes API 的服务发现
基于 Kubernetes API 的服务发现机制,支持将API Server 中 Node、Service、Endpoint、Pod 和 Ingress 等资源类型下相应的各资源对象视作 target, 并持续监视相关资源的变动
●Node、Service、Endpoint、Pod 和 Ingress 资源分别由各自的发现机制进行定义
●负责发现每种类型资源对象的组件,在 Prometheus 中称为一个 role
●支持在集群上基于 DaemonSet 控制器部署 node-exporter 后发现各 Node 节点,也可以通过 kubelet 来作为 Prometheus 发现各 Node 节点的入口
#基于 Kubernetes 发现机制的部分配置参数
# The API server addresses. If left empty, Prometheus is assumed to run inside of the cluster and will discover API servers automatically
and use the pod's
# CA certificate and bearer token file at /var/run/secrets/kubernetes.io/serviceaccount/.
[ api_server: <host> ]

# The Kubernetes role of entities that should be discovered. One of endpoints, service, pod, node, or ingress.
role: <string>

# Optional authentication information used to authenticate to the API server.
# Note that 'basic_auth', 'bearer_token'和'bearer_token_file' 等认证方式互斥;
[ bearer_token: <secret> ]
[ bearer_token_file: <filename> ]

# TLS configuration.
tls_config:
# CA certificate to validate API server certificate with.
[ ca_file: <filename> ]

# Certificate and key files for client cert authentication to the server.
[ cert_file: <filename> ]
[ key_file: <filename> ]

# ServerName extension to indicate the name of the server.
[ server_name: <string> ]

# Optional namespace discovery. If omitted, all namespaces are used.
namespaces:
names:
[ - <string> ]