Prometheus监控报警-web,域名,端口, 钉钉版本
采用文章
https://www.yuque.com/youngfit/qok2pe/nypstd#616a2e58
https://www.jianshu.com/p/eae67b770c3e
https://blog.csdn.net/Sebastien23/article/details/113645177
https://www.cnblogs.com/sheepboy/p/17242916.html#_label10
https://blog.csdn.net/W1124824402/article/details/128408290?spm=1001.2014.3001.5501

监控docker起的容器服务,探活,端口等

https://blog.csdn.net/weixin_43266367/article/details/129110541

这个比较详细
钉钉报警实战
在企业中,如果企业要求使用钉钉进行工作交流,那我们也可以使用钉钉接收报警消息;
钉钉会有群,我们可以创建1个云计算团队的钉钉群,在群里创建1个报警机器人;
这个机器人只要报警,在群里的云计算/运维人员都能看见
流程:创建群聊->群设置->智能群助手->添加机器人->自定义
创建钉钉报警机器人
Alertmanager 配置前的准备
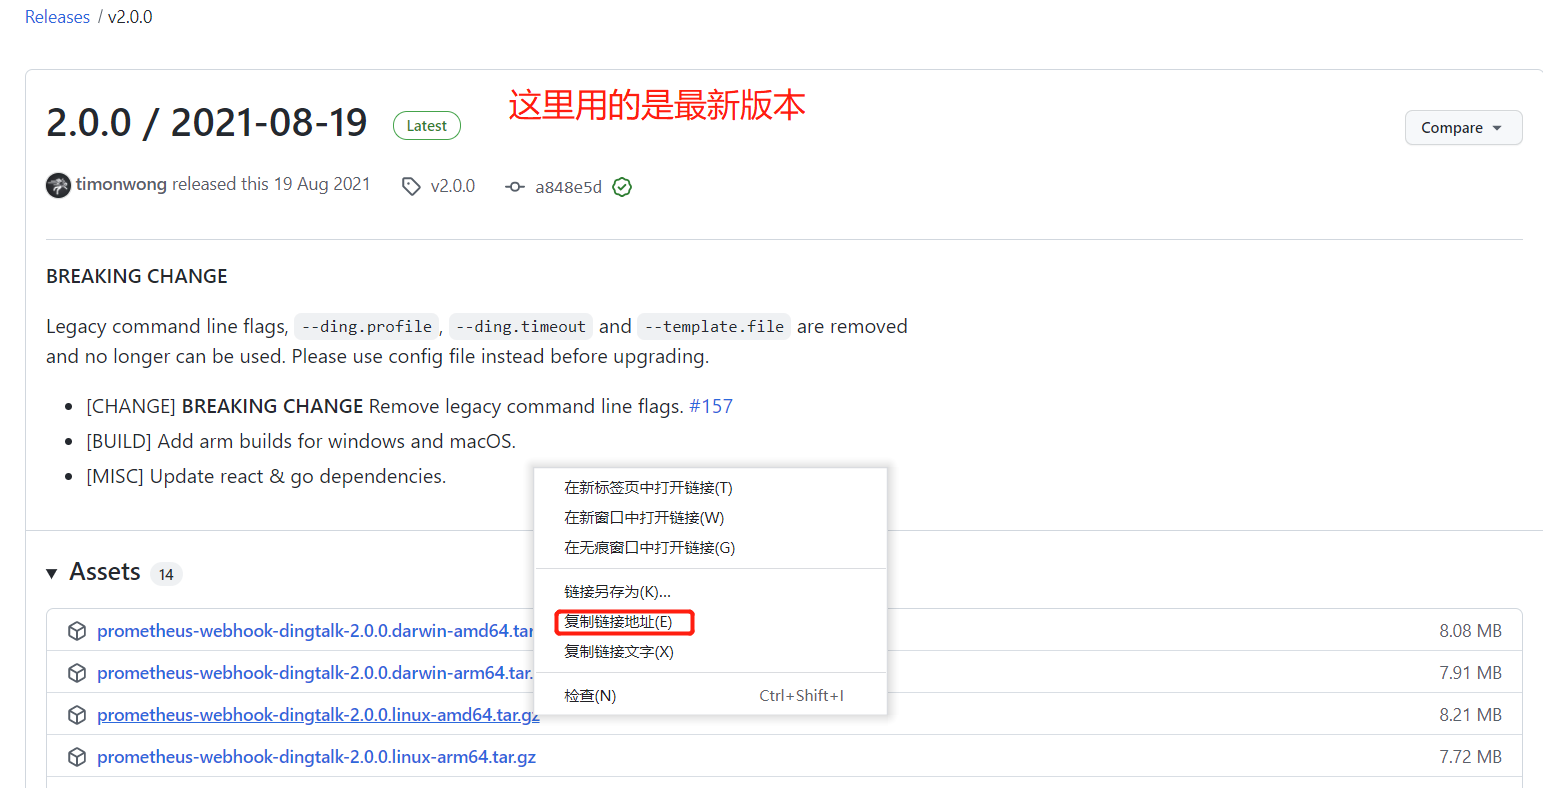
需要额外安装钉钉报警的插件,从github官网上搜索即可
插件官网: https://github.com/timonwong/prometheus-webhook-dingtalk
[root@prometheus alertmanager]# pwd
/usr/local/alertmanager
[root@prometheus alertmanager]# wget https://github.com/timonwong/prometheus-webhook-dingtalk/releases/download/v2.0.0/prometheus-webhook-dingtalk-2.0.0.linux-amd64.tar.gz
[root@prometheus alertmanager]# tar -xvzf prometheus-webhook-dingtalk-2.0.0.linux-amd64.tar.gz
[root@prometheus alertmanager]# cd prometheus-webhook-dingtalk-2.0.0.linux-amd64
[root@prometheus prometheus-webhook-dingtalk-2.0.0.linux-amd64]# cp config.example.yml config.yml
[root@prometheus prometheus-webhook-dingtalk-2.0.0.linux-amd64]# vim config.yml
#启动
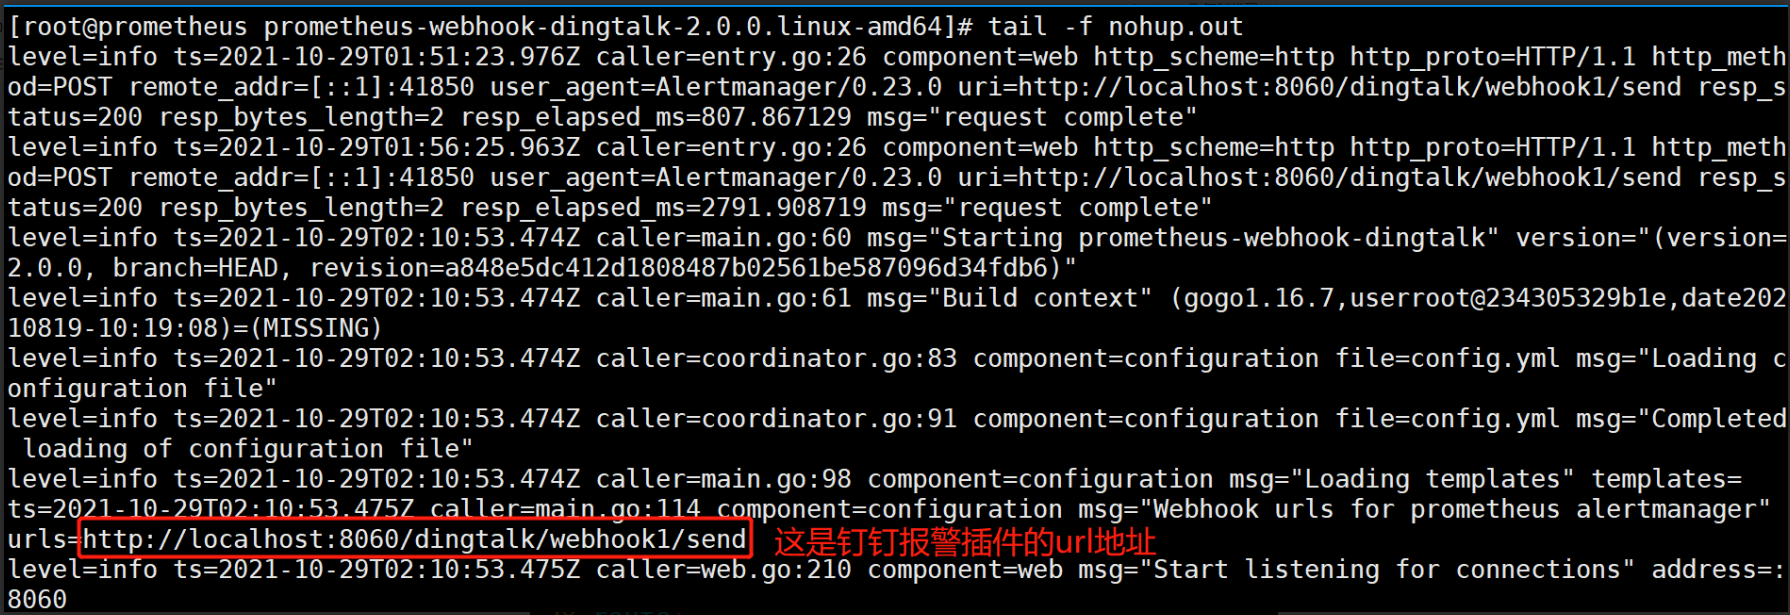
[root@prometheus prometheus-webhook-dingtalk-2.0.0.linux-amd64]# nohup ./prometheus-webhook-dingtalk --config.file=config.yml & #回车即可,当前目录下会产生nohup.out的日志文件
[root@prometheus prometheus-webhook-dingtalk-2.0.0.linux-amd64]# tail -f nohup.out
[root@prometheus alertmanager]# pwd
/usr/local/alertmanager
[root@prometheus alertmanager]# vim /etc/alertmanager/alertmanager.yml
三,安装钉钉服务(不推荐Docker安装,新版本的安装文档已经很久没更新)
1,二进制安装
-
**下载地址:**https://github.com/timonwong/prometheus-webhook-dingtalk/releases
-
本次安装版本为
2.1.0 -
根据服务器情况选择安装目录,上传安装包。
- 部署包下载完毕,开始安装
cd /prometheus
tar -xvzf prometheus-webhook-dingtalk-2.1.0.linux-amd64.tar.gz
mv prometheus-webhook-dingtalk-2.1.0.linux-amd64 webhook_dingtalk
cd webhook_dingtalk
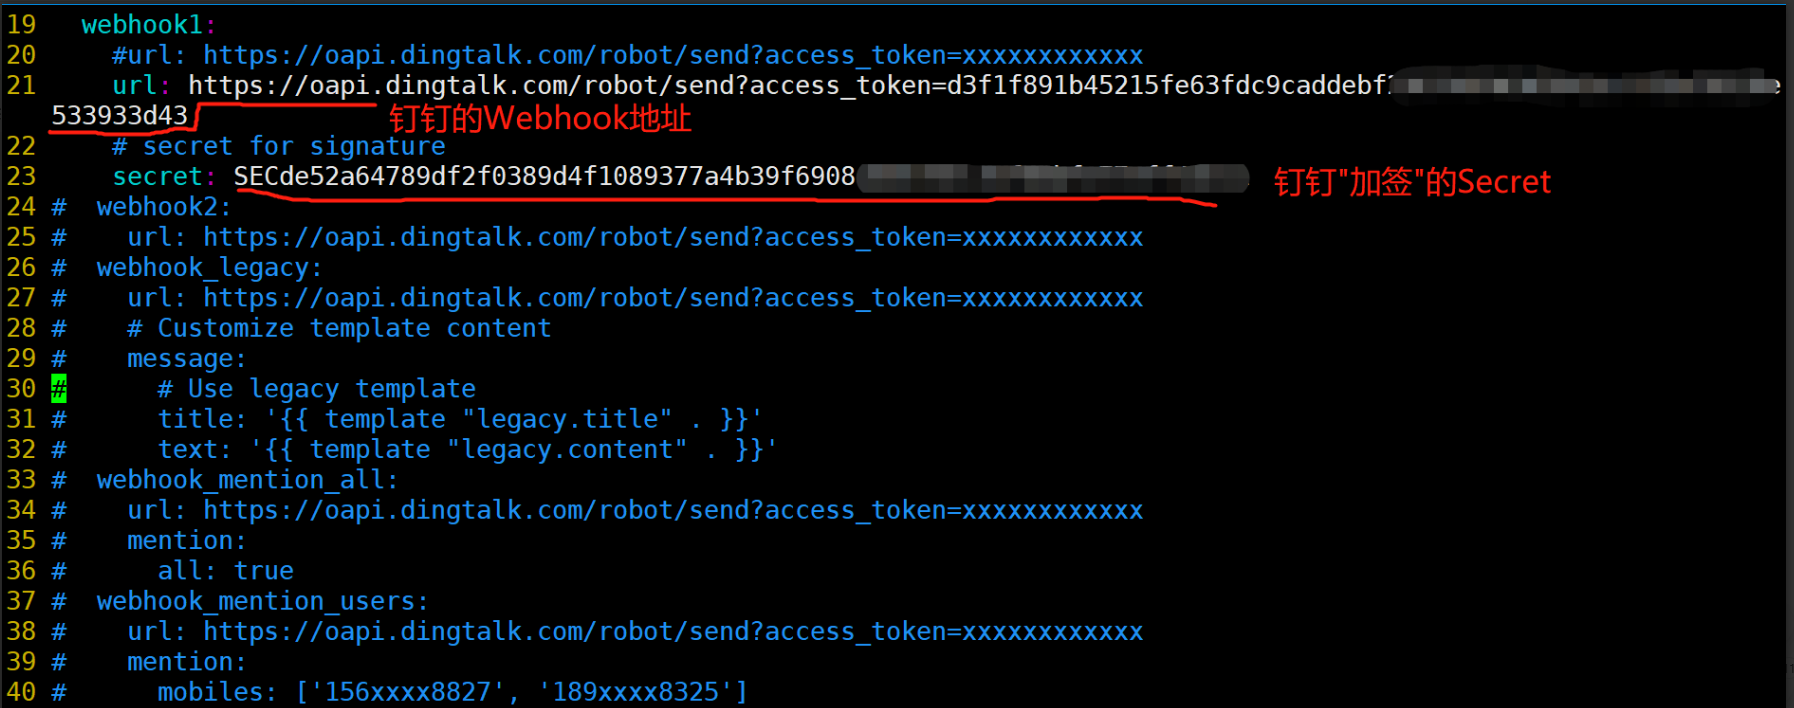
- 编写配置文件(复制之后切记删除#的所有注释,否则启动服务时会报错),将上述获取的钉钉webhook地址填写到如下文件
vim dingtalk.yml
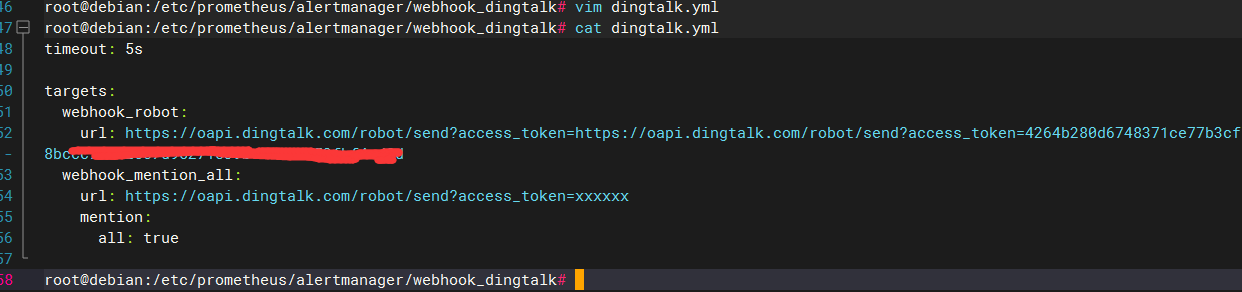
timeout: 5s

targets:
  webhook_robot:
  	# 钉钉机器人创建后的webhook地址
    url: https://oapi.dingtalk.com/robot/send?access_token=xxxxxxxxxxxx
  webhook_mention_all:
  	# 钉钉机器人创建后的webhook地址
    url: https://oapi.dingtalk.com/robot/send?access_token=xxxxxxxxxxxx
    # 提醒全员
    mention:
      all: true
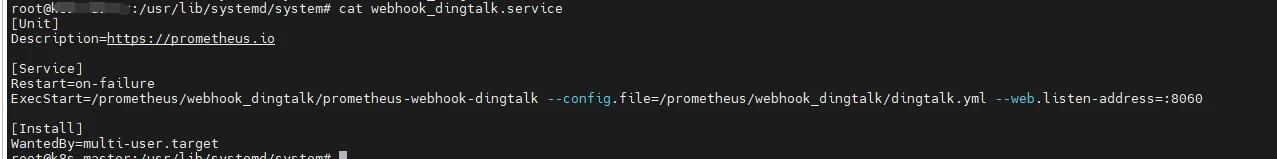
- 进行系统service编写
创建webhook_dingtalk配置文件
cd /usr/lib/systemd/system
vim webhook_dingtalk.service
- webhook_dingtalk.service 文件填入如下内容后保存
:wq
[Unit]
Description=https://prometheus.io

[Service]
Restart=on-failure
ExecStart=/prometheus/webhook_dingtalk/prometheus-webhook-dingtalk --config.file=/prometheus/webhook_dingtalk/dingtalk.yml --web.listen-address=:8060

[Install]
WantedBy=multi-user.target
- 查看配置文件
cat webhook_dingtalk.service
- 刷新服务配置并启动服务
systemctl daemon-reload
systemctl start webhook_dingtalk.service
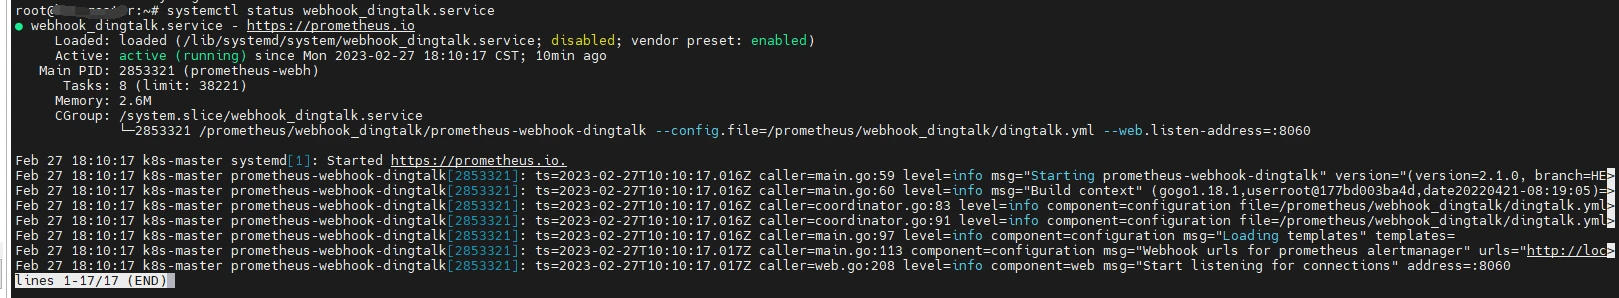
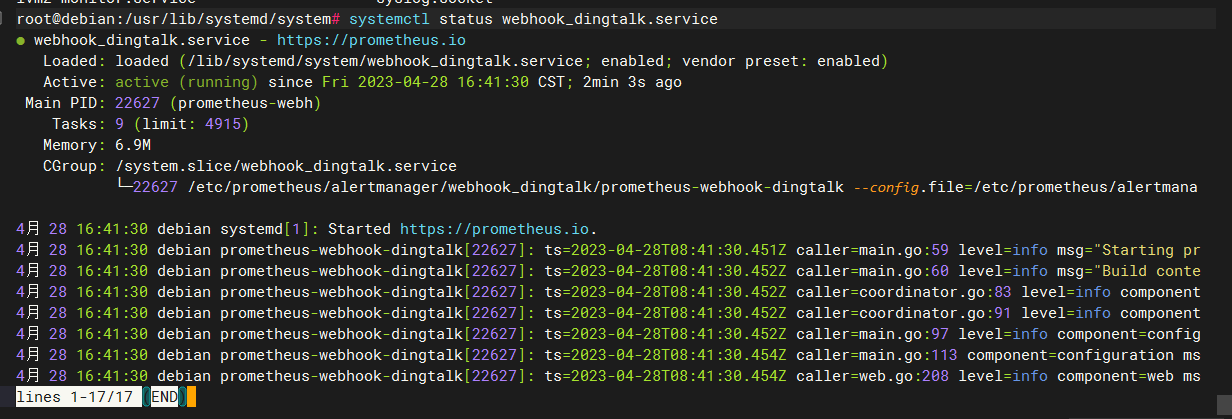
- 查看服务运行状态
systemctl status webhook_dingtalk.service
- 设置开机自启动
systemctl enable webhook_dingtalk.service
配置Alertmanager
-
打开
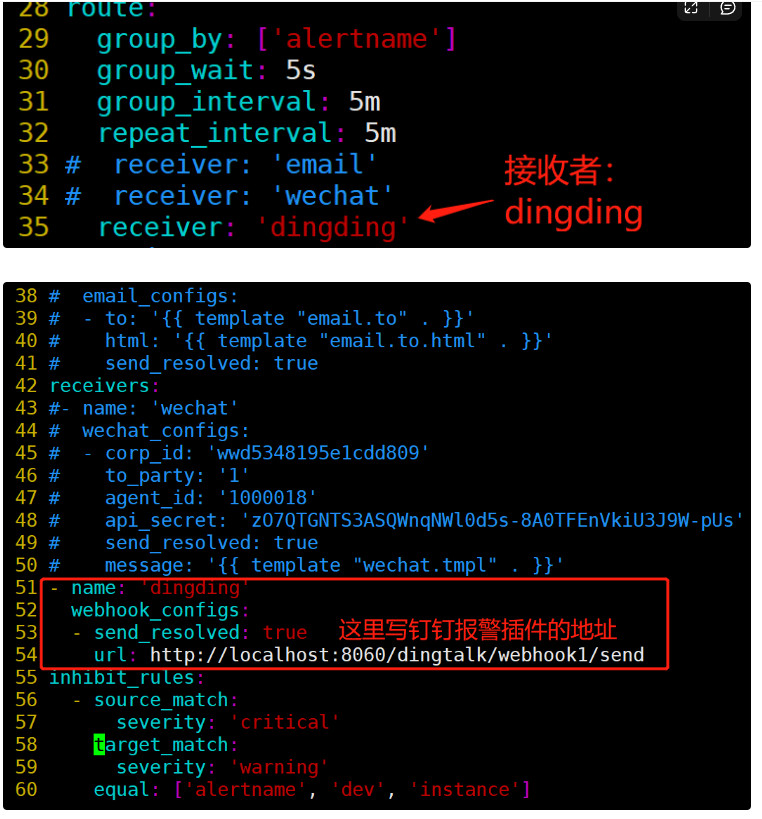
/prometheus/alertmanager/alertmanager.yml,修改为如下内容global: # 在没有报警的情况下声明为已解决的时间 resolve_timeout: 5m route: # 接收到告警后到自定义分组 group_by: ["alertname"] # 分组创建后初始化等待时长 group_wait: 10s # 告警信息发送之前的等待时长 group_interval: 30s # 重复报警的间隔时长 repeat_interval: 5m # 默认消息接收 receiver: "dingtalk" receivers: # 钉钉 - name: 'dingtalk' webhook_configs: # prometheus-webhook-dingtalk服务的地址 - url: http://1xx.xx.xx.7:8060/dingtalk/webhook_robot/send send_resolved: true
在prometheus安装文件夹根目录增加alert_rules.yml配置文件,内容如下
我们引用子文件路径了

groups:
  - name: alert_rules
    rules:
      # CPU 使用率告警规则
      - alert: CpuUsageAlertWarning
        expr: sum(avg(irate(node_cpu_seconds_total{mode!='idle'}[5m])) without (cpu)) by (instance) > 0.60
        for: 2m
        labels:
          level: warning
        annotations:
          summary: "Instance {{ $labels.instance }} CPU usage high"
          description: "{{ $labels.instance }} CPU 使用率超过 60%(当前值:{{ $value }})"

      - alert: CpuUsageAlertSerious
        #expr: sum(avg(irate(node_cpu_seconds_total{mode!='idle'}[5m])) without (cpu)) by (instance) > 0.85
        expr: (100 - (avg by (instance) (irate(node_cpu_seconds_total{job=~".*",mode="idle"}[5m])) * 100)) > 85
        for: 3m
        labels:
          level: serious
        annotations:
          summary: "Instance {{ $labels.instance }} CPU usage high"
          description: "{{ $labels.instance }} CPU 使用率超过 85%(当前值:{{ $value }})"

      # 内存使用率告警规则
      - alert: MemUsageAlertWarning
        expr: avg by(instance) ((1 - (node_memory_MemFree_bytes + node_memory_Buffers_bytes + node_memory_Cached_bytes) / node_memory_MemTotal_bytes) * 100) > 70
        for: 2m
        labels:
          level: warning
        annotations:
          summary: "Instance {{ $labels.instance }} MEM usage high"
          description: "{{$labels.instance}}: 内存使用率超过 70%(当前值:{{ $value }})"

      - alert: MemUsageAlertSerious
        expr: (node_memory_MemTotal_bytes - node_memory_MemAvailable_bytes)/node_memory_MemTotal_bytes > 0.90
        for: 3m
        labels:
          level: serious
        annotations:
          summary: "Instance {{ $labels.instance }} MEM usage high"
          description: "{{ $labels.instance }} 内存使用率超过 90%(当前值:{{ $value }})"

      # 磁盘使用率告警规则
      - alert: DiskUsageAlertWarning
        expr: (1 - node_filesystem_free_bytes{fstype!="rootfs",mountpoint!="",mountpoint!~"/(run|var|sys|dev).*"} / node_filesystem_size_bytes) * 100 > 80
        for: 2m
        labels:
          level: warning
        annotations:
          summary: "Instance {{ $labels.instance }} Disk usage high"
          description: "{{$labels.instance}}: 磁盘使用率超过 80%(当前值:{{ $value }})"

      - alert: DiskUsageAlertSerious
        expr: (1 - node_filesystem_free_bytes{fstype!="rootfs",mountpoint!="",mountpoint!~"/(run|var|sys|dev).*"} / node_filesystem_size_bytes) * 100 > 90
        for: 3m
        labels:
          level: serious
        annotations:
          summary: "Instance {{ $labels.instance }} Disk usage high"
          description: "{{$labels.instance}}: 磁盘使用率超过 90%(当前值:{{ $value }})"

      # 文件句柄数告警规则
      - alert: NodeFileDescriptorUsage
        expr: avg by (instance) (node_filefd_allocated{} / node_filefd_maximum{}) * 100 > 60
        for: 2m
        labels:
          level: warning
        annotations:
          summary: "Instance {{ $labels.instance }} File Descriptor usage high"
          description: "{{$labels.instance}}: 文件句柄数超过 60%(当前值:{{ $value }})"

      # 负载情况告警规则
      - alert: NodeLoad15
        expr: avg by (instance) (node_load15{}) > 80
        for: 2m
        labels:
          level: warning
        annotations:
          summary: "Instance {{ $labels.instance }} Load15 usage high"
- 执行
curl -XPOST localhost:9090/-/reload刷新prometheus配置 - 执行
systemctl restart alertmanger.service或docker restart alertmanager刷新alertmanger服务
验证配置
-
打开prometheus服务,可以看到alerts栏出现了很多规则
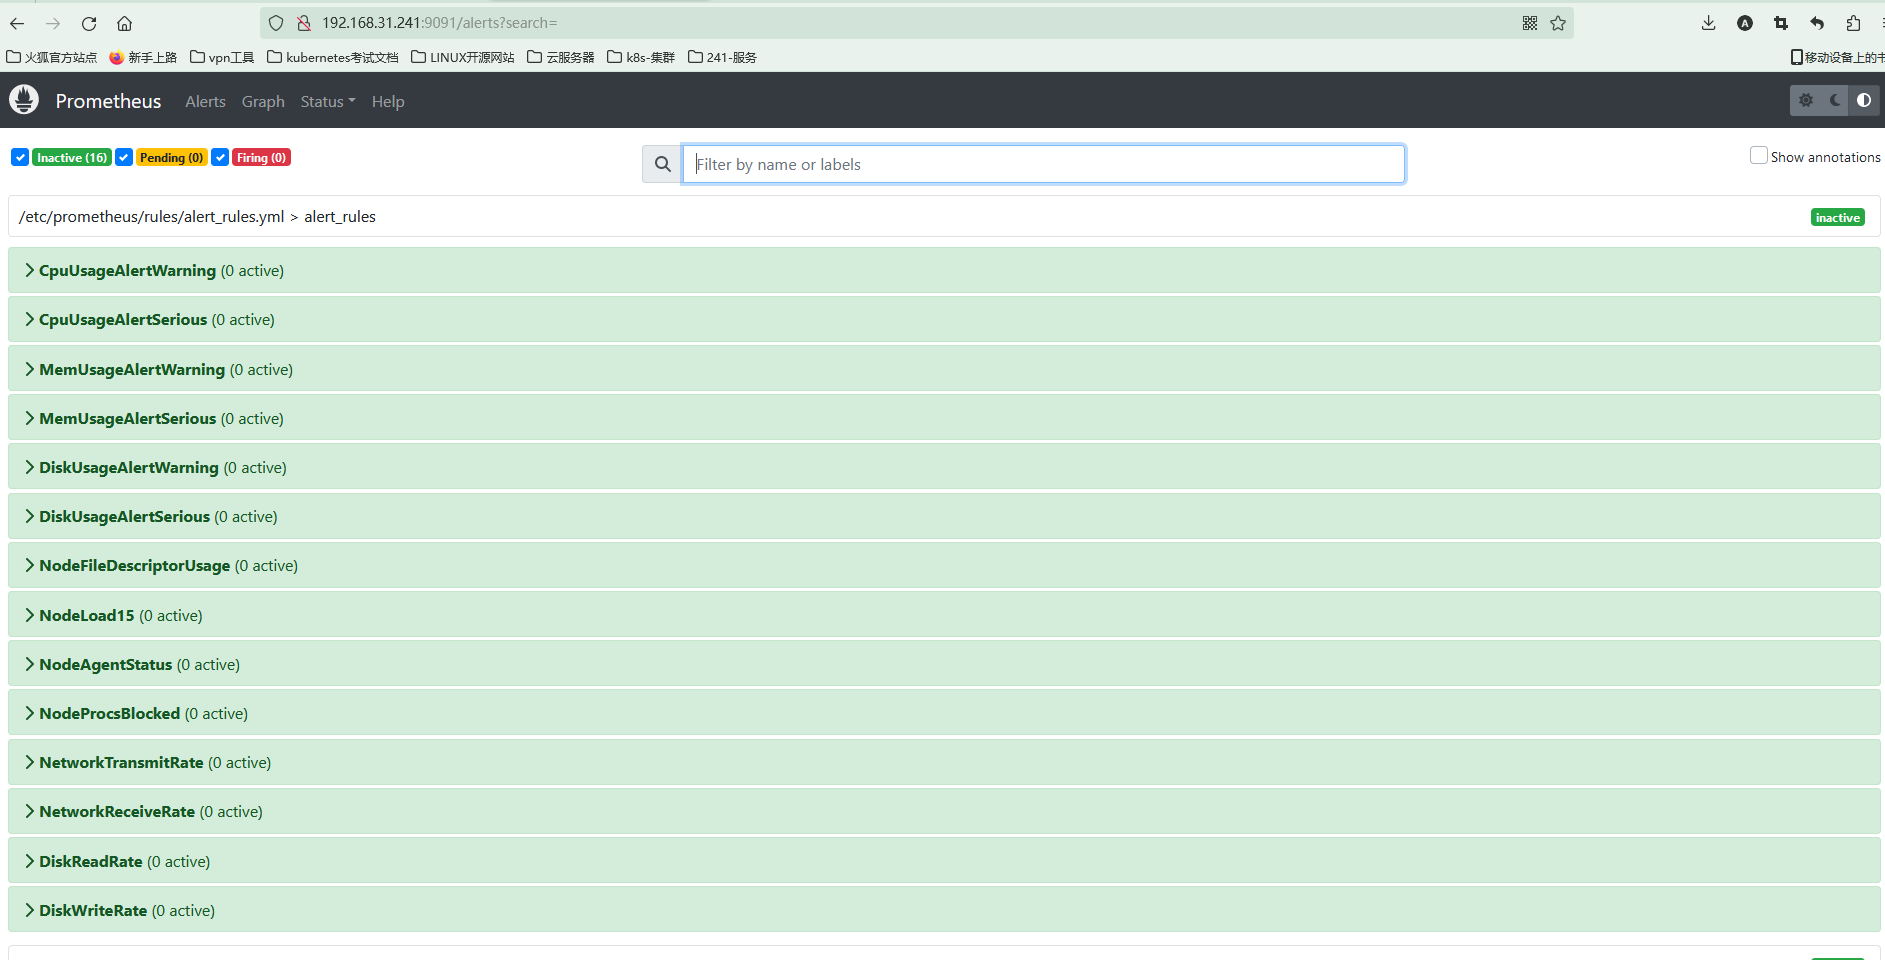
-
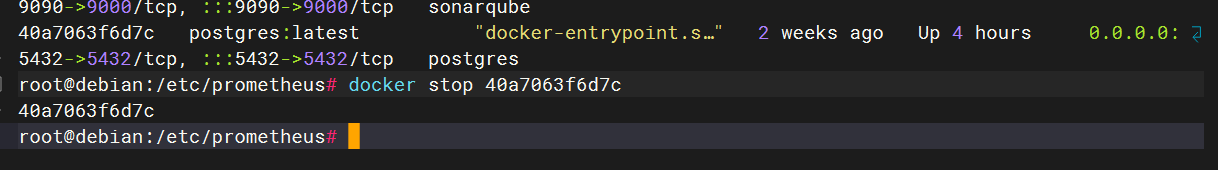
此时我们手动关闭一个节点
docker stop mysqld -
刷新prometheus,可以看到有一个节点颜色改变,进入了pending状态
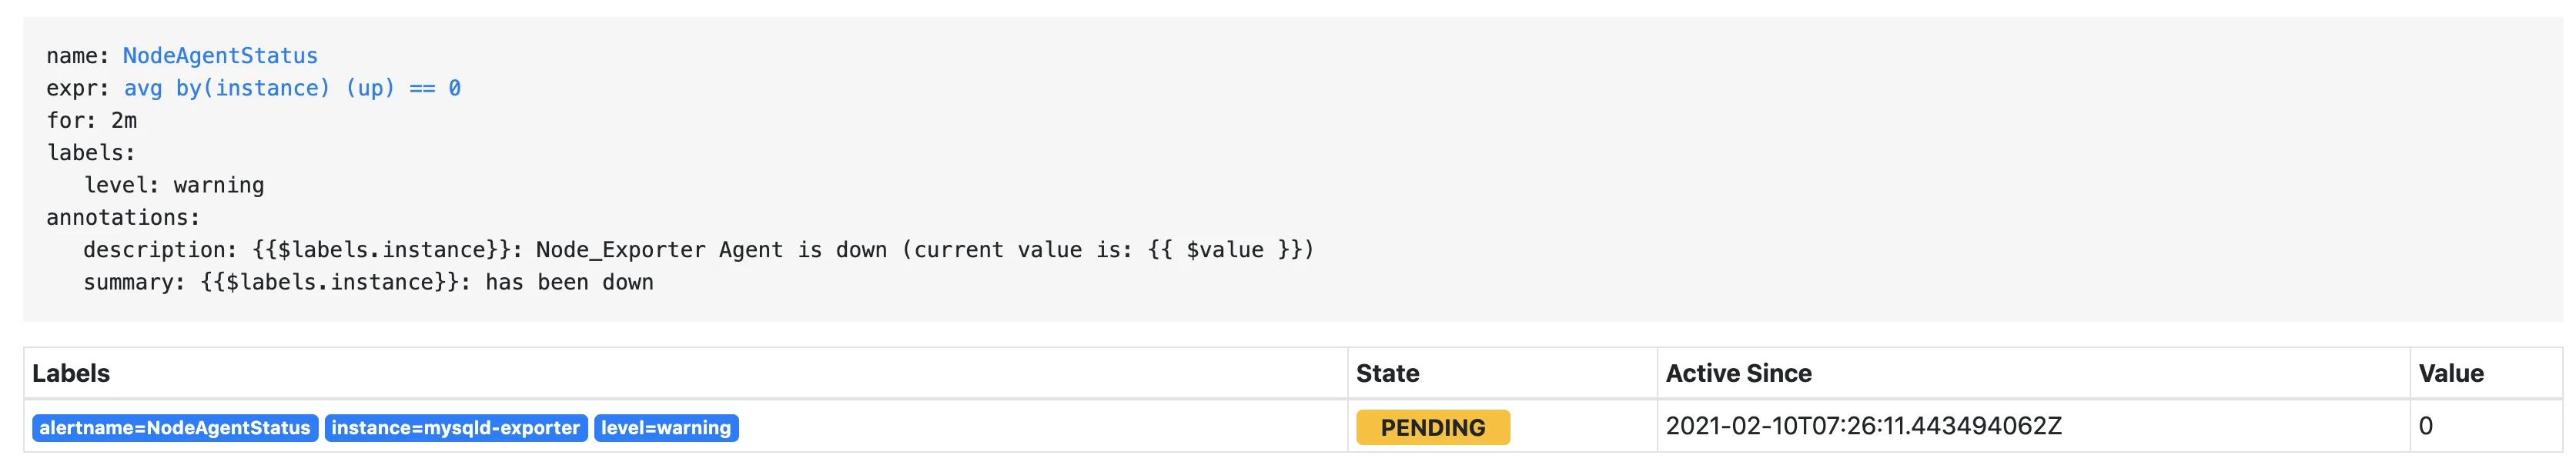
-
稍等片刻,alertmanager.yml 配置为等待5m,颜色变为红色,进入了firing状态

-
查看alertmanager服务,也出现了相关告警节点
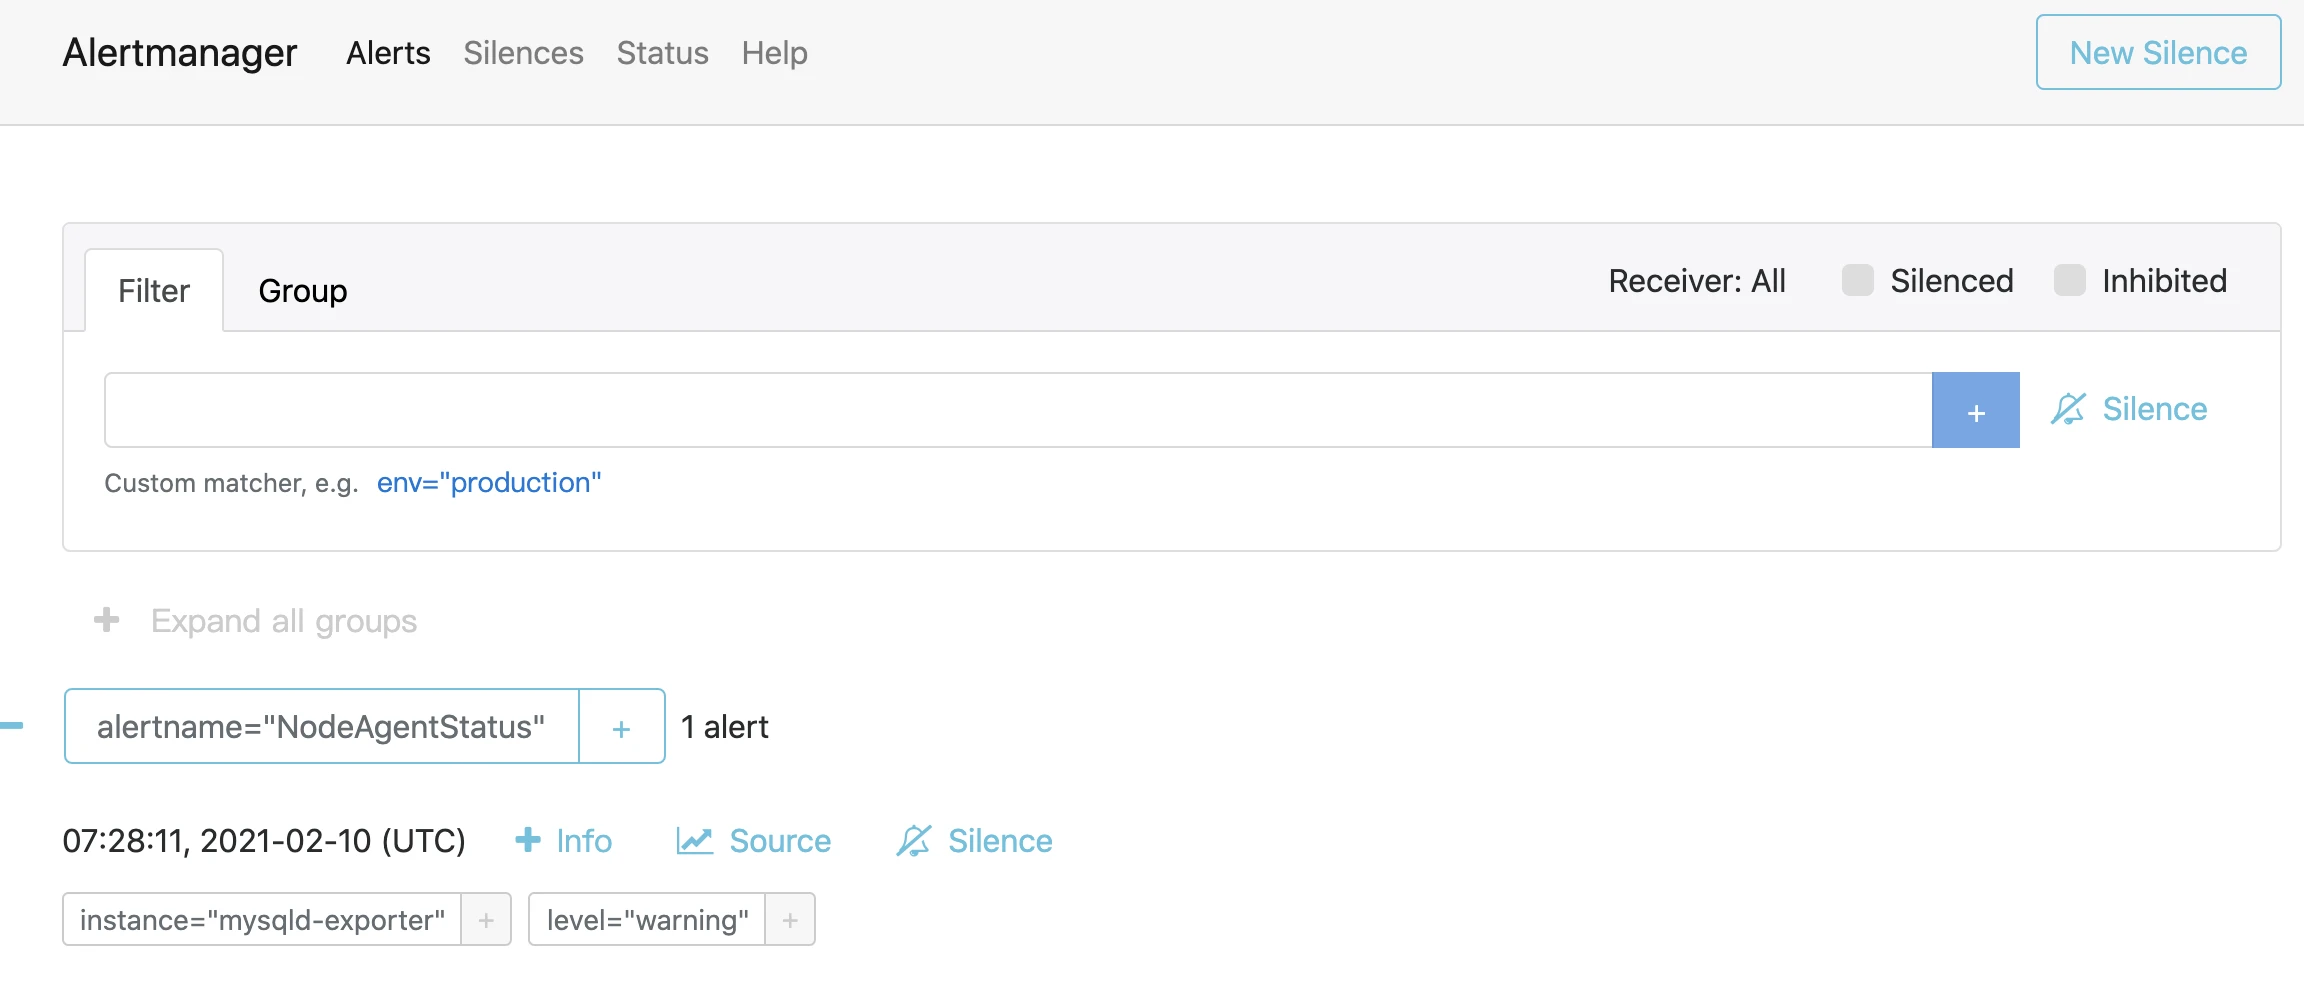
-
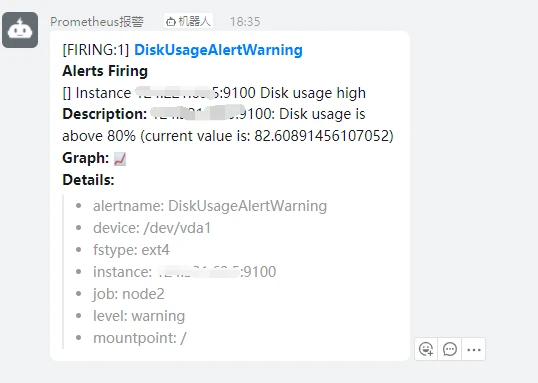
此时如果配置无误,会收到钉钉机器人的一条信息
-
这时我们重启mysqld-exporter服务
docker start mysqld -
过了配置的等待时长,若服务没有在期间断开,钉钉机器人会发送一条恢复状态的信息
优化报警模板
钉钉报警插件默认使用的是最简单的模板
[root@prometheus-server prometheus-webhook-dingtalk-2.0.0.linux-amd64]# vim config.yml
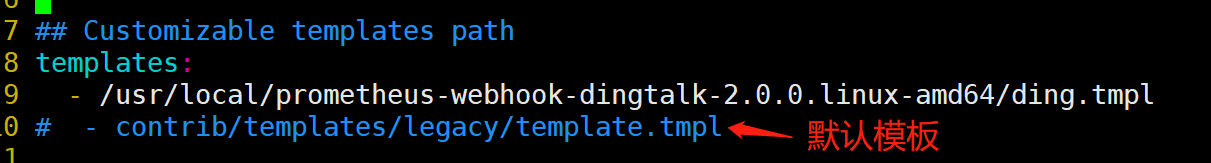

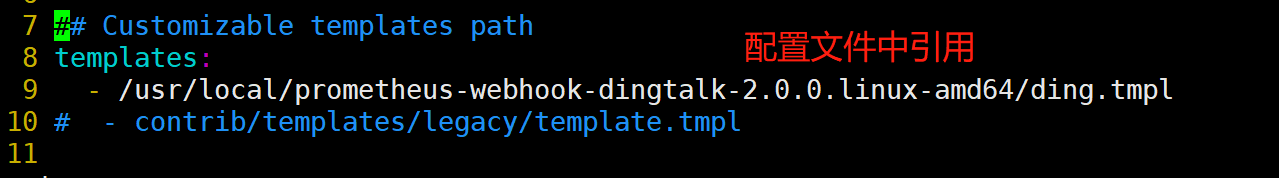
自定义模板
[root@prometheus-server prometheus-webhook-dingtalk-2.0.0.linux-amd64]# cat ding.tmpl
{{ define "ding.link.content" }}
{{ if gt (len .Alerts.Firing) 0 -}}
告警列表:
-----------
{{ template "__text_alert_list" .Alerts.Firing }}
{{- end }}
{{ if gt (len .Alerts.Resolved) 0 -}}
恢复列表:
{{ template "__text_resolve_list" .Alerts.Resolved }}
{{- end }}
{{- end }}
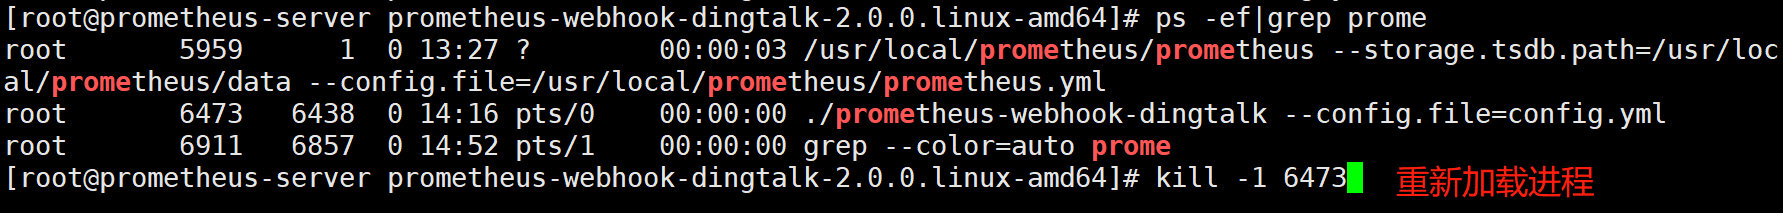
[root@prometheus-server prometheus-webhook-dingtalk-2.0.0.linux-amd64]# vim config.yml

[root@node1 ~]# systemctl stop node_exporter
告警标签、路由、分组
标签:给每个监控项添加标签,记住“标签”,有大用!!!
[root@prometheus prometheus]# pwd
/usr/local/prometheus
[root@prometheus prometheus]# cat rules/host_monitor.yml
在定义报警规则的时候,每个监控,定义好一个可识别的标签,可以作为报警级别,比如
severity: error
severity: warning
severity: info
不同的报警级别,发送到不同的接收者;
这里就以severity: warning为例,在应用场景中,也就是,不同的报警级别,发送到不同的接收者;
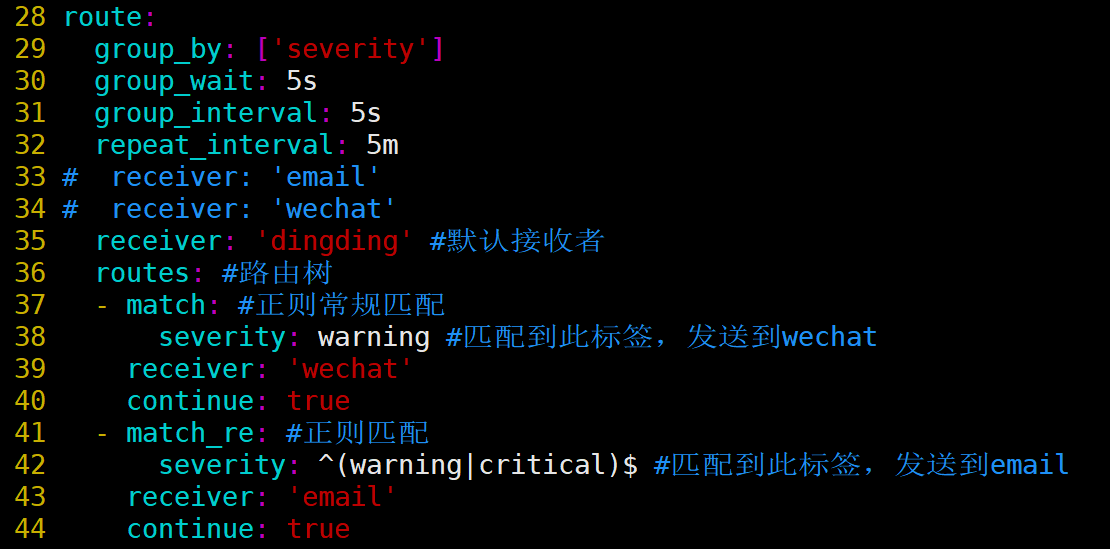
[root@prometheus alertmanager]# vim alertmanager.yml
[root@prometheus alertmanager]# systemctl restart alertmanager
说明:group by指定以什么标签进行分组,我这里指定的是severity;
默认接收者是dingding,如果报警信息中没有severity类的标签,匹配不到,会默认发送给dingdind接收者;
常规匹配到severity: warning,发送到wechat接收者;
正则匹配到severity: warning或者severity: critical,发送到email接收者;
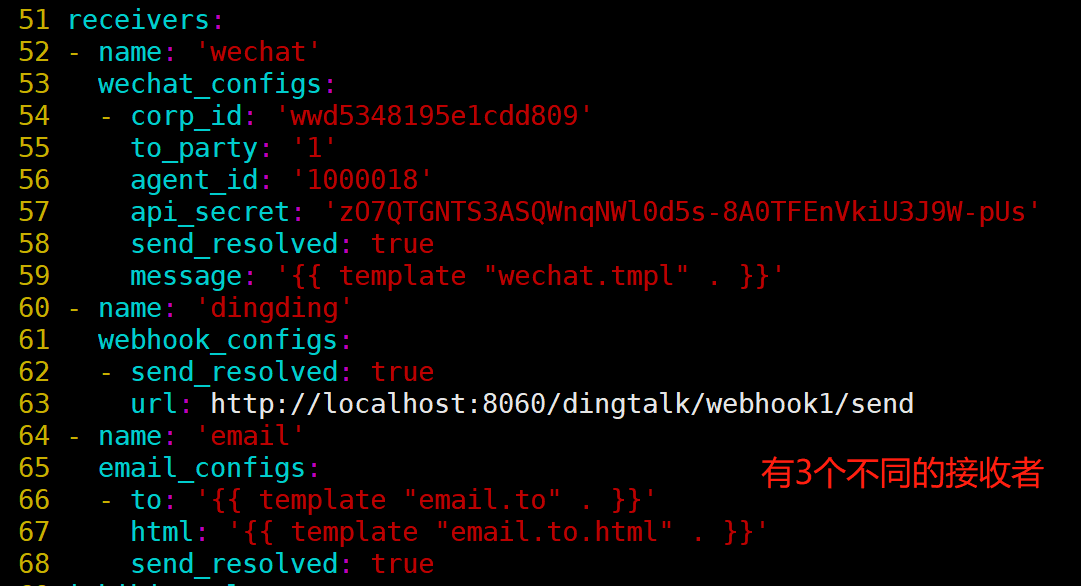
接收者要定义好,按照如上配置,email,wechat接收者,会接收到报警消息;
测试报警
[root@node1 ~]# systemctl stop node_exporter
[root@node1 ~]# systemctl start node_exporter
3. 优化配置规则
这里列举两个常用的规则文件,其余根据实际情况自行修改(可以去prometheus的web页面上自己先查一遍,看表达式是否正确查出数据)
对应这里
主机存活告警文件,分组名为servers_survival:
groups:
- name: servers_survival
  rules:
  - alert: 节点存活--工具--应用服务器
    expr:  up{job="node1"} == 0
    for: 1m
    labels:
      level: critical
    annotations:
      summary: "机器 {{ $labels.instance }} 挂了"
      description: "服务器{{$labels.instance}} 挂了 (当前值: {{ $value }})"

  - alert: 节点存活--开发--开发环境服务器
    expr:  up{job="node2"} == 0
    for: 1m
    labels:
      level: critical
    annotations:
      summary: "机器 {{ $labels.instance }} 挂了"
      description: "{{$labels.instance}} 宕机(当前值: {{ $value }})"

  - alert: 节点存活--测试--测试环境服务器
    expr:  up{job="node3"} == 0
    for: 1m
    labels:
      level: critical
    annotations:
      summary: "机器 {{ $labels.instance }} 挂了"
      description: "{{$labels.instance}} 宕机(当前值: {{ $value }})"

  - alert: 节点存活--jenkins--jenkins服务器
    expr:  up{job="node4"} == 0
    for: 1m
    labels:
      level: critical
    annotations:
      summary: "机器 {{ $labels.instance }} 挂了"
      description: "{{$labels.instance}} 宕机(当前值: {{ $value }})"
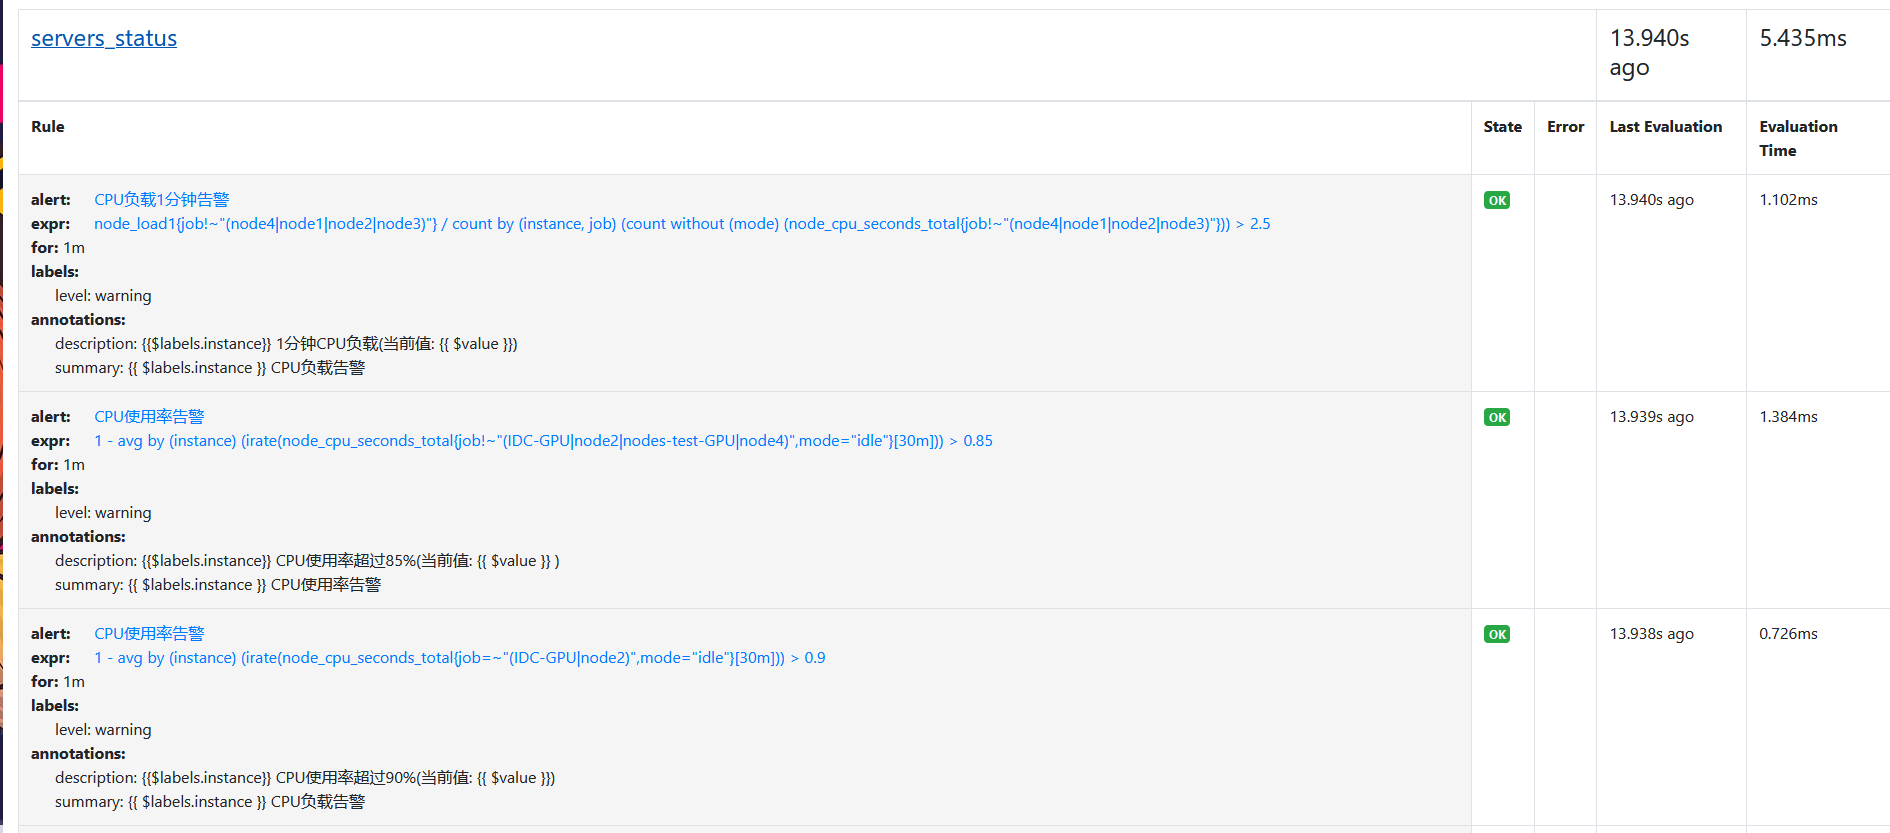
b. 主机状态告警文件,分组名为servers_status:
groups:
- name: servers_status
  rules:
  - alert: CPU负载1分钟告警
    expr:  node_load1{job!~"(node4|node1|node2|node3)"} / count (count (node_cpu_seconds_total{job!~"(node4|node1|node2|node3)"}) without (mode)) by (instance, job) > 2.5
    for: 1m
    labels:
      level: warning
    annotations:
      summary: "{{ $labels.instance }} CPU负载告警 "
      description: "{{$labels.instance}} 1分钟CPU负载(当前值: {{ $value }})"

  - alert: CPU使用率告警
    expr:  1 - avg(irate(node_cpu_seconds_total{mode="idle",job!~"(IDC-GPU|node2|nodes-test-GPU|node4)"}[30m])) by (instance) > 0.85
    for: 1m
    labels:
      level: warning
    annotations:
      summary: "{{ $labels.instance }} CPU使用率告警 "
      description: "{{$labels.instance}} CPU使用率超过85%(当前值: {{ $value }} )"

  - alert: CPU使用率告警
    expr: 1 - avg(irate(node_cpu_seconds_total{mode="idle",job=~"(IDC-GPU|node2)"}[30m])) by (instance) > 0.9
    for: 1m
    labels:
      level: warning
    annotations:
      summary: "{{ $labels.instance }} CPU负载告警 "
      description: "{{$labels.instance}} CPU使用率超过90%(当前值: {{ $value }})"

  - alert:  内存使用率告警
    expr:  (1-node_memory_MemAvailable_bytes{job!="IDC-GPU"} /  node_memory_MemTotal_bytes{job!="IDC-GPU"}) * 100 > 90
    labels:
      level: critical
    annotations:
      summary: "{{ $labels.instance }} 可用内存不足告警"
      description: "{{$labels.instance}} 内存使用率已达90% (当前值: {{ $value }})"


  - alert:  磁盘使用率告警
    expr: 100 - (node_filesystem_avail_bytes{fstype=~"ext4|xfs", mountpoint !~ "/var/lib/[kubelet|rancher].*" } / node_filesystem_size_bytes{fstype=~"ext4|xfs", mountpoint !~ "/var/lib/[kubelet|rancher].*"}) * 100 > 85
    labels:
      level: warning
    annotations:
      summary: "{{ $labels.instance }} 磁盘使用率告警"
      description: "{{$labels.instance}} 磁盘使用率已超过85% (当前值: {{ $value }})"
去web上查看确认rules是否被prometheus加载
三. 配置Alertmanger
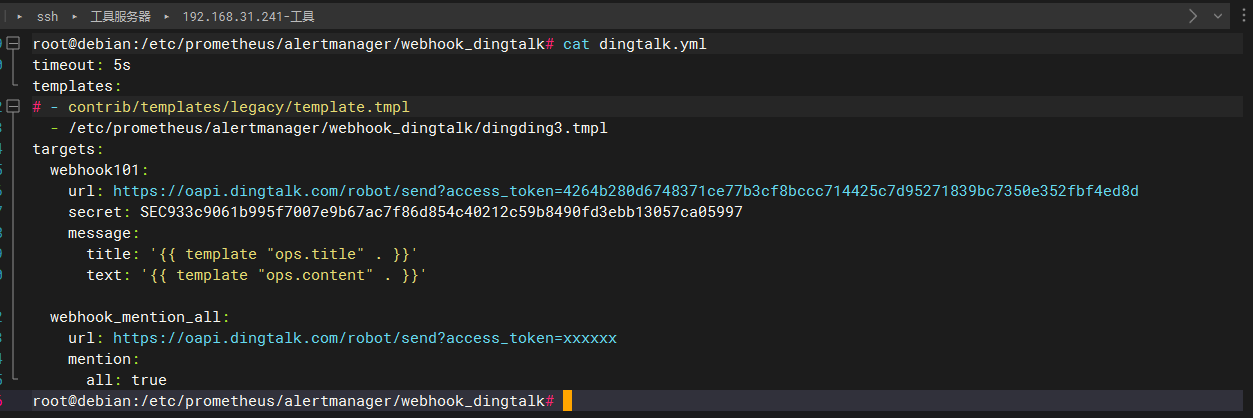
prometheuswebook_620">修改prometheus-webook配置文件绑定申请的机器人
我只绑定了一个webhook所以只要配置到webhook1
root@rancher2x.hw:/opt/prometheus-webhook# cat config.yml
## Customizable templates path
templates:
## - templates/alertmanager-dingtalk.tmpl
- /opt/alertmanager/dingding3.tmpl # 配置告警模板的所在位置
#default_message:
# title: '{{ template "legacy.title" . }}'
# text: '{{ template "legacy.content" . }}'
## Targets, previously was known as "profiles"
targets:
webhook1:
url: https://oapi.dingtalk.com/robot/send?access_token=xxxxxxxxxx # 配置机器人的webhook_url
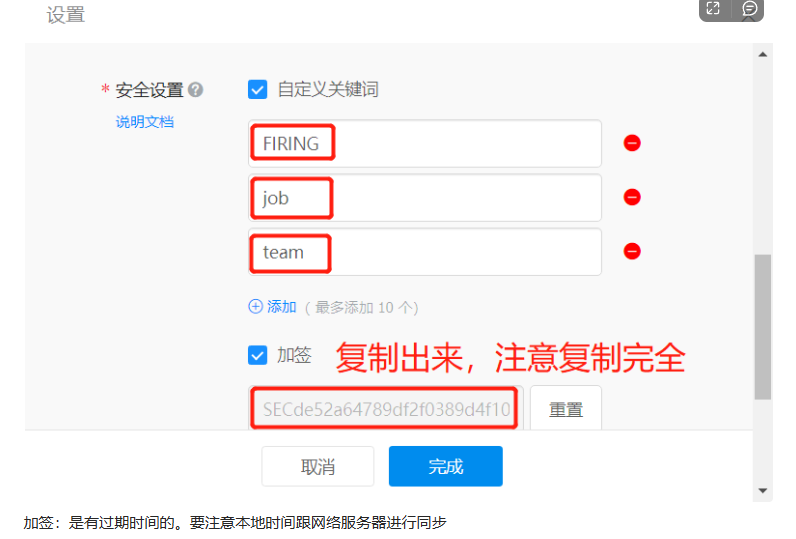
# secret for signature
secret: SEC65342be21ab54b730da9347be9307b7831bd65adf1c99406fedc786f62fecb98 # 配置加签(申请的时候那串数字)
message:
title: '{{ template "ops.title" . }}' # 给这个webhook应用上 模板标题 (ops.title是我们模板文件中的title 可在下面给出的模板文件中看到)
text: '{{ template "ops.content" . }}' # 给这个webhook应用上 模板内容 (ops.content是我们模板文件中的content 可在下面给出的模板文件中看到)
3. 告警模板文件
root@rancher2x.hw:/opt/# cat /opt/alertmanager/dingding3.tmpl

{{ define "__subject" }}
[{{ .Status | toUpper }}{{ if eq .Status "firing" }}:{{ .Alerts.Firing | len }}{{ end }}]
{{ end }}


{{ define "__alert_list" }}{{ range . }}
---
    **告警类型**: {{ .Labels.alertname }}
    **告警级别**: {{ .Labels.level }}
    **故障主机**: {{ .Labels.instance }}
    **告警信息**: {{ .Annotations.description }}
    **触发时间**: {{ (.StartsAt.Add 28800e9).Format "2006-01-02 15:04:05" }}
{{ end }}{{ end }}

{{ define "__resolved_list" }}{{ range . }}
---
    **告警类型**: {{ .Labels.alertname }}
    **告警级别**: {{ .Labels.level }}
    **故障主机**: {{ .Labels.instance }}
    **触发时间**: {{ (.StartsAt.Add 28800e9).Format "2006-01-02 15:04:05" }}
    **恢复时间**: {{ (.EndsAt.Add 28800e9).Format "2006-01-02 15:04:05" }}
{{ end }}{{ end }}


{{ define "ops.title" }}
{{ template "__subject" . }}
{{ end }}

{{ define "ops.content" }}
{{ if gt (len .Alerts.Firing) 0 }}
**====侦测到{{ .Alerts.Firing | len  }}个故障====**
{{ template "__alert_list" .Alerts.Firing }}
---
{{ end }}

{{ if gt (len .Alerts.Resolved) 0 }}
**====恢复{{ .Alerts.Resolved | len  }}个故障====**
{{ template "__resolved_list" .Alerts.Resolved }}
{{ end }}
{{ end }}

{{ define "ops.link.title" }}{{ template "ops.title" . }}{{ end }}
{{ define "ops.link.content" }}{{ template "ops.content" . }}{{ end }}
{{ template "ops.title" . }}
{{ template "ops.content" . }}
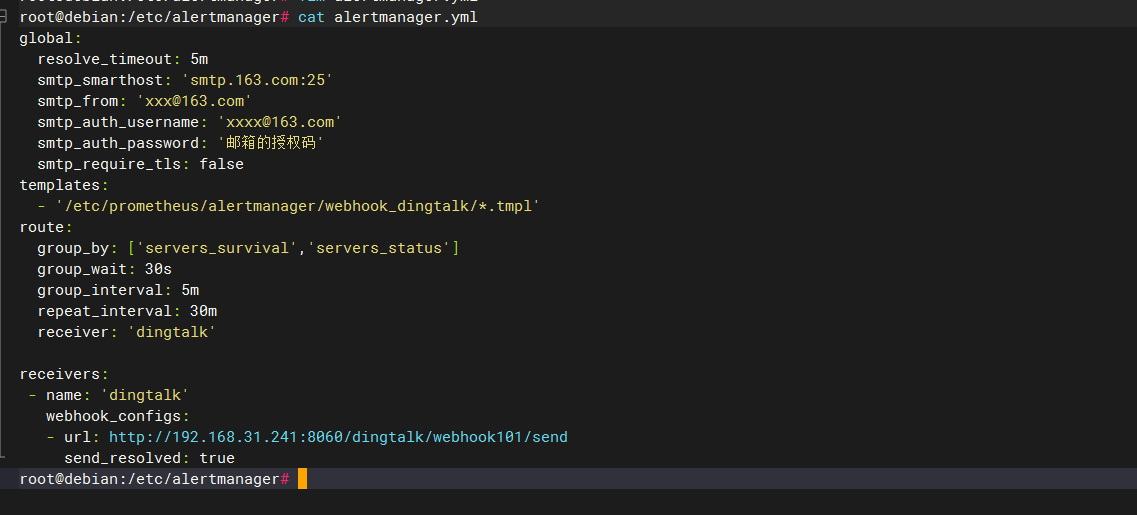
4. 修改alertmanager配置文件为如下内容
注:这里也加上了邮件相关的配置
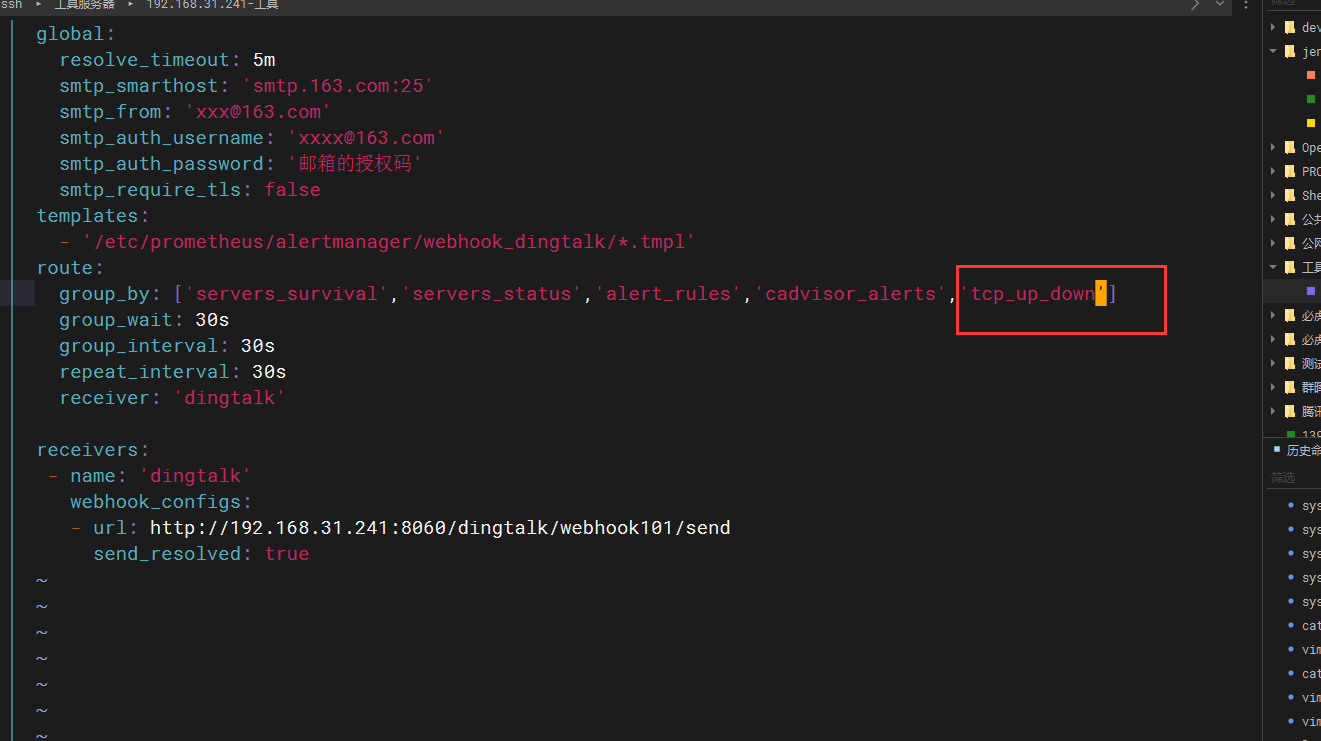
root@rancher2x.hw:/opt/alertmanager# cat alertmanager.yml
global:
  resolve_timeout: 5m
  smtp_smarthost: 'smtp.163.com:25'
  smtp_from: 'xxx@163.com'
  smtp_auth_username: 'xxxx@163.com'
  smtp_auth_password: '邮箱的授权码'
  smtp_require_tls: false
templates:
  - '/opt/alertmanager/*.tmpl'  #告警模板位置
route:
  group_by: ['servers_survival','servers_status'] # 根据告警规则组名进行分组
  group_wait: 30s # 分组内第一个告警等待时间,10s内如有第二个告警会合并一个告警
  group_interval: 5m  # 发送新告警间隔时间
  repeat_interval: 30m #重复告警间隔发送时间,如果没处理过多久再次发送一次
  receiver: 'dingtalk_webhook' # 接收人

receivers:
 - name: 'ops'
   email_configs:
   - to: 'tianye@163.com'
     html: '{{ template "email.to.html" .}}'
     headers: { Subject: "[WARNING]Prometheus告警邮件" }
     send_resolved: true
 - name: 'dingtalk_webhook'
   webhook_configs:
   - url: 'http://localhost:8060/dingtalk/webhook1/send' # 填写prometheus-webhook的webhook1 url
     send_resolved: true     # 在恢复后是否发送恢复消息给接收人
测试报警
停止一个node服务
钉钉群报警
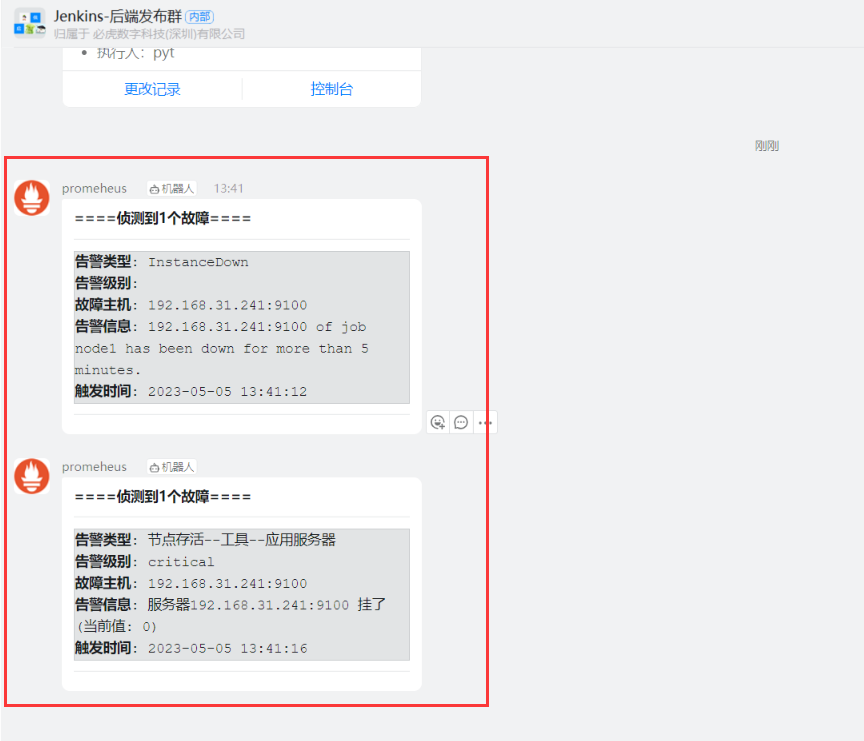
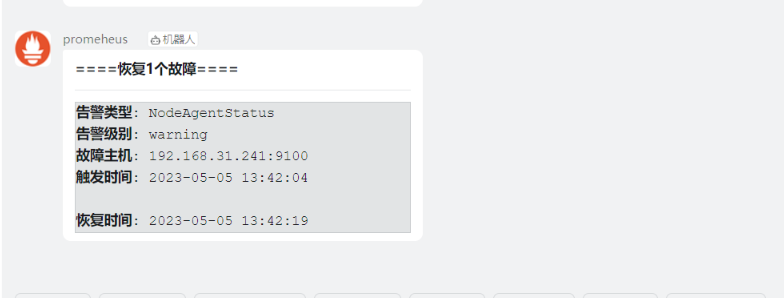
恢复过来
测试内存报警
写一个服务
#!/bin/bash

MEMORY_TO_USE=$(echo "$(awk '/^MemTotal/ {print $2}' /proc/meminfo) * 0.85" | bc -l | awk '{printf("%d\n",$1 + 0.5)}') # 计算需要使用的内存大小,单位为 KB
echo "将占用 ${MEMORY_TO_USE}KB 的内存"

docker run -it --rm -m ${MEMORY_TO_USE}KB --memory-swap ${MEMORY_TO_USE}KB busybox sh -c 'sleep 120'
下面是一个使用 Docker 容器临时占用内存 85% 并在 2 分钟后停止的示例:
这个脚本会执行以下操作:

使用 awk 命令获取系统的总内存大小(单位为 KB),并根据要占用的内存比例(85%)计算需要占用的内存大小。
使用 docker run 命令启动一个基于 Busybox 镜像的容器,并限制其最大可用内存和交换空间大小为所需占用的内存大小。
在容器中运行 sleep 120 命令,即让容器休眠 2 分钟后自动停止。
需要注意的是,由于这个脚本会占用大量的系统资源,建议仅在测试和调试环境中使用。同时,该脚本需要您已经安装了 Docker 环境并具有足够的权限来执行 Docker 命令
Alertmanager之抑制
当我们的分级告警时,比如:
- 平时监控 server-01机器的存活,也监控这台机器的nginx服务存活时,当主机宕机后,我们会同时收到 server-01挂掉和nginx服务挂掉 两条警报(甚至连带更多),显然对我们来讲,这都是没必要发出的邮件,真正造成这个告警的原因是-主机宕机这个警告,所以我们只需要关注这个就好,别的没必要发了。
- 平时监控 jenkins主机的内存使用率,85%定为warnning级别,90%定为critical级别 ,在内存飙升的过程中,可能刚触发完85%又触发了90%,所以我们也会收到两个告警。比如下图:
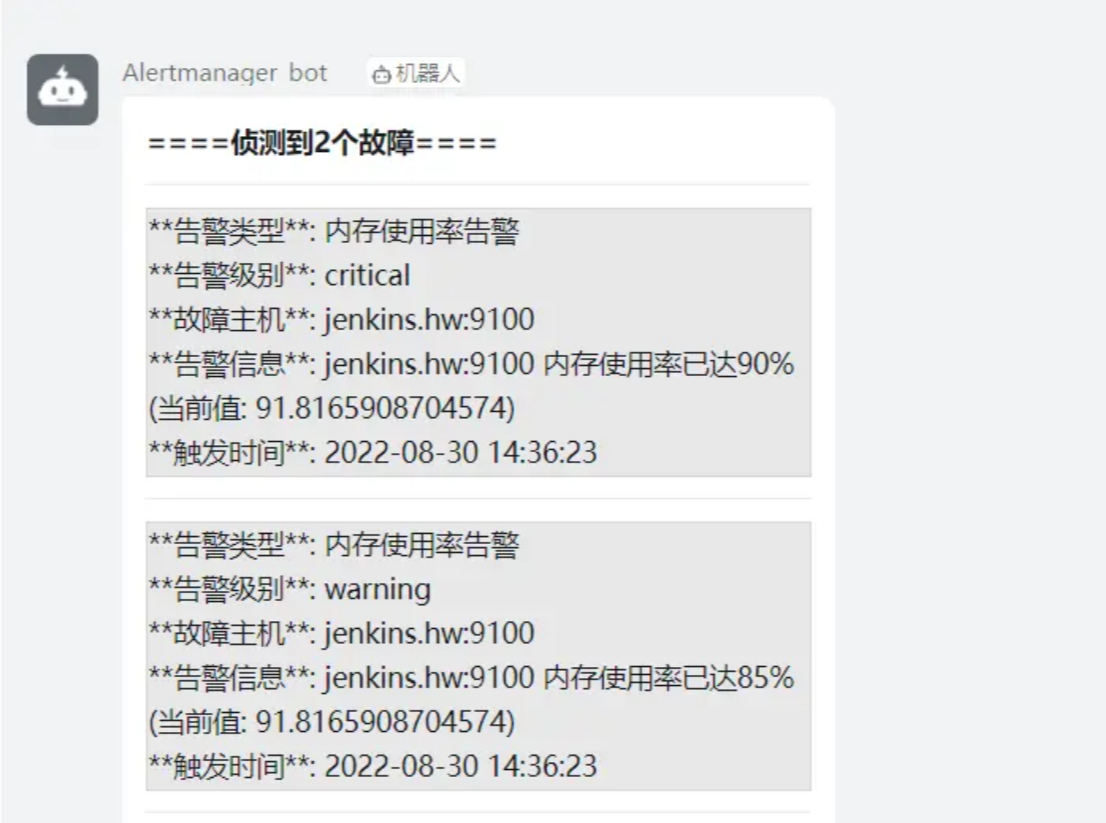
所以这个情况需要,一段时间内,同一个主机的critical级别要抑制住warning级别,减少冗余发送。
操作
我们用监控nginx和docker服务做一个实践
使用Prometheus监控docker容器

常用的监控指标有内存、CPU、磁盘、网络。一般使用Google开源的cAdvisor (Container Advisor)来收集正在运行的容器资源信息和性能信息(参见 https://github.com/google/cadvisor)。
使用cAdvisor采集监控数据(被监控端)
2.安装cAdvisor 来收集容器信息
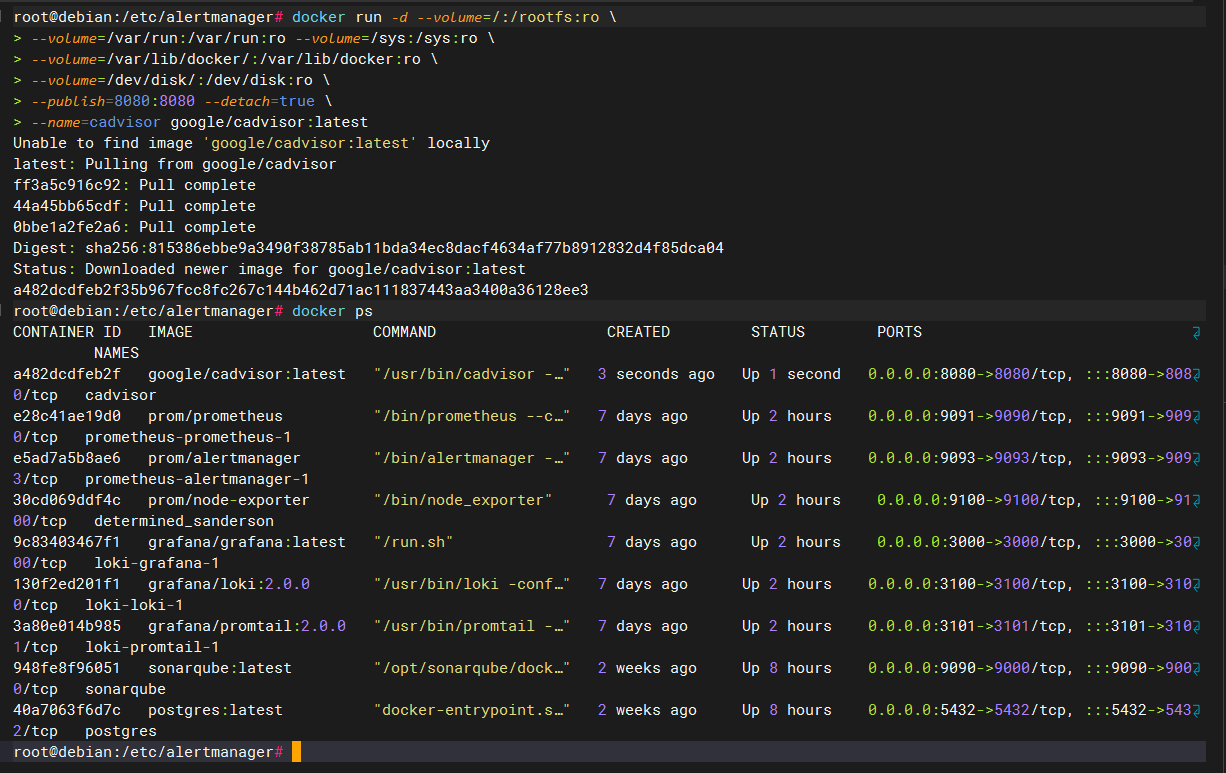
使用Docker部署cadvisor。
docker run -d --volume=/:/rootfs:ro \
--volume=/var/run:/var/run:ro --volume=/sys:/sys:ro \
--volume=/var/lib/docker/:/var/lib/docker:ro \
--volume=/dev/disk/:/dev/disk:ro \
--publish=8080:8080 --detach=true \
--name=cadvisor google/cadvisor:latest
# 访问http://主机IP:8080
cAdvisor不负责存储采集到的监控数据,因此只能查看实时数据。cAdvisor为Prometheus提供的数据采集接口为http://被监控主机IP:8080/metrics。
第二种方式
docker run \
--volume=/:/rootfs:ro \
--volume=/var/run:/var/run:ro \
--volume=/sys:/sys:ro \
--volume=/var/lib/docker/:/var/lib/docker:ro \
--volume=/dev/disk/:/dev/disk:ro \
--publish=8080:8080 \
--detach=true \
--name=cadvisor \
--restart=always \
google/cadvisor:latest
注意:
服务起不来如何解决?
mount -o remount,rw '/sys/fs/cgroup'
ln -s /sys/fs/cgroup/cpu,cpuacct /sys/fs/cgroup/cpuacct,cpu
验证收集效果传递
访问

prometheus_866">修改prometheus配置文件
在prometheus.yml的scrape_configs中添加监控作业。
- job_name: "my_docker"
  static_configs:
  - targets: ['被监控主机IP:8080']
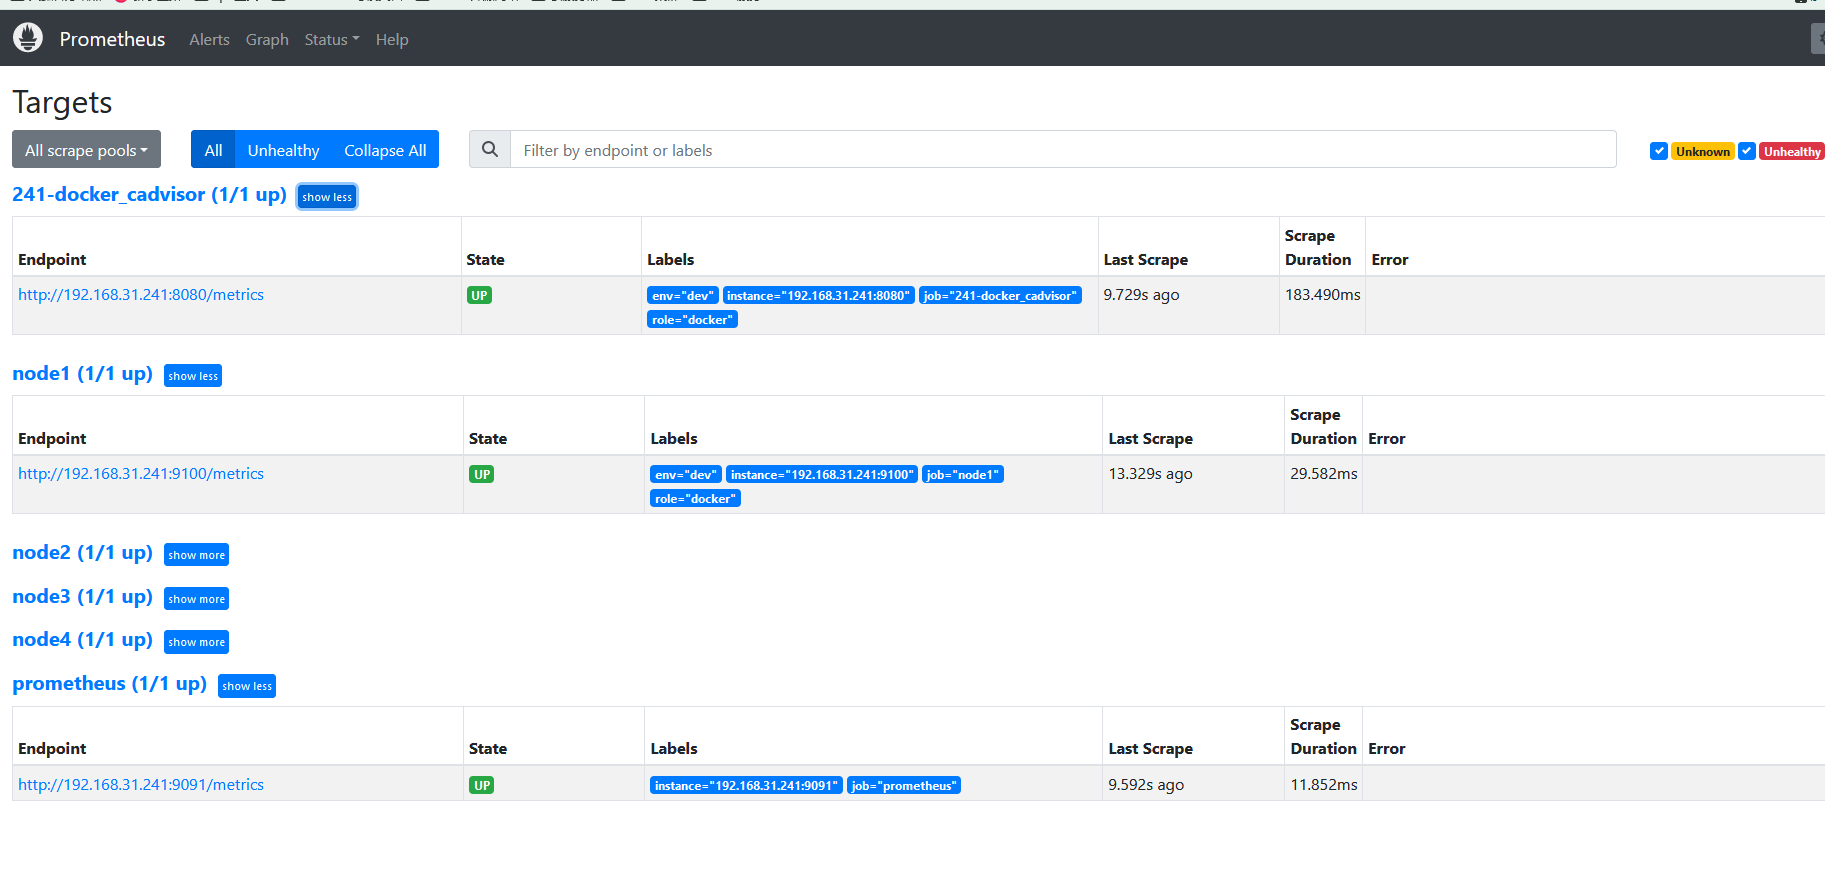
然后重启容器:docker restart prometheus。可以在http://主机IP:9090/targets 页面可以查看prometheus监控的目标。在http://主机IP:9090/graph 页面可以查看监控参数的简单图形化展示
访问测试
进入首页会看到
如果我们想看docker容器的信息
在官网查找与docker有关的模板导入并使用
找到一款全部适合的(ID:11600)
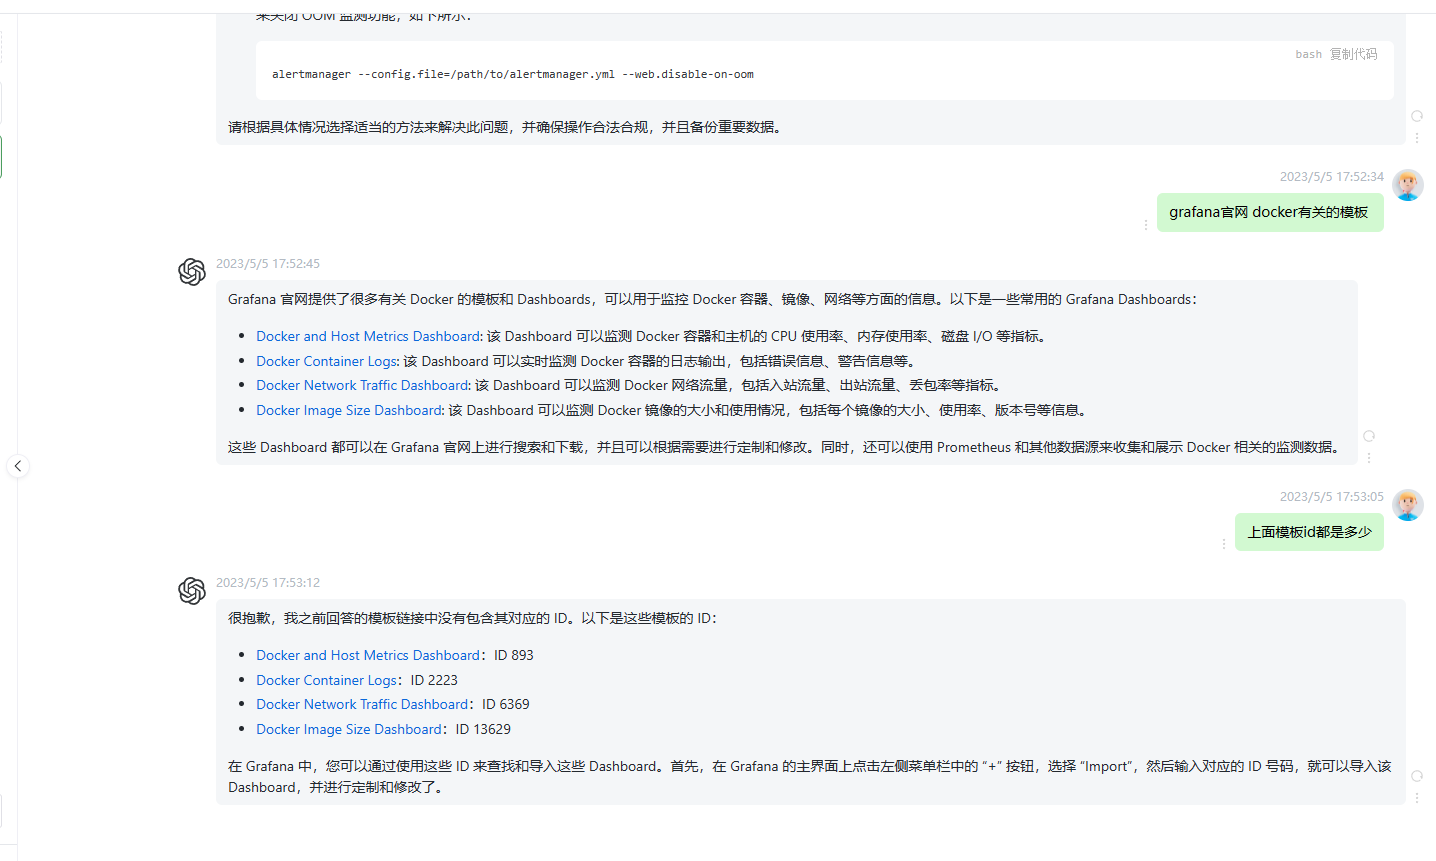

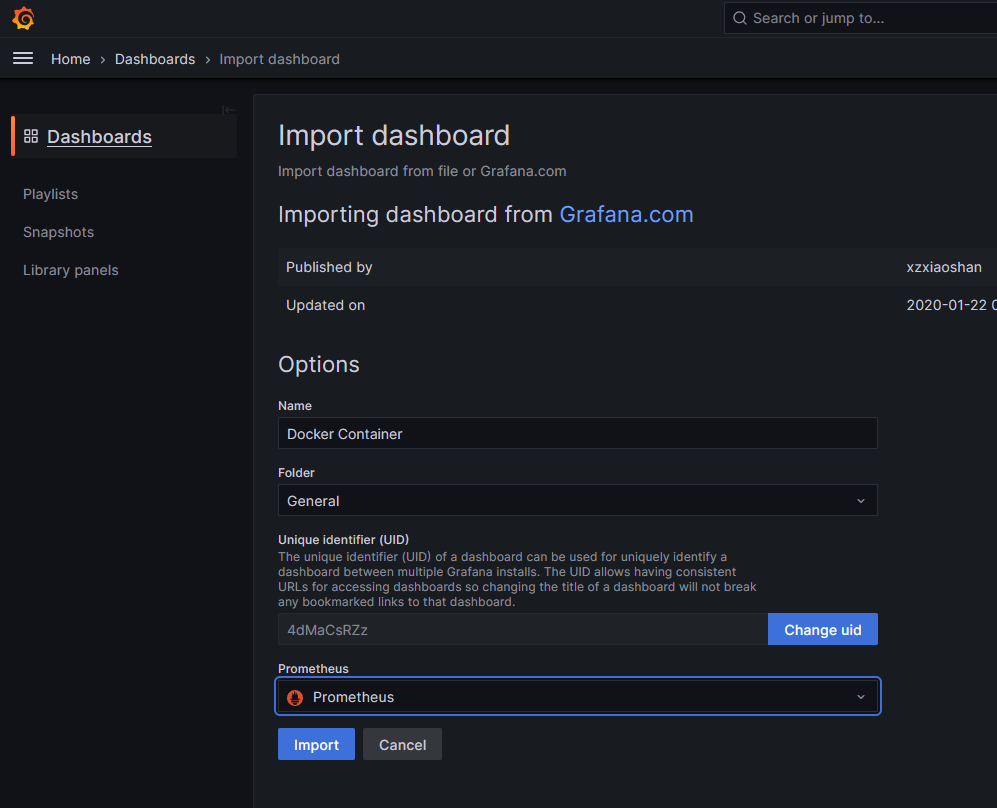
备注:cadvisor容器监控仪表盘ID推荐使用:10619
d. 主节点prometheus.yml将已安装的各应用节点配置后,并重启主节点prometheus
注意:prometheus.yml配置文件内容及注释都建议不要加中文,否则因编码格式不一致导致普罗米修斯重启失败
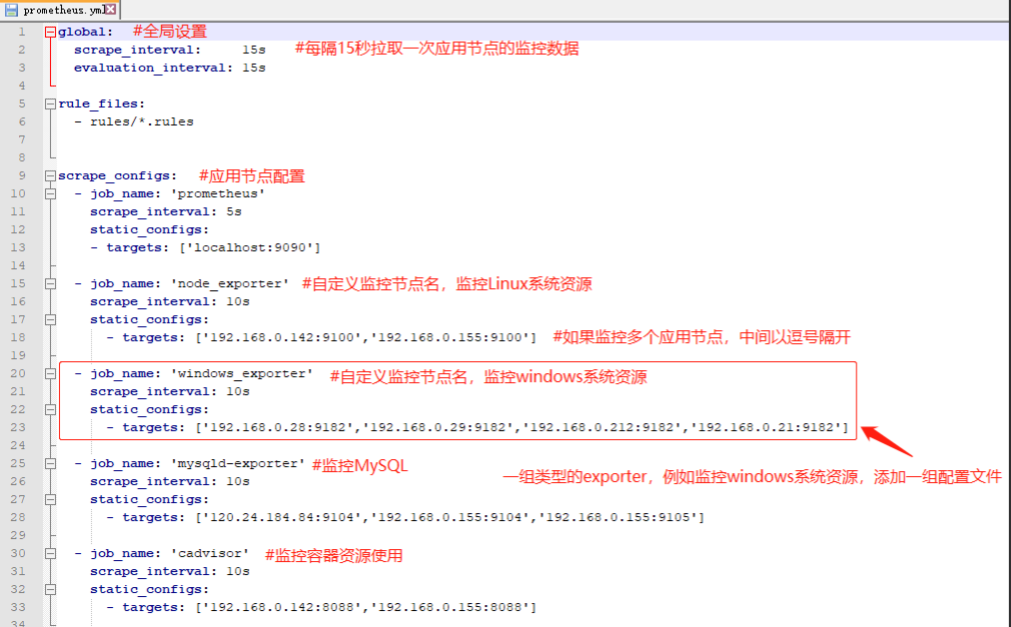
我的配置文件
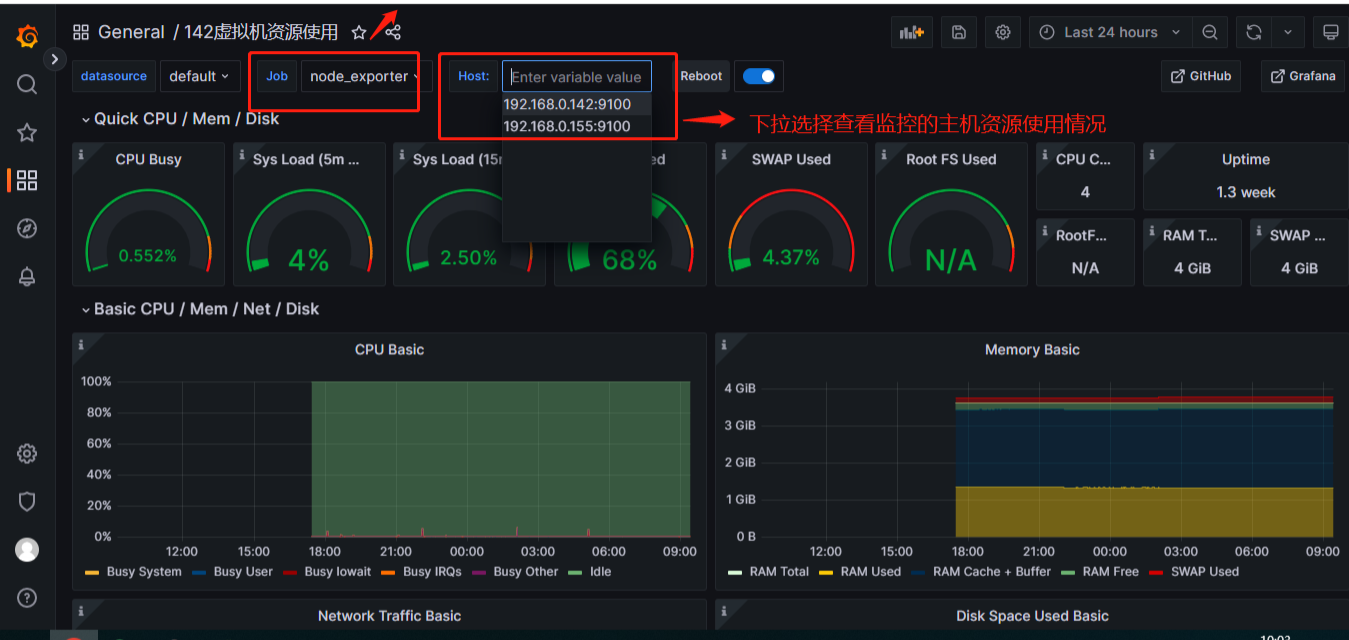
以下是这些应用节点安装并配置完成后,监控显示如下
1) 以下是监控Linux系统资源:
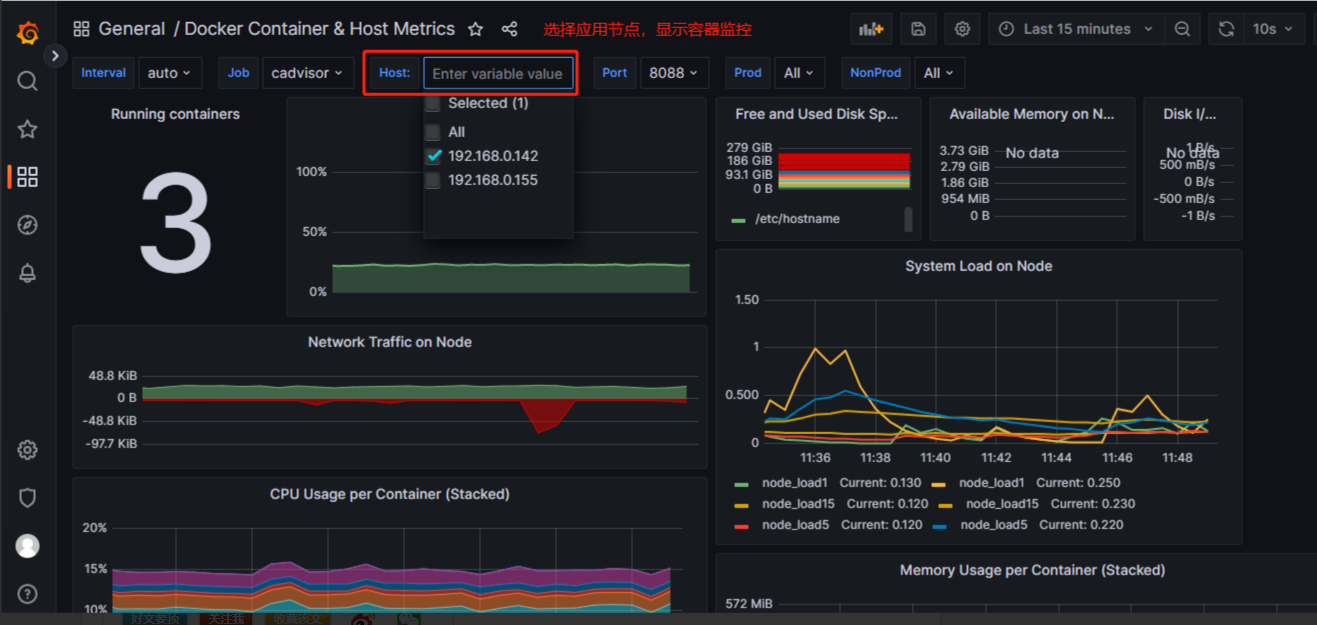
以下是容器资源监控
这个优化我用了不知道咋回事不适配,大家可以尝试使用一下
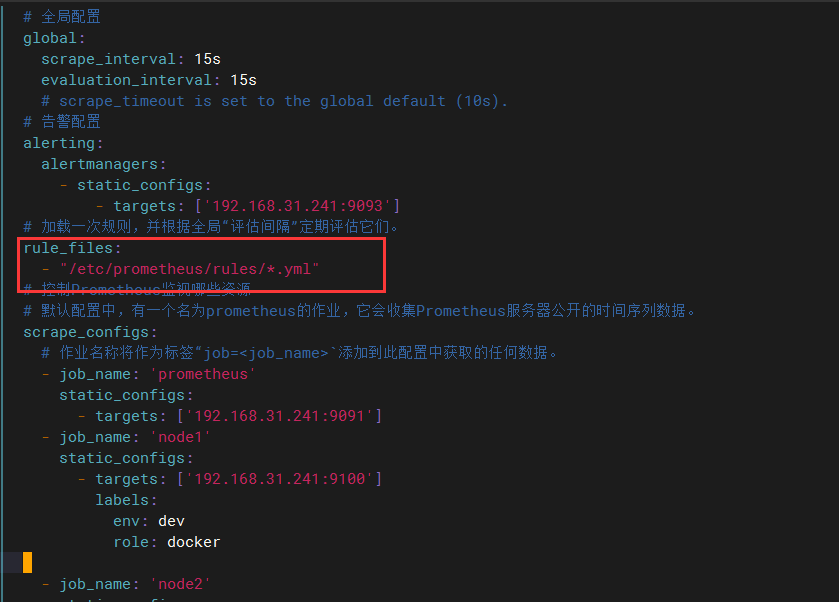
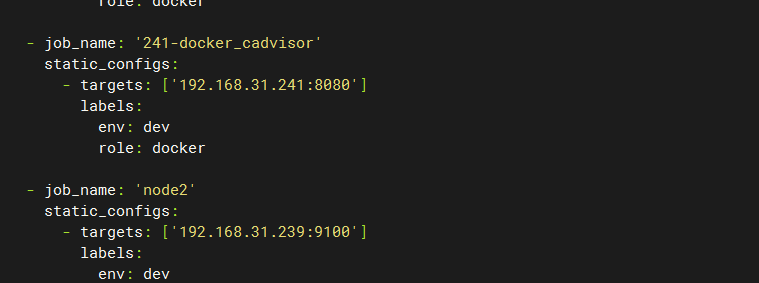
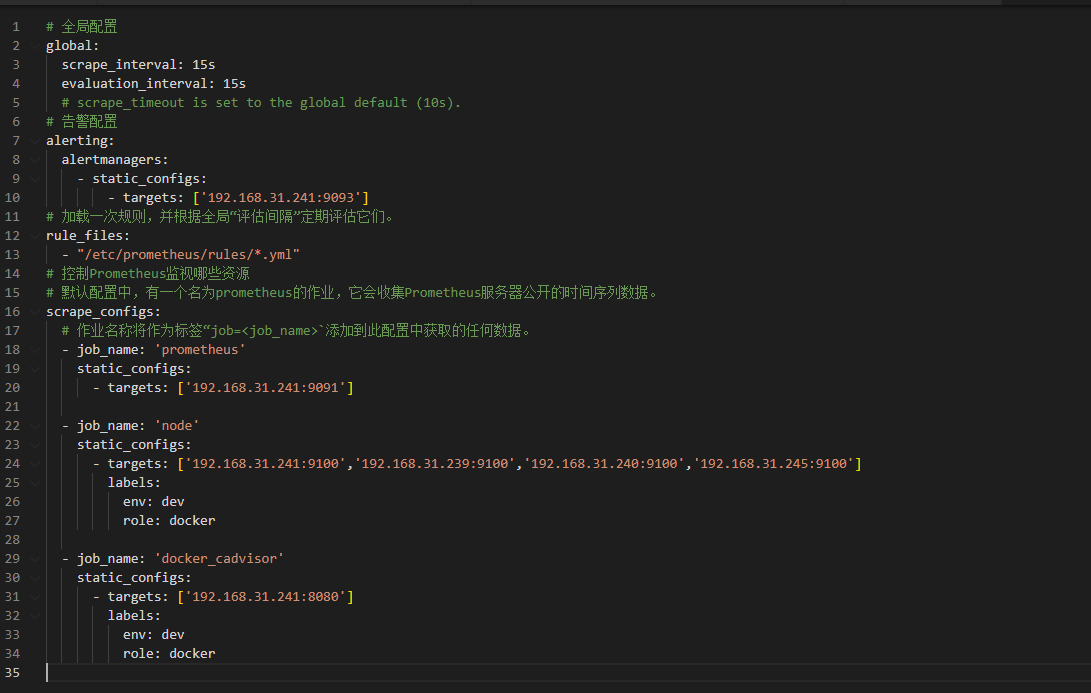
prometheus_job__922">配置prometheus收集容器对应的 job 和规则
# 全局配置
global:
scrape_interval: 15s
evaluation_interval: 15s
# scrape_timeout is set to the global default (10s).
# 告警配置
alerting:
alertmanagers:
- static_configs:
- targets: ['192.168.31.241:9093']
# 加载一次规则,并根据全局“评估间隔”定期评估它们。
rule_files:
- "/etc/prometheus/rules/*.yml"
# 控制Prometheus监视哪些资源
# 默认配置中,有一个名为prometheus的作业,它会收集Prometheus服务器公开的时间序列数据。
scrape_configs:
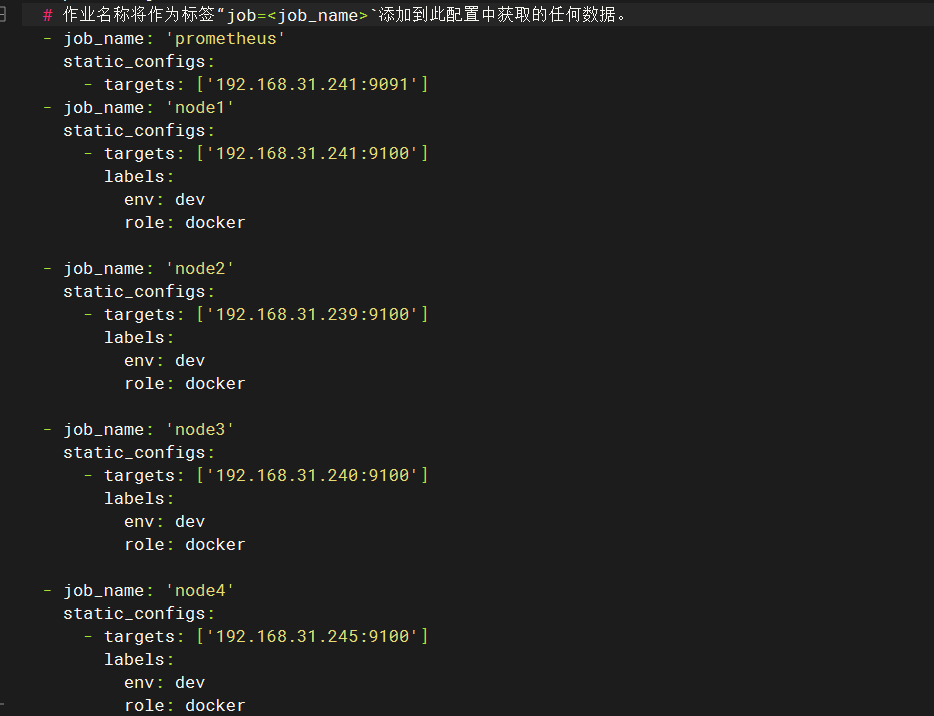
# 作业名称将作为标签“job=<job_name>`添加到此配置中获取的任何数据。
- job_name: 'prometheus'
static_configs:
- targets: ['192.168.31.241:9091']
- job_name: 'node'
static_configs:
- targets: ['192.168.31.241:9100','192.168.31.239:9100','192.168.31.240:9100','192.168.31.245:9100']
labels:
env: dev
role: docker
优化告警规则能适配- targets里面所有ip
root@debian:/etc/prometheus/rules# cat servers_survival.yml
- name: servers_survival
  rules:
  - alert: 节点存活--工具--应用服务器
    expr: up{job="node1", instance=~"192\\.168\\.31\\.241.*"} == 0
    for: 1m
    labels:
      level: critical
    annotations:
      summary: "机器 {{ $labels.instance }} 挂了"
      description: "服务器{{$labels.instance}} 挂了 (当前值: {{ $value }})"

  - alert: 节点存活--开发--开发环境服务器
    expr: up{job="node2", instance=~"192\\.168\\.31\\.239.*"} == 0
    for: 1m
    labels:
      level: critical
    annotations:
      summary: "机器 {{ $labels.instance }} 挂了"
      description: "{{$labels.instance}} 宕机(当前值: {{ $value }})"

  - alert: 节点存活--测试--测试环境服务器
    expr: up{job="node3", instance=~"192\\.168\\.31\\.240.*"} == 0
    for: 1m
    labels:
      level: critical
    annotations:
      summary: "机器 {{ $labels.instance }} 挂了"
      description: "{{$labels.instance}} 宕机(当前值: {{ $value }})"

  - alert: 节点存活--jenkins--jenkins服务器
    expr: up{job="node4", instance=~"192\\.168\\.31\\.245.*"} == 0
    for: 1m
    labels:
      level: critical
    annotations:
      summary: "机器 {{ $labels.instance }} 挂了"
      description: "{{$labels.instance}} 宕机(当前值: {{ $value }})"
优化告警规则能适配- targets里面所有ip
- name: servers_status
  rules:
  - alert: CPU负载1分钟告警
    expr: node_load1 / count(count(node_cpu_seconds_total{job=~"node", mode!="idle"}) without (mode)) by (instance, job) > 2.5 and instance !~ "{{ join \"|\" .Values.node_ips }}"
    for: 1m
    labels:
      level: warning
    annotations:
      summary: "{{ $labels.instance }} CPU负载告警 "
      description: "{{$labels.instance}} 1分钟CPU负载(当前值: {{ $value }})"

  - alert: CPU使用率告警
    expr: 1 - avg(irate(node_cpu_seconds_total{mode="idle", job=~"node"})[30m]) by (instance) > 0.85 and instance !~ "{{ join \"|\" .Values.node_ips }}"
    for: 1m
    labels:
      level: warning
    annotations:
      summary: "{{ $labels.instance }} CPU使用率告警 "
      description: "{{$labels.instance}} CPU使用率超过85%(当前值: {{ $value }} )"

  - alert: CPU使用率告警
    expr: 1 - avg(irate(node_cpu_seconds_total{mode="idle", job=~"node2|node4"})[30m]) by (instance) > 0.9 and instance !~ "{{ join \"|\" .Values.node_ips }}"
    for: 1m
    labels:
      level: warning
    annotations:
      summary: "{{ $labels.instance }} CPU负载告警 "
      description: "{{$labels.instance}} CPU使用率超过90%(当前值: {{ $value }})"

  - alert:  内存使用率告警
    expr: (1 - node_memory_MemAvailable_bytes / node_memory_MemTotal_bytes) * 100 > 90 and job=~"node" and instance !~ "{{ join \"|\" .Values.node_ips }}"
    labels:
      level: critical
    annotations:
      summary: "{{ $labels.instance }} 可用内存不足告警"
      description: "{{$labels.instance}} 内存使用率已达90% (当前值: {{ $value }})"


  - alert:  磁盘使用率告警
    expr: 100 - (node_filesystem_avail_bytes{fstype=~"ext4|xfs", mountpoint !~ "/var/lib/[kubelet|rancher].*", job=~"node"} / node_filesystem_size_bytes{fstype=~"ext4|xfs", mountpoint !~ "/var/lib/[kubelet|rancher].*", job=~"node"}) * 100 > 85 and instance !~ "{{ join \"|\" .Values.node_ips }}"
    labels:
      level: warning
    annotations:
      summary: "{{ $labels.instance }} 磁盘使用率告警"
      description: "{{$labels.instance}} 磁盘使用率已超过85% (当前值: {{ $value }})"
创建一个名为 cadvisor_rules.yml 的告警规则文件,定义需要监控的指标和阈值:
groups:
- name: cadvisor_alerts
rules:
- alert: 内存使用率超过90%时报警
expr: (sum(container_memory_usage_bytes{image!="",container_name!="POD"}) / sum(machine_memory_bytes)) * 100 > 90
for: 5m
labels:
severity: warning
annotations:
summary: "Container memory usage is high"
description: "{{$labels.instance}}: {{$value}}% of memory is in use"
- alert: 容器 CPU 使用率超过80%时报警
expr: (sum(rate(container_cpu_usage_seconds_total{image!="",container_name!="POD"}[5m])) / count(node_cpu_seconds_total{mode="system"}) * 100) > 80
for: 5m
labels:
severity: warning
annotations:
summary: "Container CPU usage is high"
description: "{{$labels.instance}}: {{$value}}% of CPU is in use"
- alert: 容器文件系统使用率超过90%时报警
expr: (sum(container_fs_usage_bytes{image!="",container_name!="POD"}) / sum(container_fs_limit_bytes{image!="",container_name!="POD"})) * 100 > 90
for: 5m
labels:
severity: warning
annotations:
summary: "Container filesystem usage is high"
description: "{{$labels.instance}}: {{$value}}% of file system is in use"
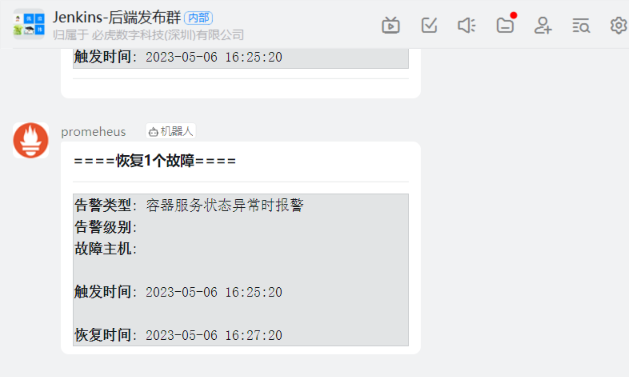
- alert: 容器服务状态异常时报警
expr: max(up{job="docker_cadvisor", instance=~".+:8080"}) by (name, image) < 1
for: 5m
labels:
severity: critical
annotations:
summary: "Container service is down"
description: "{{$labels.instance}}: {{$labels.name}}/{{$labels.image}} container service is not reachable"
查看报警

恢复
监控微服务探活
简介: BlackBox Exporter 顾名思义就是在应用程序的外部对其进行探测, 支持 HTTP、HTTPS、DNS、TCP、ICMP等方式对目标进行检测。

官方下载链接
https://github.com/prometheus/blackbox_exporter/releases/download/v0.21.1/blackbox_exporter-0.21.1.linux-amd64.tar.gz
各版本下载网址
https://github.com/prometheus/blackbox_exporter/releases
*解压*
tar -zxf blackbox_exporter-0.21.1.linux-amd64.tar.gz

mv blackbox_exporter-0.21.1.linux-amd64 /usr/local/blackbox_exporter
使用systemd管理blackbox_exporter服务
vim /usr/lib/systemd/system/blackbox_exporter.service

[Unit]

Description=blackbox_exporter

After=network.target

[Service]

User=root

Type=simple

ExecStart=/usr/local/blackbox_exporter/blackbox_exporter --config.file=/usr/local/blackbox_exporter/blackbox.yml

Restart=on-failure

[Install]

WantedBy=multi-user.target
systemctl daemon-reload

systemctl start blackbox_exporter

systemctl enable blackbox_exporter
查看启动
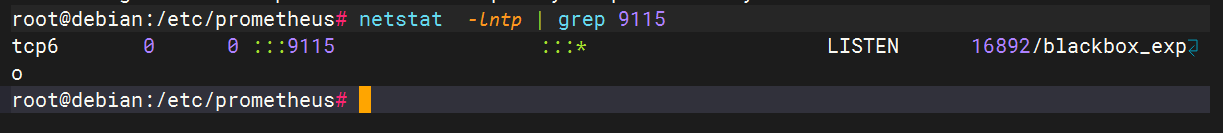
prometheus_1172">配置好blackbox_exporter 后来到prometheus配置
vim prometheus.yml
模板
#监控端口存活
  - job_name: 'port_status'
    metrics_path: /probe
    params:
      module: [tcp_connect]
    static_configs:
      - targets:
        - 192.168.11.141:9090
        - 192.168.11.143:3306    #可以写多个ip+端口

    relabel_configs:
      - source_labels: [__address__]
        target_label: __param_target

      - source_labels: [__param_target]
        target_label: instance

      - target_label: __address__
        replacement: 192.168.11.143:9115

#监控主机存活
  - job_name: 'ping_status'
    metrics_path: /probe
    params:
      module: [icmp]

    static_configs:
      - targets:
        - 192.168.11.141
        - 192.168.11.143 #可以写多个ip

    relabel_configs:
      - source_labels: [__address__]
        target_label: __param_target

      - source_labels: [__param_target]
        target_label: instance

      - target_label: __address__
        replacement: 192.168.11.143:9115
模板二
# 网站监控
  - job_name: 'http_status'
    metrics_path: /probe
    params:
      module: [http_2xx]
    static_configs:
      - targets: ['http://www.lzfn.com', 'wiki.lzfn.com']
        labels:
          instance: http_status
          group: web
    relabel_configs:
      - source_labels: [__address__]
        target_label: __param_target
      - target_label: __address__
        replacement: 192.168.5.85:9115

# ping 检测
  - job_name: 'ping_status'
    metrics_path: /probe
    params:
      module: [icmp]
    static_configs:
      - targets: ['192.168.5.85']
        labels:
          instance: 'ping_status'
          group: 'icmp'
    relabel_configs:
      - source_labels: [__address__]
        target_label: __param_target
      - target_label: __address__
        replacement: 192.168.5.85:9115

# 端口监控
  - job_name: 'port_status'
    metrics_path: /probe
    params:
      module: [tcp_connect]
    static_configs:
      - targets: ['192.168.5.85:80', '192.168.5.85:9000', '192.168.5.85:8080']
        labels:
          instance: 'port_status'
          group: 'port'
    relabel_configs:
      - source_labels: [__address__]
        target_label: __param_target
      - target_label: __address__
        replacement: 192.168.5.85:9115
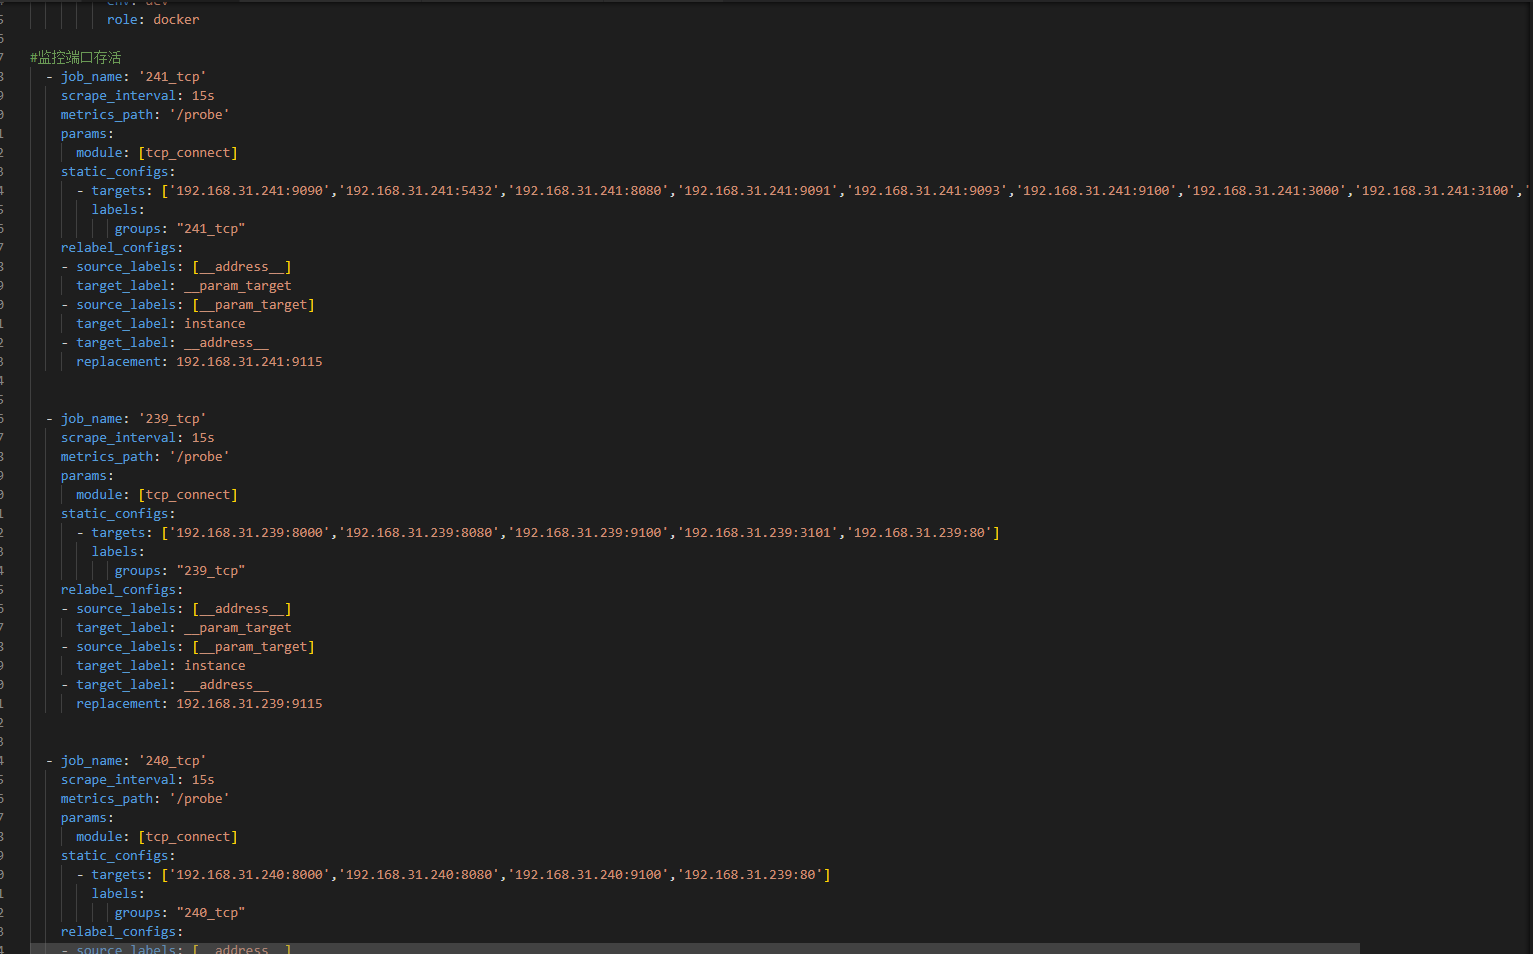
最终适配版本
#监控端口存活
  - job_name: 'tcp_ports'
    scrape_interval: 15s
    metrics_path: '/probe'
    params:
      module: [tcp_connect]
    static_configs:
      - targets: ['192.168.31.241:9090','192.168.31.241:5432']
        labels:
           groups: "tcp_up"
    relabel_configs:
    - source_labels: [__address__]
      target_label: __param_target
    - source_labels: [__param_target]
      target_label: instance
    - target_label: __address__
      replacement: 192.168.31.241:9115
配置完检测一下语法
./promtool check config prometheus.yml
然后重启一下prometheus
systemctl restart prometheus
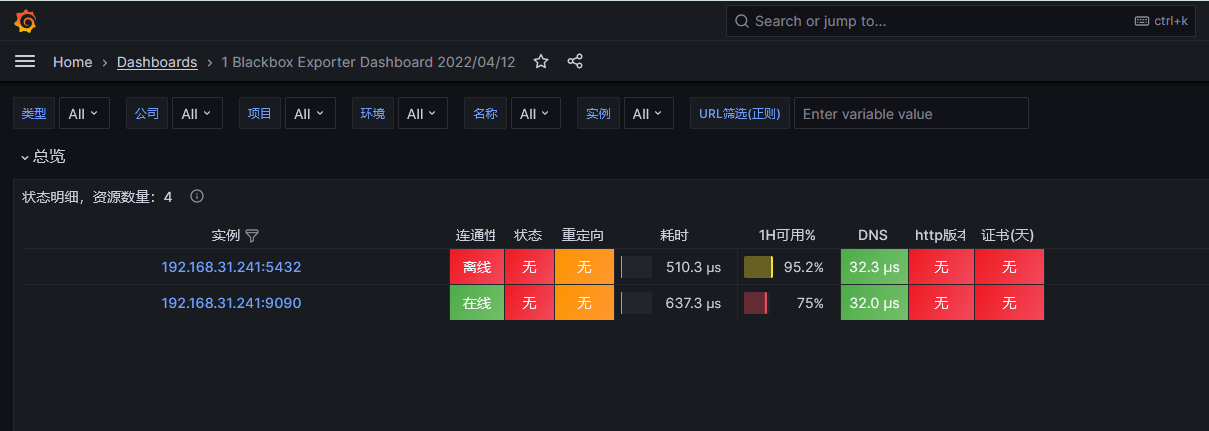
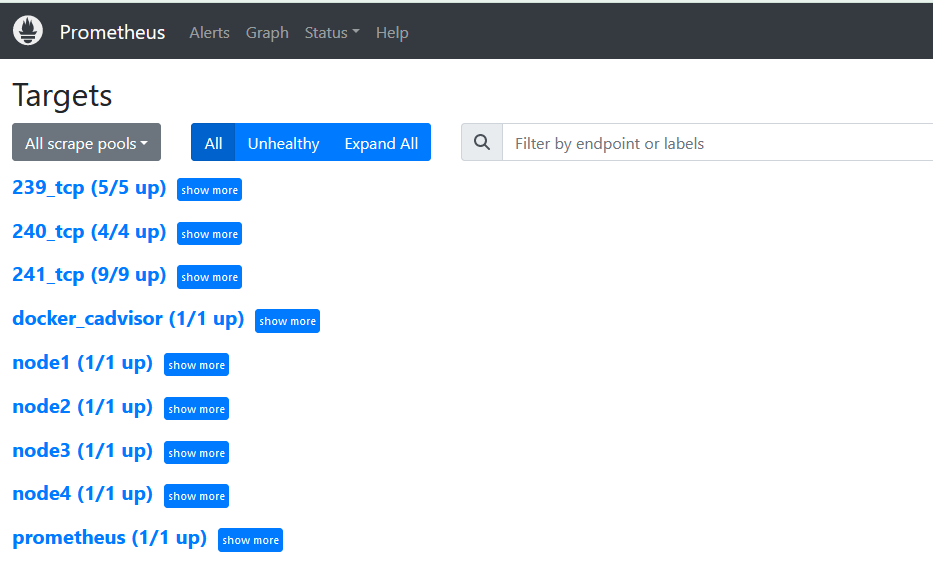
来到web端看下
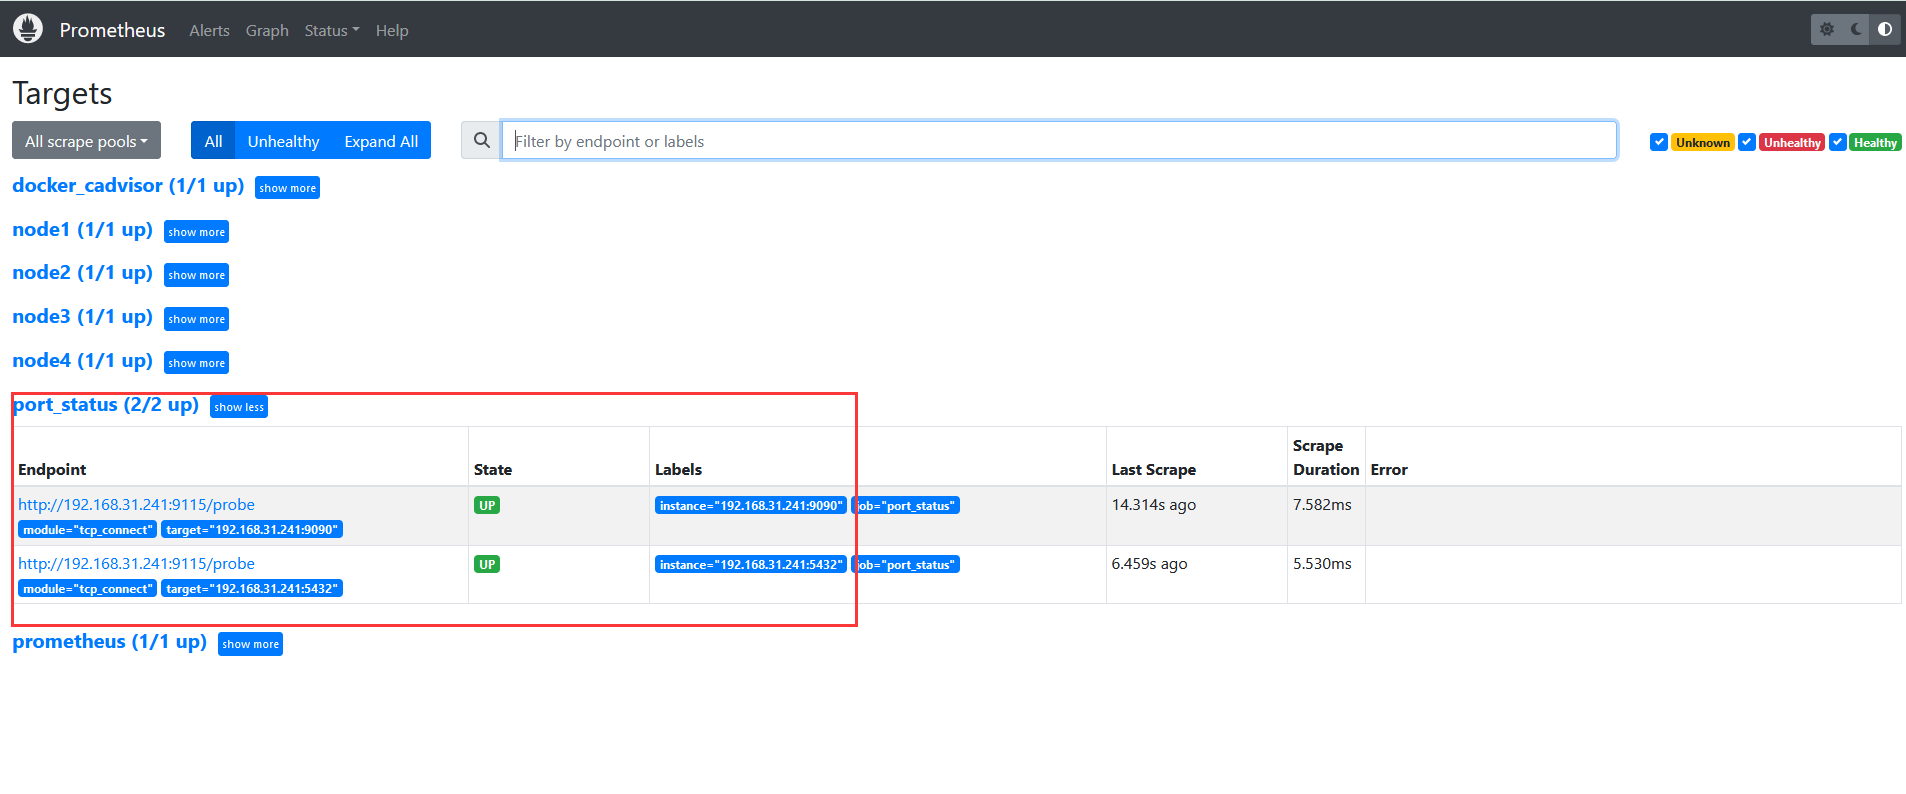
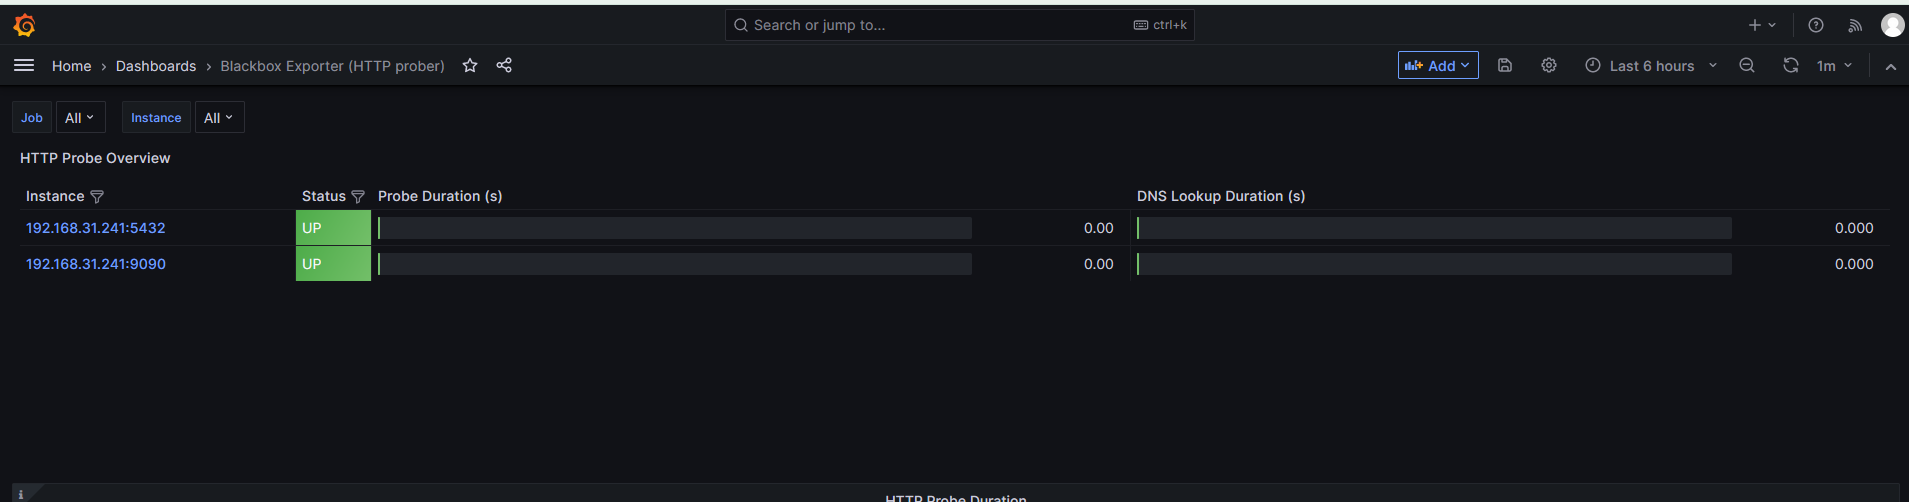
然后来到Grafana配置监控页面
直接搜索模板库按需下载
具体grafana配置请看
https://grafana.com/grafana/dashboards/?search=blackbox_exporter

ID: 13659
模板ID: 9965
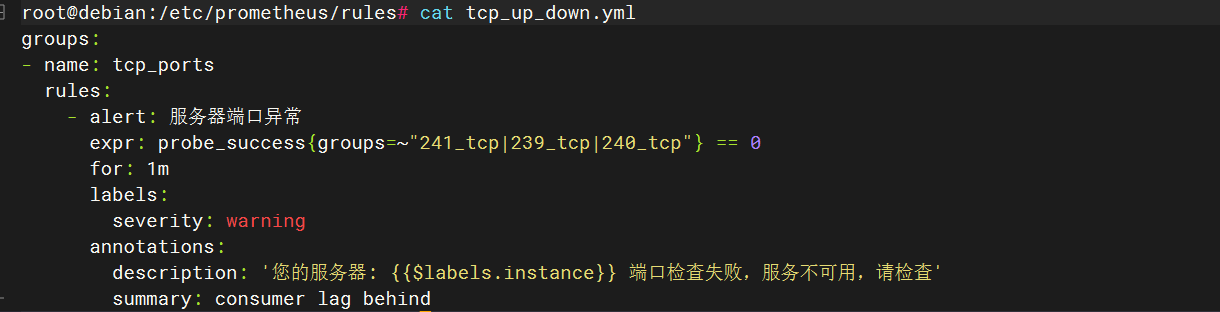
配置告警规则
root@debian:/etc/prometheus/rules# cat tcp_up_down.yml
groups:
- name: tcp_ports
rules:
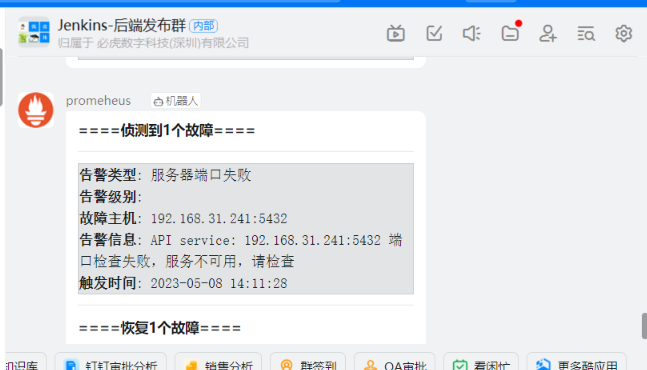
- alert: 服务器端口失败 # 标识 名字
expr: probe_success{groups="tcp_up"} == 0
for: 1m
labels:
severity: warning
annotations:
description: 'API service: {{$labels.instance}} 端口检查失败,服务不可用,请检查'
summary: consumer lag behind
配置多个任务
root@debian:/etc/prometheus/rules# cat tcp_up_down.yml
groups:
- name: tcp_ports
  rules:
    - alert: 服务器端口失败
      expr: probe_success{groups=~"tcp_up|tcp_up2"} == 0
      for: 1m
      labels:
        severity: warning
      annotations:
        description: 'API service: {{$labels.instance}} 端口检查失败,服务不可用,请检查'
        summary: consumer lag behind
测试报警
查看grafana
查看钉钉群
恢复

最终配置文件
prometheus.yml
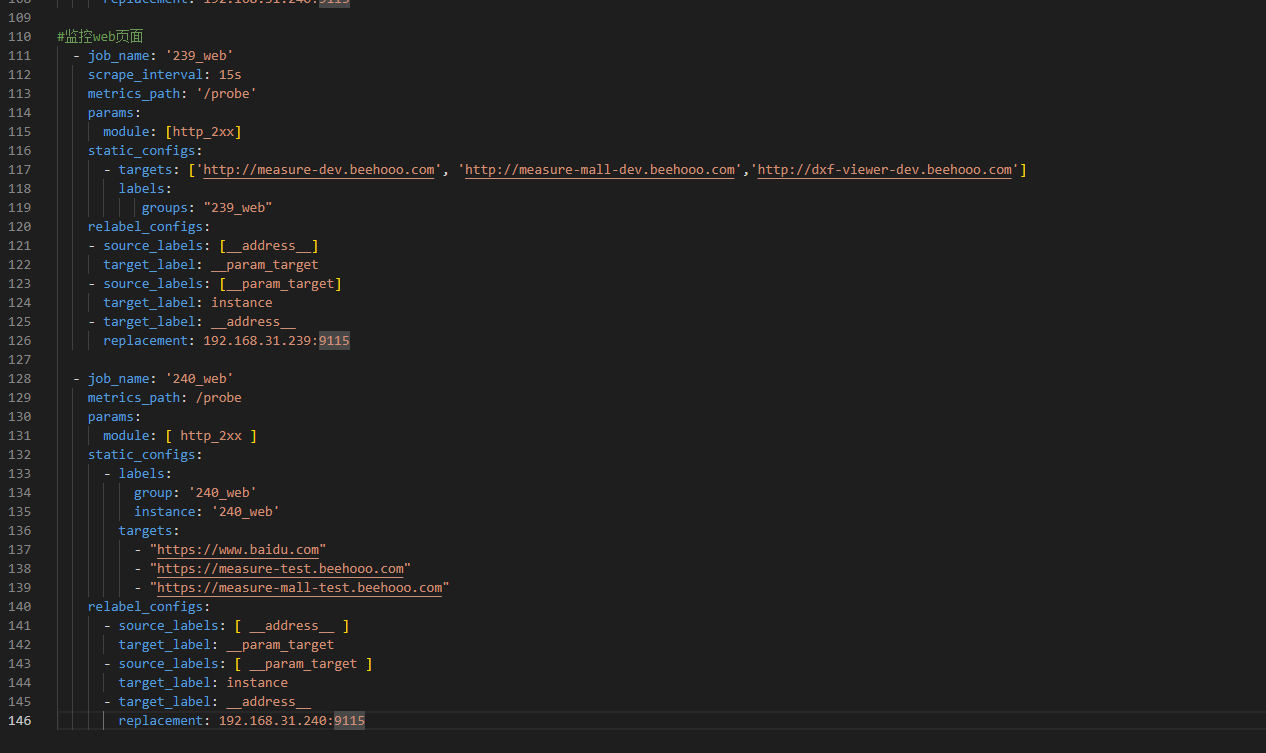
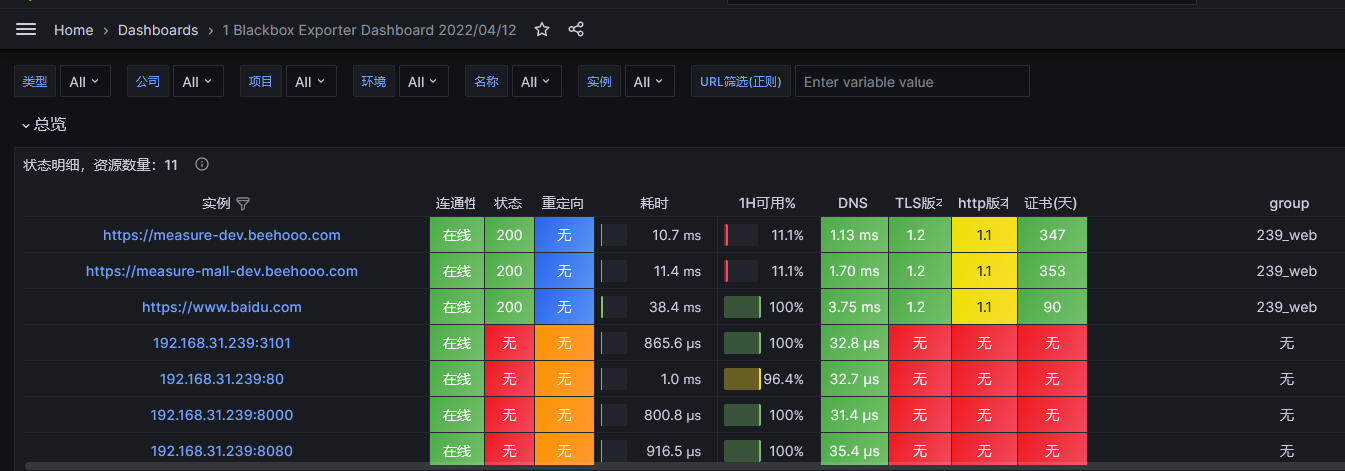
监控微web-域名
添加web任务
#监控web页面
  - job_name: '239_web'
    metrics_path: /probe
    params:
      module: [ http_2xx ]
    static_configs:
      - labels:
          group: '239_web'
          instance: '239_web'
        targets:
          - "https://www.baidu.com"
          - "https://measure-dev.beehooo.com"
          - "https://measure-mall-dev.beehooo.com"
    relabel_configs:
      - source_labels: [ __address__ ]
        target_label: __param_target
      - source_labels: [ __param_target ]
        target_label: instance
      - target_label: __address__
        replacement: 192.168.31.239:9115
查看grafana
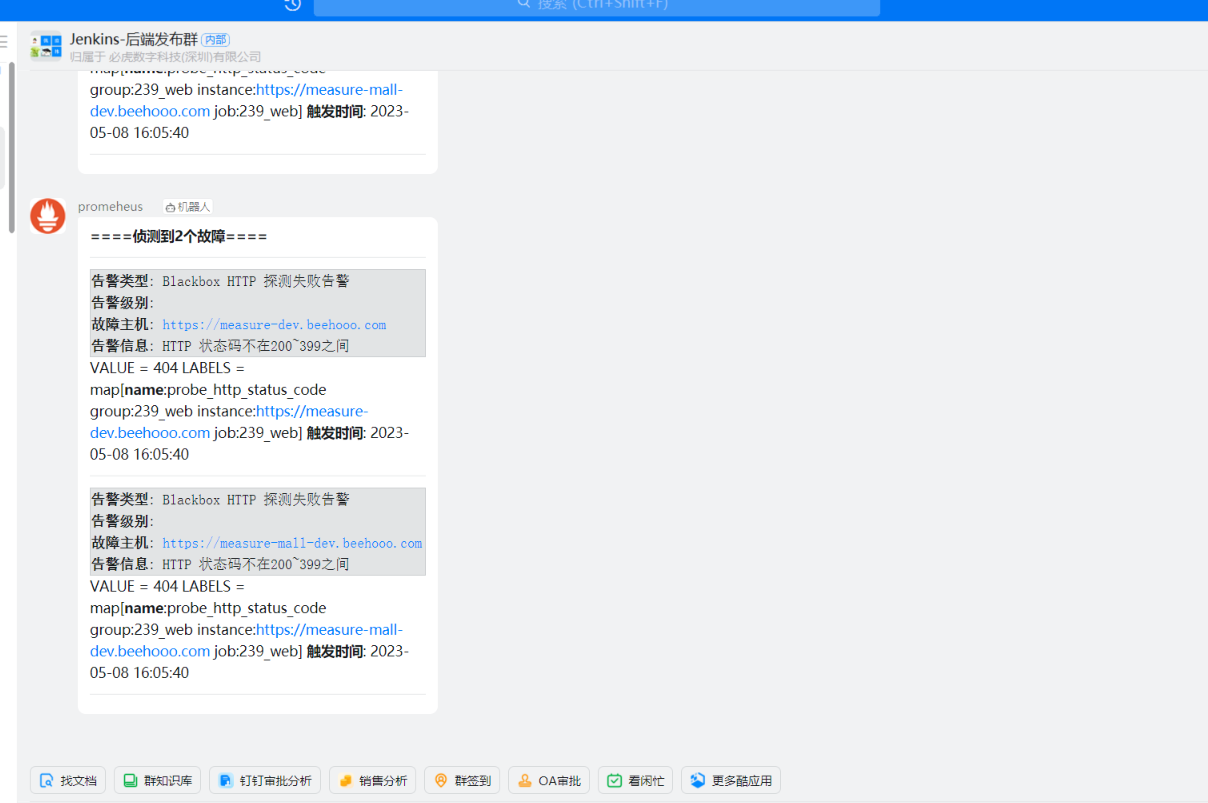
查看后台

编辑告警规则
groups:
- name: blackbox
  rules:


  - alert: Blackbox 探测失败告警
    expr: probe_success == 0  # 如果探测成功指标值为1,否则为0
    for: 0m  # 规则必须满足条件的时间长度(这里是0分钟)
    labels:
      severity: critical  # 告警级别设置为critical
    annotations:
      summary: Blackbox 探测失败 (实例 {{ $labels.instance }})  # 告警摘要信息
      description: "探测失败\n  VALUE = {{ $value }}\n  LABELS = {{ $labels }}"  # 告警详情信息


  - alert: Blackbox 探测过慢告警
    expr: avg_over_time(probe_duration_seconds[1m]) > 1  # 控制器耗时平均值大于1秒
    for: 1m  # 规则必须满足条件的时间长度(这里是1分钟)
    labels:
      severity: warning  # 告警级别设置为warning
    annotations:
      summary: Blackbox 探测过慢 (实例 {{ $labels.instance }})  # 告警摘要信息
      description: "探测用时超过1秒\n  VALUE = {{ $value }}\n  LABELS = {{ $labels }}"  # 告警详情信息


  - alert: Blackbox HTTP 探测失败告警
    expr: probe_http_status_code <= 199 OR probe_http_status_code >= 400  # HTTP 状态码不在200~399之间时触发告警
    for: 0m  # 规则必须满足条件的时间长度(这里是0分钟)
    labels:
      severity: critical  # 告警级别设置为critical
    annotations:
      summary: Blackbox HTTP 探测失败 (实例 {{ $labels.instance }})  # 告警摘要信息
      description: "HTTP 状态码不在200~399之间\n  VALUE = {{ $value }}\n  LABELS = {{ $labels }}"  # 告警详情信息


  - alert: Blackbox HTTP 探测过慢告警
    expr: avg_over_time(probe_http_duration_seconds[1m]) > 1  # HTTP 请求用时平均值大于1秒
    for: 1m  # 规则必须满足条件的时间长度(这里是1分钟)
    labels:
      severity: warning  # 告警级别设置为warning
    annotations:
      summary: Blackbox HTTP 探测过慢 (实例 {{ $labels.instance }})  # 告警摘要信息
      description: "HTTP 请求用时超过1秒\n  VALUE = {{ $value }}\n  LABELS = {{ $labels }}"  # 告警详情信息


  - alert: Blackbox Ping 探测过慢告警
    expr: avg_over_time(probe_icmp_duration_seconds[1m]) > 1  # Ping 请求用时平均值大于1秒
    for: 1m  # 规则必须满足条件的时间长度(这里是1分钟)
    labels:
      severity: warning  # 告警级别设置为warning
    annotations:
      summary: Blackbox Ping 探测过慢 (实例 {{ $labels.instance }})  # 告警摘要信息
      description: "Ping 请求用时超过1秒\n  VALUE = {{ $value }}\n  LABELS = {{ $labels }}"  # 告警详情信息
产生报警
恢复

配置不同环境
{{ $labels.instance }}) # 告警摘要信息
description: “探测用时超过1秒\n VALUE = {{ $value }}\n LABELS = {{ $labels }}” # 告警详情信息
-
alert: Blackbox HTTP 探测失败告警
expr: probe_http_status_code <= 199 OR probe_http_status_code >= 400 # HTTP 状态码不在200~399之间时触发告警
for: 0m # 规则必须满足条件的时间长度(这里是0分钟)
labels:
severity: critical # 告警级别设置为critical
annotations:
summary: Blackbox HTTP 探测失败 (实例 {{ $labels.instance }}) # 告警摘要信息
description: “HTTP 状态码不在200~399之间\n VALUE = {{ $value }}\n LABELS = {{ $labels }}” # 告警详情信息 -
alert: Blackbox HTTP 探测过慢告警
expr: avg_over_time(probe_http_duration_seconds[1m]) > 1 # HTTP 请求用时平均值大于1秒
for: 1m # 规则必须满足条件的时间长度(这里是1分钟)
labels:
severity: warning # 告警级别设置为warning
annotations:
summary: Blackbox HTTP 探测过慢 (实例 {{ $labels.instance }}) # 告警摘要信息
description: “HTTP 请求用时超过1秒\n VALUE = {{ $value }}\n LABELS = {{ $labels }}” # 告警详情信息 -
alert: Blackbox Ping 探测过慢告警
expr: avg_over_time(probe_icmp_duration_seconds[1m]) > 1 # Ping 请求用时平均值大于1秒
for: 1m # 规则必须满足条件的时间长度(这里是1分钟)
labels:
severity: warning # 告警级别设置为warning
annotations:
summary: Blackbox Ping 探测过慢 (实例 {{ $labels.instance }}) # 告警摘要信息
description: “Ping 请求用时超过1秒\n VALUE = {{ $value }}\n LABELS = {{ $labels }}” # 告警详情信息
###### 产生报警
[外链图片转存中...(img-UF5Xjkhp-1683535390294)]
###### 恢复
[外链图片转存中...(img-J8DukiPP-1683535390294)]
### 配置不同环境