一、我们需要什么指标
对于DDD、TDD等,大家比较熟悉了,但是对于MDD可能就比较陌生了。MDD是Metrics-Driven Development的缩写,主张开发过程由指标驱动,通过实用指标来驱动快速、精确和细粒度的软件迭代。MDD可使所有可以测量的东西都得到量化和优化,进而为整个开发过程带来可见性,帮助相关人员快速、准确地作出决策,并在发生错误时立即发现问题并修复。依照MDD的理念,在需求阶段就应该考虑关键指标,在应用上线后通过指标了解现状并持续优化。有一些基于指标的方法论,建议大家了解一下:
Google的四大黄金指标:延迟Latency、流量Traffic、错误Errors、饱和度Saturation
Netflix的USE方法:使用率Utilization、饱和度Saturation、错误Error
WeaveCloud的RED方法:速率Rate、错误Errors、耗时Duration
二、在SrpingBoot中引入prometheus
io.micrometer
micrometer-registry-prometheus
1.7.3


io.github.mweirauch
micrometer-jvm-extras
0.2.2然后,在application.properties中将prometheus的endpoint放出来。
management:
  endpoints:
    web:
      exposure:
        include: info,health,prometheus
接下来就可以进行指标埋点了,Prometheus的四种指标类型此处不再赘述,请自行学习。一般指标埋点代码实现上有两种形式:AOP、侵入式,建议尽量使用AOP记录指标,对于无法使用aop的场景就只能侵入代码了。常用的AOP方式有:
@Aspect(通用)
HandlerInterceptor (SpringMVC的拦截器)
ClientHttpRequestInterceptor (RestTemplate的拦截器)
DubboFilter (dubbo接口)
我们选择通用的@Aspect,结合自定义指标注解来实现。首先自定义指标注解:
@Documented
@Retention(RetentionPolicy.RUNTIME)
@Target(ElementType.METHOD)
public @interface MethodMetrics {
    String name() default "";
    String desc() default "";
    String[] tags() default {};
    //是否记录时间间隔
    boolean withoutDuration() default false;
}
然后是切面实现:
@Aspect
public class PrometheusAnnotationAspect {

    @Autowired
    private MeterRegistry meterRegistry;

    @Pointcut("@annotation(com.smac.prometheus.annotation.MethodMetrics)")
    public void pointcut() {}

    @Around(value = "pointcut()")
    public Object process(ProceedingJoinPoint joinPoint) throws Throwable {
        Method targetMethod = ((MethodSignature) joinPoint.getSignature()).getMethod();
        Method currentMethod = ClassUtils.getUserClass(joinPoint.getTarget().getClass()).getDeclaredMethod(targetMethod.getName(), targetMethod.getParameterTypes());
        if (currentMethod.isAnnotationPresent(MethodMetrics.class)) {
            MethodMetrics methodMetrics = currentMethod.getAnnotation(MethodMetrics.class);
            return processMetric(joinPoint, currentMethod, methodMetrics);
        } else {
            return joinPoint.proceed();
        }
    }

    private Object processMetric(ProceedingJoinPoint joinPoint, Method currentMethod, MethodMetrics methodMetrics) {
        String name = methodMetrics.name();
        if (!StringUtils.hasText(name)) {
            name = currentMethod.getName();
        }
        String desc = methodMetrics.desc();
        if (!StringUtils.hasText(desc)) {
            desc = currentMethod.getName();
        }
        //不需要记录时间
        if (methodMetrics.withoutDuration()) {
            Counter counter = Counter.builder(name).tags(methodMetrics.tags()).description(desc).register(meterRegistry);
            try {
                return joinPoint.proceed();
            } catch (Throwable e) {
                throw new IllegalStateException(e);
            } finally {
                counter.increment();
            }
        }
        //需要记录时间(默认)
        Timer timer = Timer.builder(name).tags(methodMetrics.tags()).description(desc).register(meterRegistry);
        return timer.record(() -> {
            try {
                return joinPoint.proceed();
            } catch (Throwable e) {
                throw new IllegalStateException(e);
            }
        });
    }
}
代码很容易,没什么可说明的,接下来就是在需要记监控的地方加上这个注解就行,比如:
@MethodMetrics(name="sms_send",tags = {"vendor","aliyun"})
public void send(String mobile, SendMessage message) throws Exception {
    ...
}
至此,aop形式的指标实现方式就完成了。如果是侵入式的话,直接使用meterRegistry就行:
meterRegistry.counter("sms.send","vendor","aliyun").increment();启动服务,打开http://localhost:8080/actuator/prometheus查看指标。
三、高级指标之分位数
分位数(P50/P90/P95/P99)是我们常用的一个性能指标,Prometheus提供了两种解决方案:
1. client侧计算方案
summery类型,设置percentiles,在本地计算出Pxx,作为指标的一个tag被直接收集。
Timer timer = Timer.builder("sms.send").publishPercentiles(0.5, 0.9, 0.95,0.99).register(meterRegistry);
timer.record(costTime, TimeUnit.MILLISECONDS);
会出现四个带quantile的指标,如图:
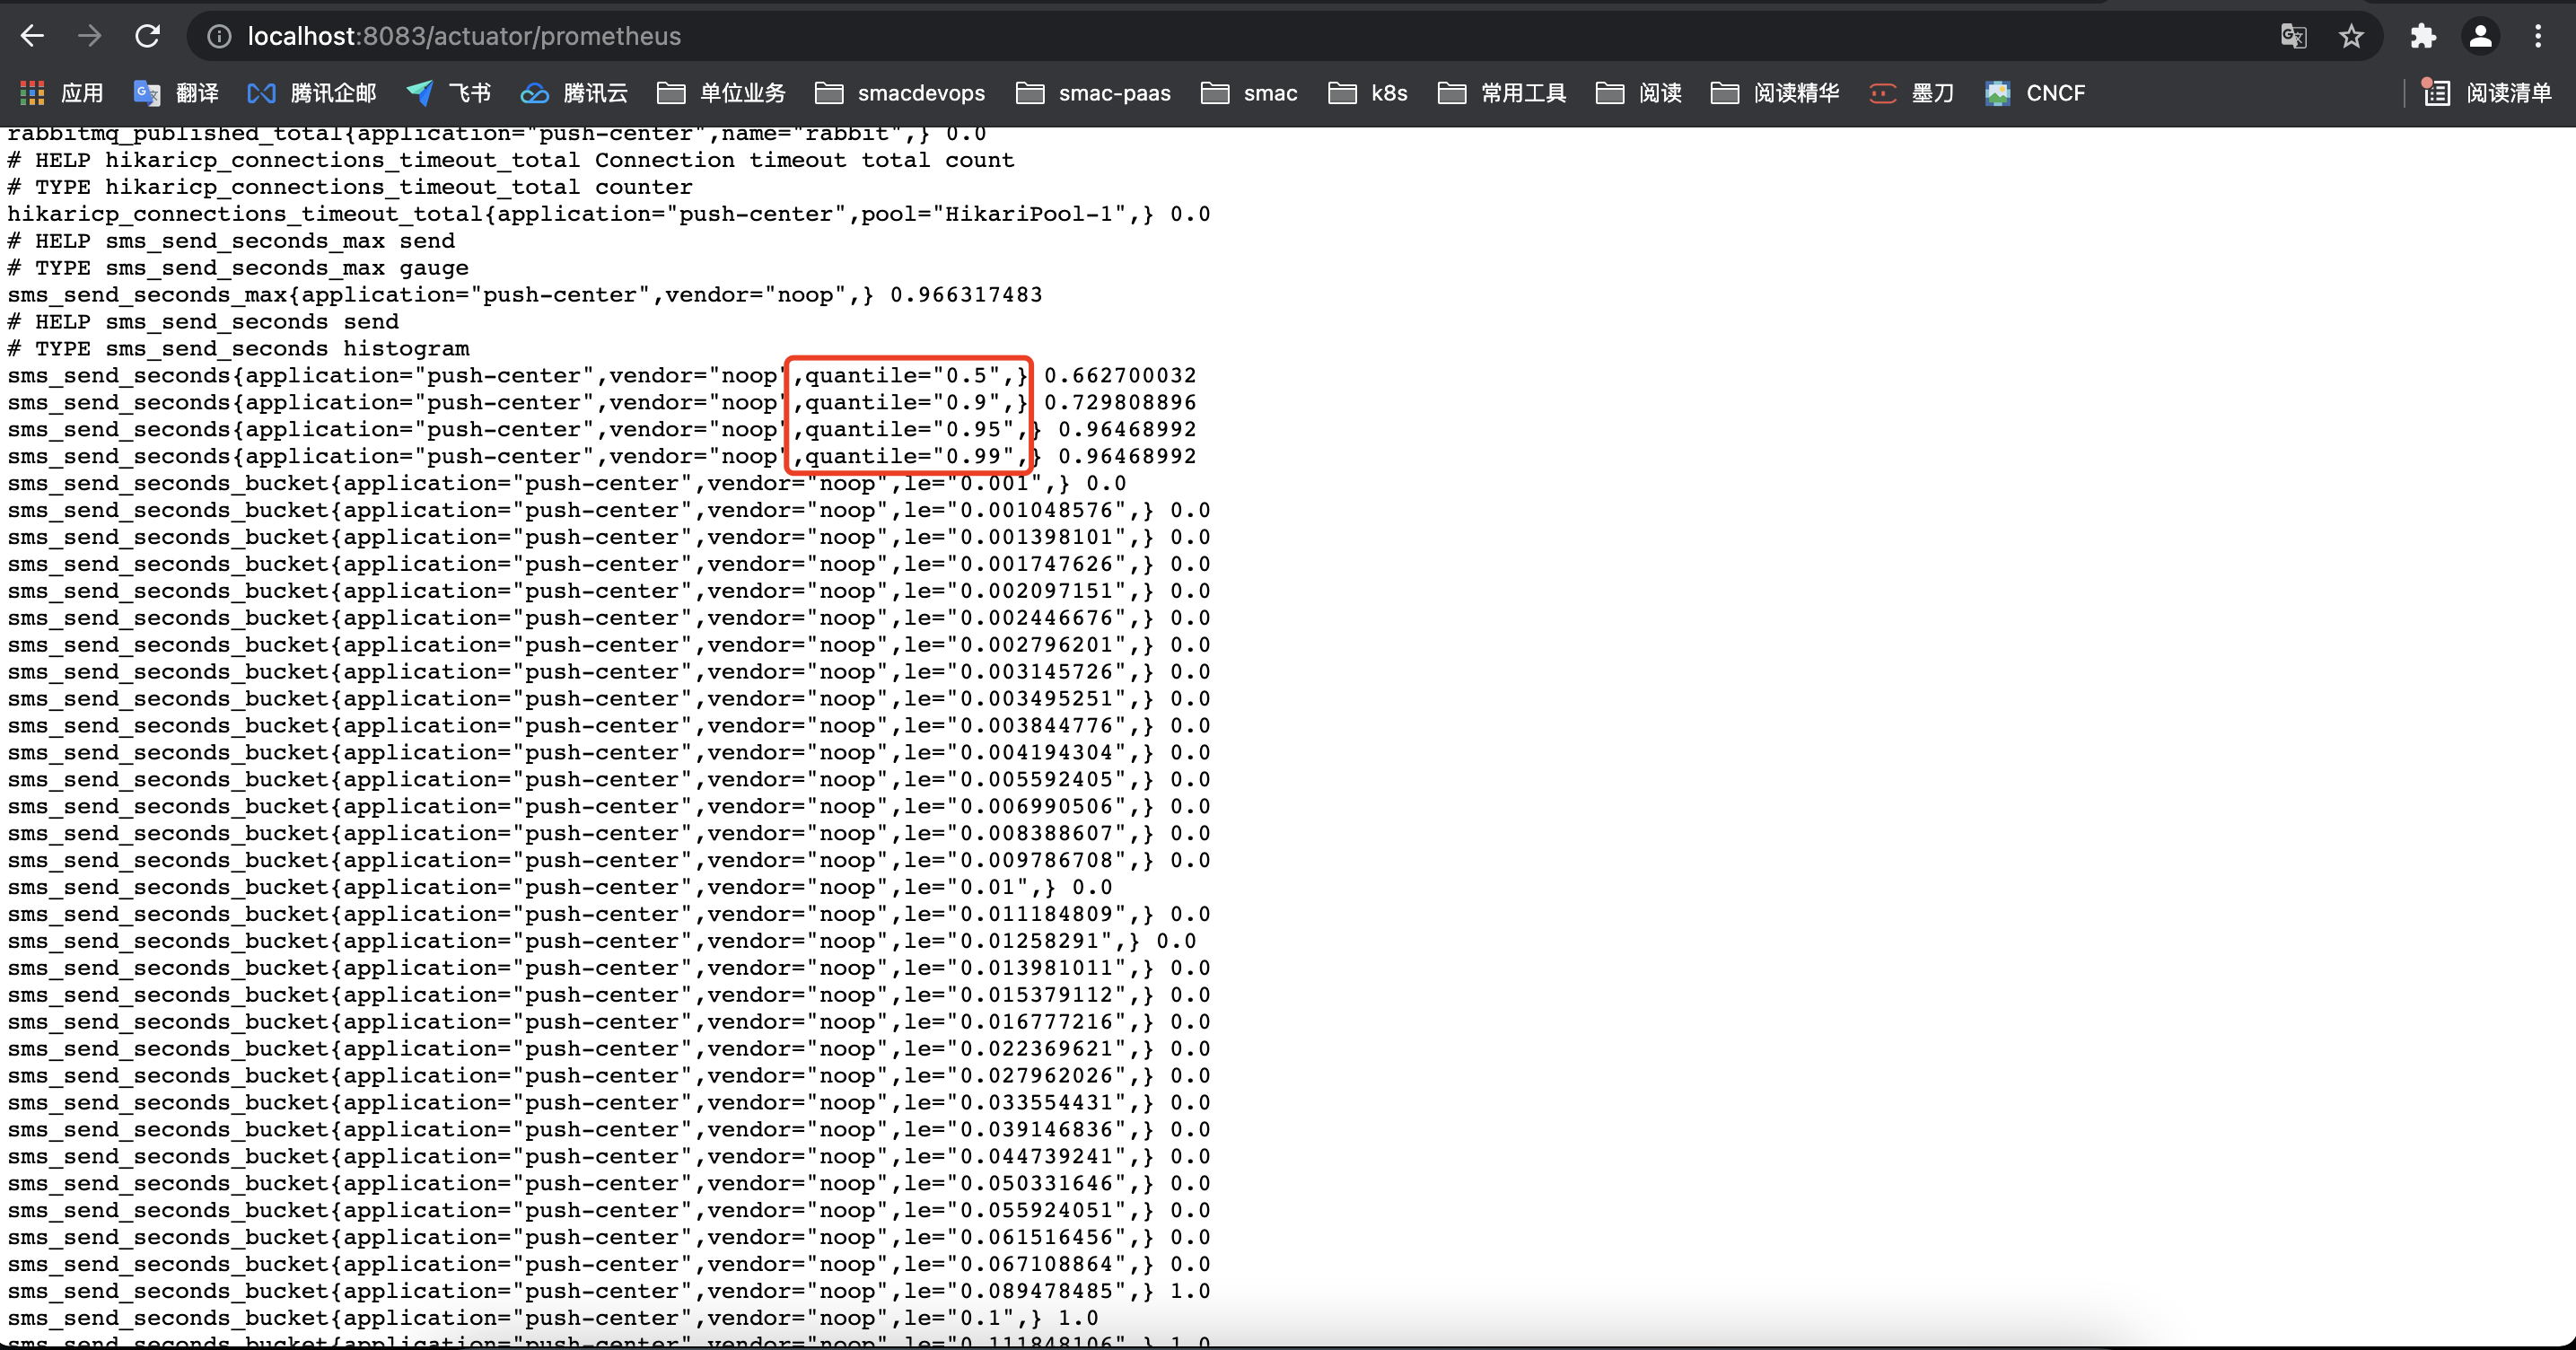
2. server侧计算方案
开启histogram,将所有样本放入buckets中,在server侧通过histogram_quantile函数对buckets进行实时计算得出。注意:histogram采用了线性插值法,buckets的划分对误差的影响比较大,需合理设置。
Timer timer = Timer.builder("sms.send")
                .publishPercentileHistogram(true)
                .serviceLevelObjectives(Duration.ofMillis(10),Duration.ofMillis(20),Duration.ofMillis(50))
                .minimumExpectedValue(Duration.ofMillis(1))
                .maximumExpectedValue(Duration.ofMillis(100))
                .register(meterRegistry);
timer.record(costTime, TimeUnit.MILLISECONDS);
会出现一堆xxxx_bucket的指标,如图:

然后,使用
histogram_quantile(0.95, rate(sms_send_seconds_bucket[5m]))
就可以看到P95的指标了,如图:
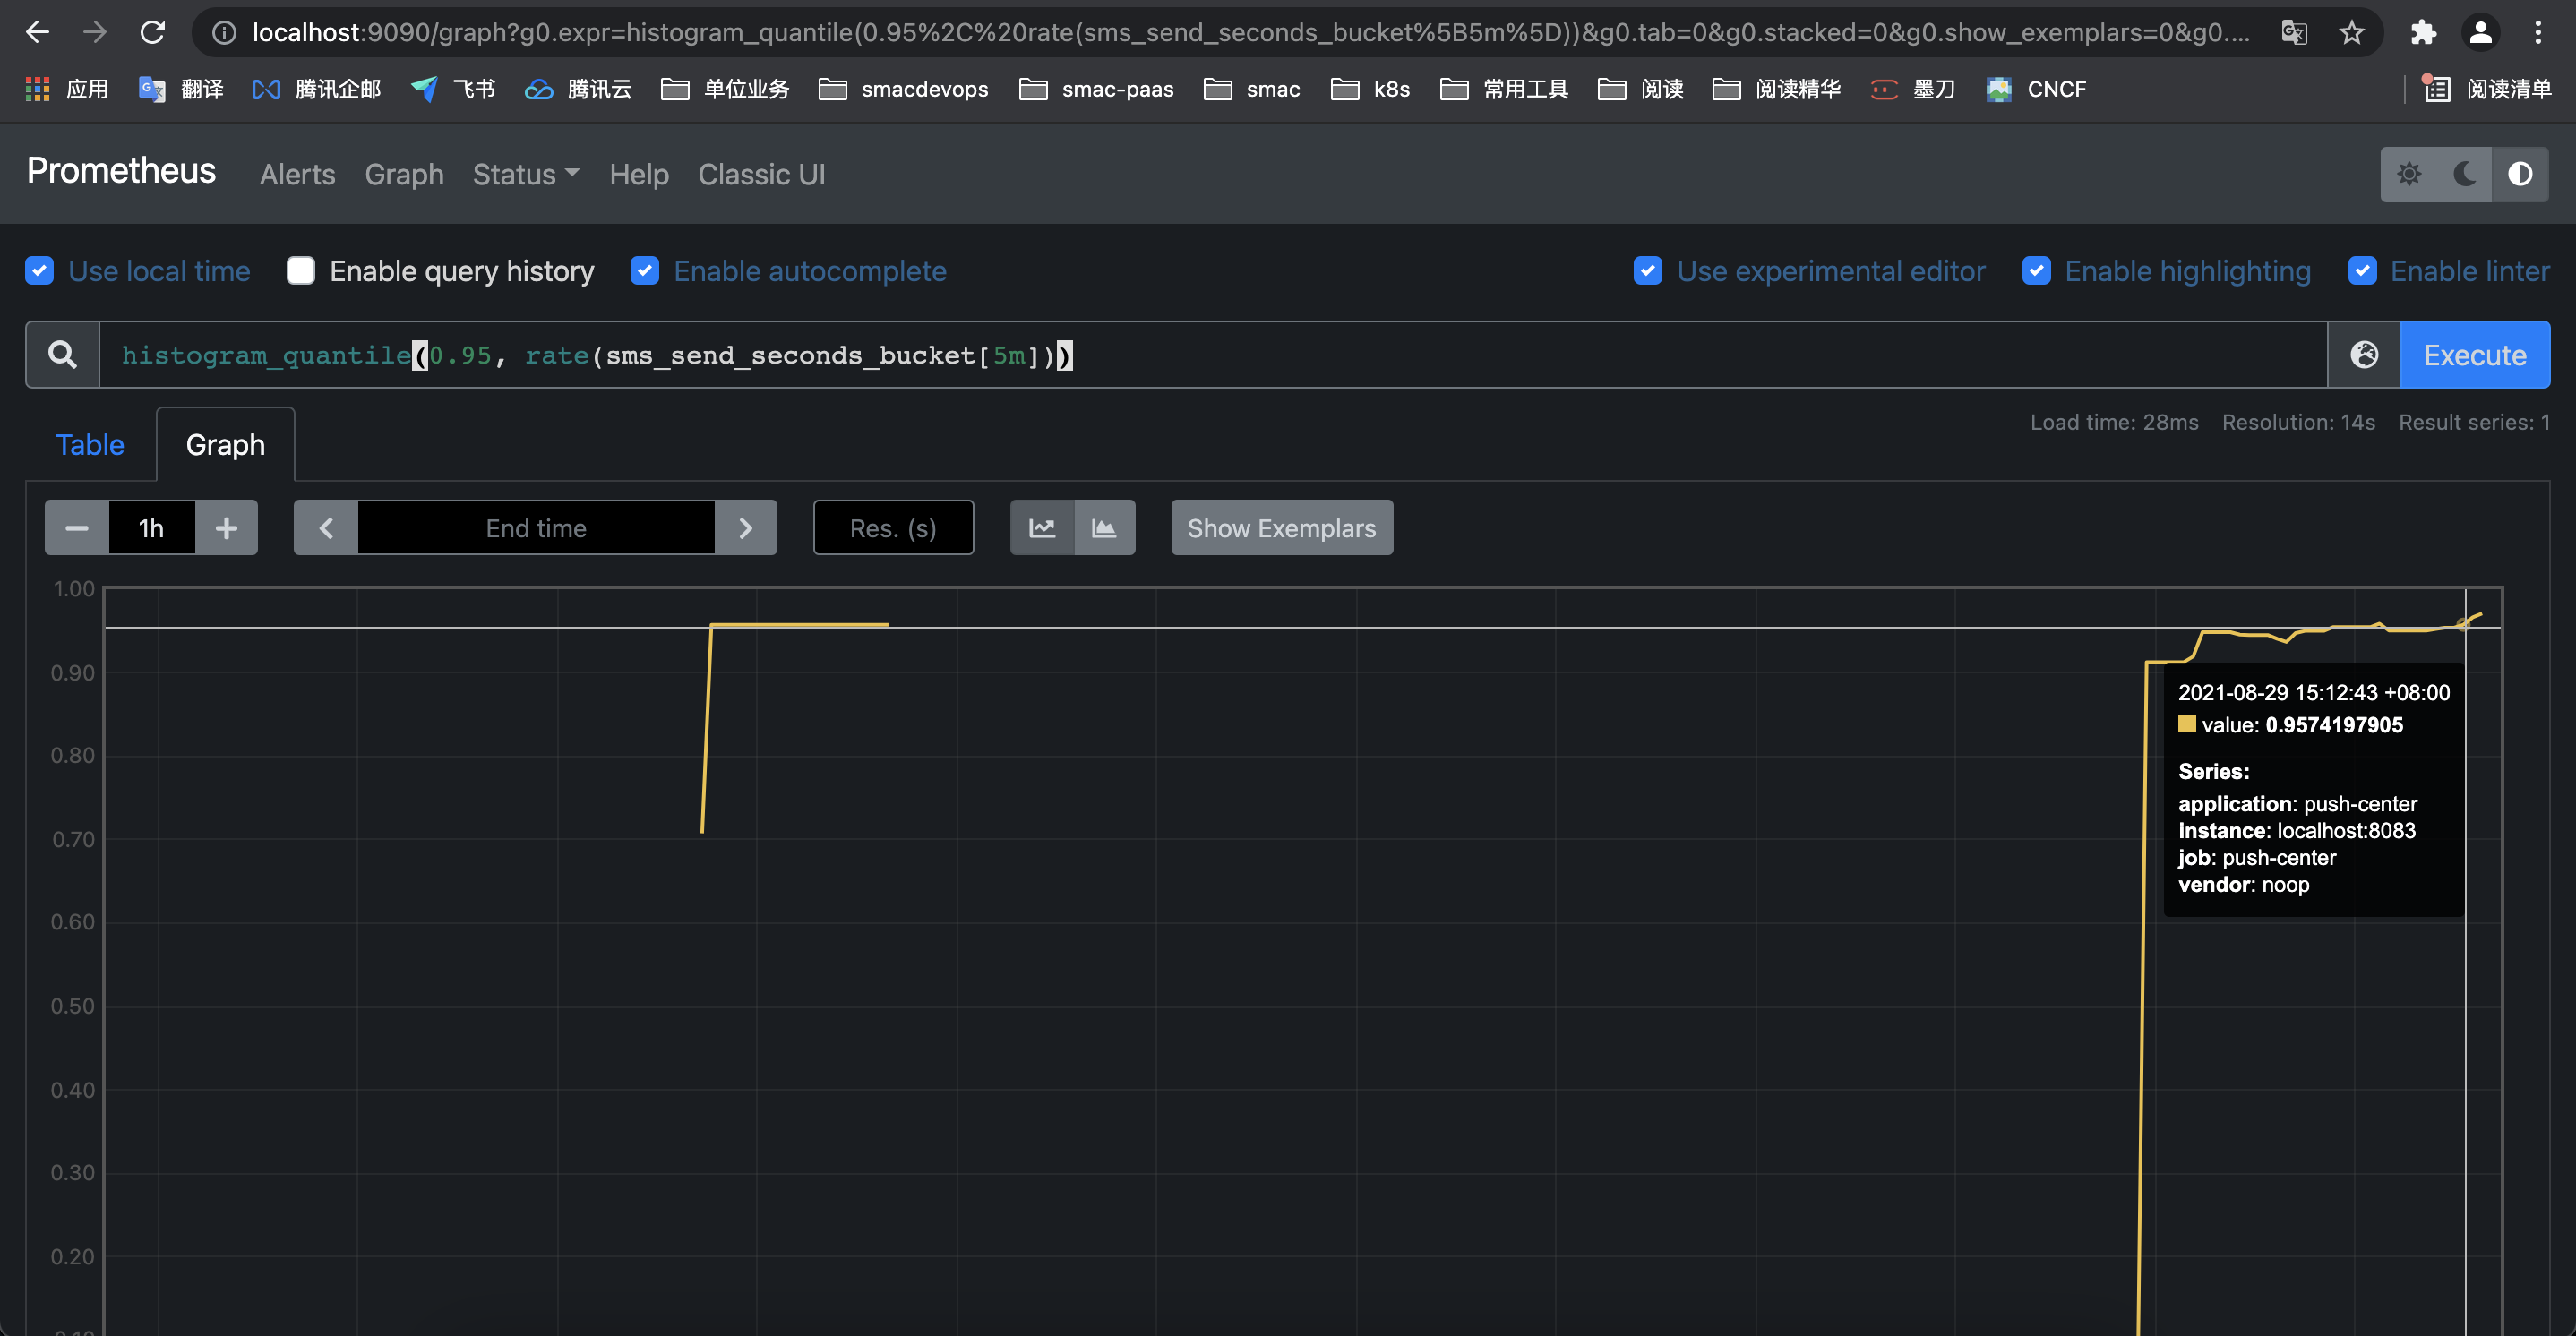
结论:
方案1适用于单机或只关心本地运行情况的指标,比如gc时间、定时任务执行时间、本地缓存更新时间等;
方案2则适用于分布式环境下的整体运行情况的指标,比如搜索接口的响应时间、第三方接口的响应时间等。