环境参数:
运行命令:
1、uname -a (Linux查看版本当前操作系统内核信息)

2、cat /proc/version (Linux查看当前操作系统版本信息)

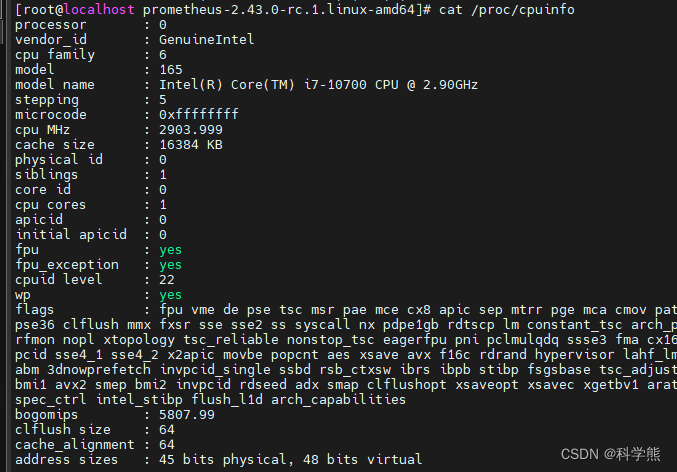
3、cat /proc/cpuinfo
lscpu (Linux查看cpu相关信息,包括型号、主频、内核信息等)
1、部署prometheus
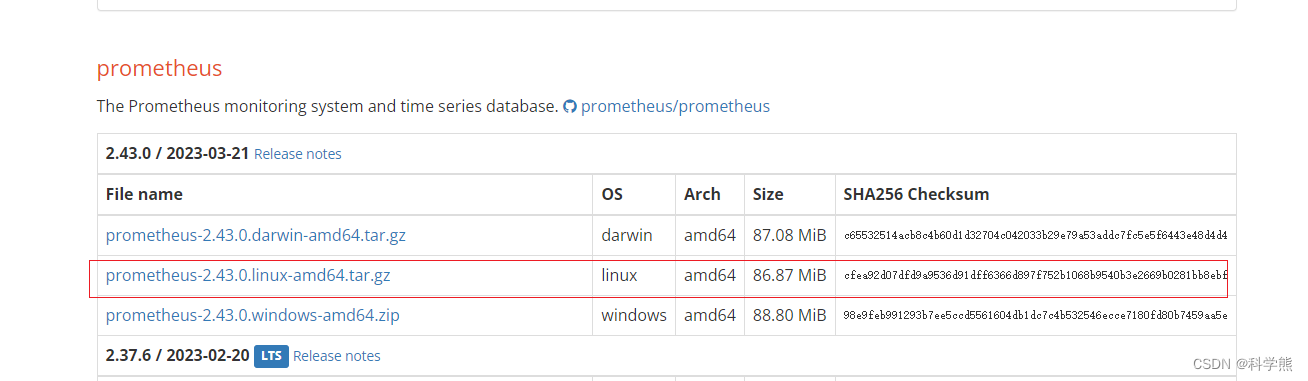
下载地址:prometheus官方下载网页
1.1下载prometheus安装包
wget https://github.com/prometheus/prometheus/releases/download/v2.43.0/prometheus-2.43.0.linux-amd64.tar.gz
tar -zxvf /tmp/prometheus-2.43.0.linux-amd64.tar.gz
解压后目录:

重点关注prometheus.yml,该文件为prometheus的配置文件。
# my global config
global:
  scrape_interval: 15s # 将监测间隔设置为每15秒。默认为1分钟一次
  evaluation_interval: 15s # 每15秒评估一次规则。默认为1分钟。
  # scrape_timeout is set to the global default (10s).

# Alertmanager configuration(报警管理程序配置)
alerting:
  alertmanagers:
    - static_configs:
        - targets:
          # - alertmanager:9093

# Load rules once and periodically evaluate them according to the global 'evaluation_interval'.
rule_files:
  # - "first_rules.yml"
  # - "second_rules.yml"

# A scrape configuration containing exactly one endpoint to scrape:
# Here it's Prometheus itself.
scrape_configs:
  # The job name is added as a label `job=<job_name>` to any timeseries scraped from this config.
 - job_name: "prometheus"

    # metrics_path defaults to '/metrics'
    # scheme defaults to 'http'.

    static_configs:
      - targets: ["localhost:9090"]
 - job_name: "server"
    static_configs:
      - targets: ["192.168.49.130:9100"]
 - job_name: "demo-server"
    metrics_path: '/actuator/prometheus'
    scrape_interval: 5s
    static_configs:
      - targets: ["192.168.49.2:9484"]
其他详细配置参数,请查看官方文档:prometheus Configuration file
重点:scrape_configs 主要用于配置拉取数据节点,每一个拉取配置主要包含以下参数:
- job_name:任务名称
- honor_labels: 用于解决拉取数据标签有冲突,当设置为 true, 以拉取数据为准,否则以服务配置为准
- params:数据拉取访问时带的请求参数 scrape_interval: 拉取时间间隔
- scrape_timeout: 拉取超时时间
- metrics_path: 拉取节点的 metric 路径
- static_configs:配置访问路径前缀,如ip+port,或者域名地址,或者通过服务发现,类似192.168.49.130:9100
- scheme: 拉取数据访问协议,如http
- sample_limit:存储的数据标签个数限制,如果超过限制,该数据将被忽略,不入存储;默认值为0,表示没有限制
- relabel_configs:拉取数据重置标签配置
- metric_relabel_configs:metric 重置标签配置
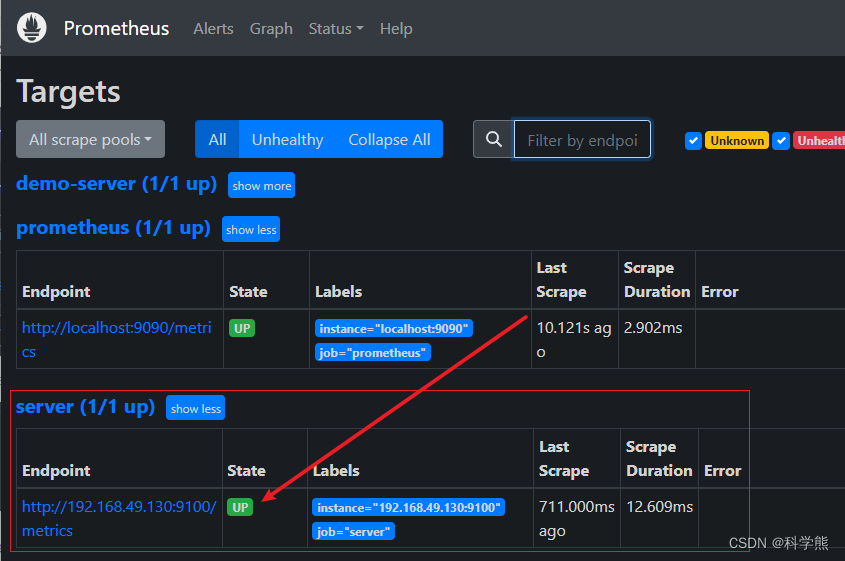
上面的配置文件我配置了三个监测点,三个jod_name分别是prometheus(监控promethues本身)、server(监控Centos服务器)、demo-server(监控springboot应用)。
1.2、启动prometheus并在后台运行,支持热更新。
nohup ./prometheus --config.file=prometheus.yml --web.enable-lifecycle > startLog.log 2>&1 &
1.3、检查是否启动
http://192.168.49.130:9090/metrics
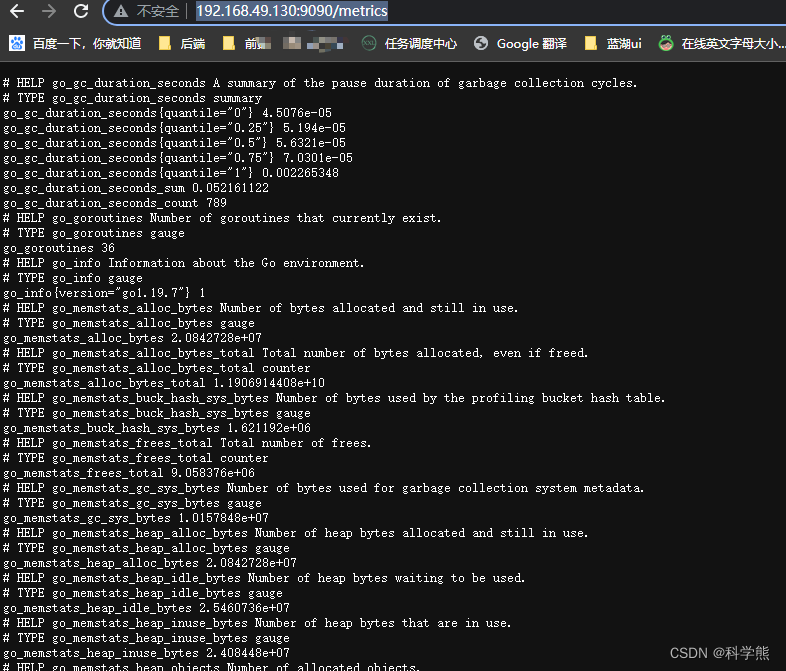
或者查看项目路径下日志输出文件:startLog.log
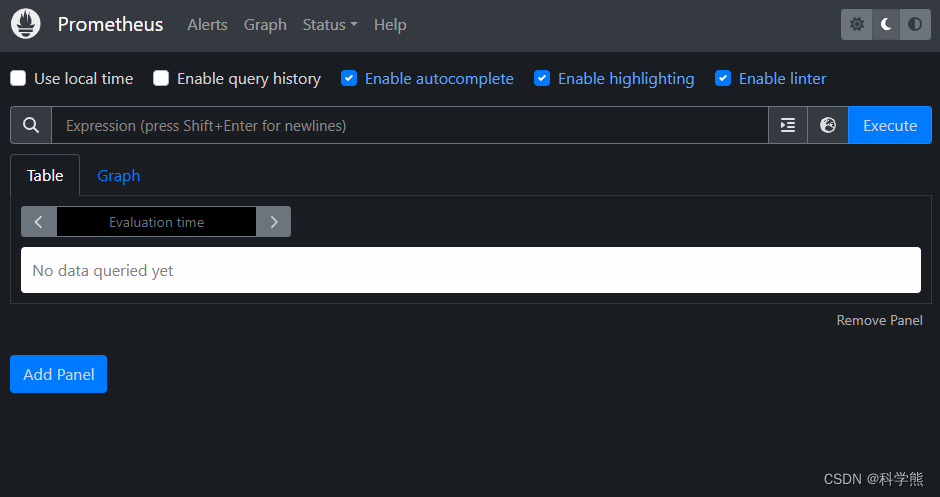
1.4、访问prometheus提供的web-ui
http://192.168.49.130:9090/
上面地址会重定向到
http://192.168.49.130:9090/graph
1.5、添加jobs/exporters采集数据
如下prometheus架构图,prometheus serrver通过拉取metris数据来采集数据,而数据提供靠各个jobs/exporters。
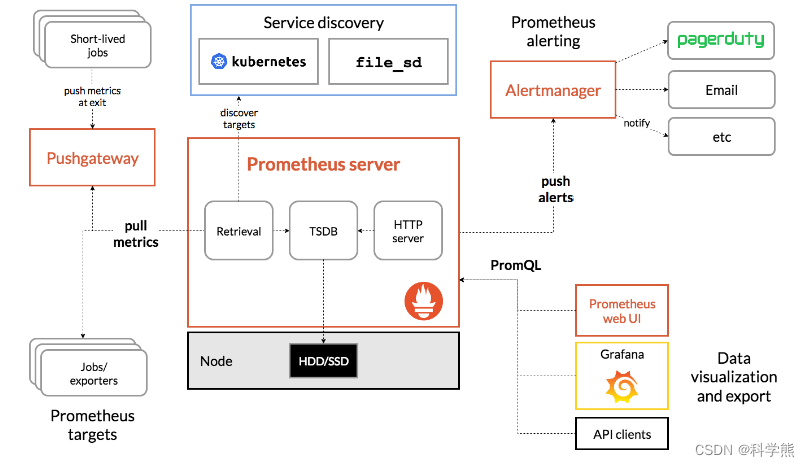
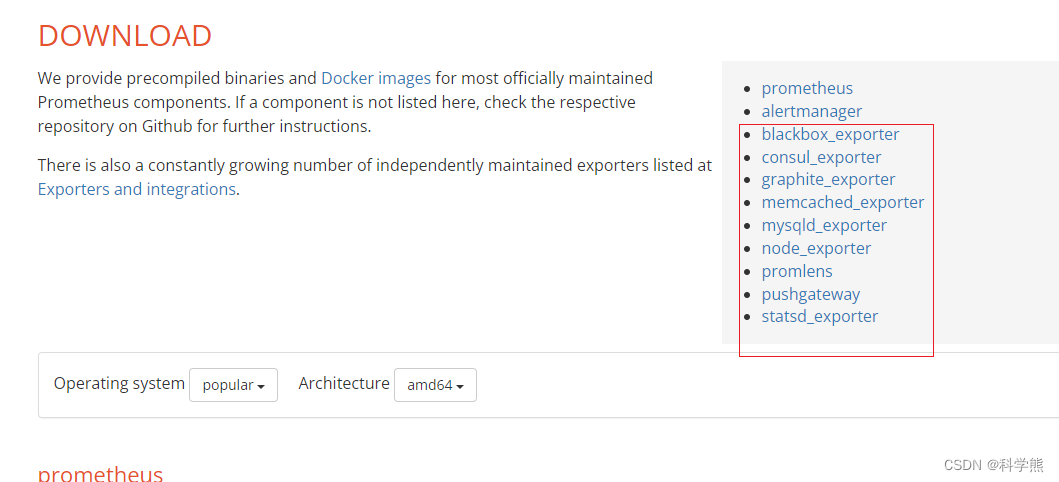
官方提供的exporters
node_exporter是监控服务器的exporter,下载安装包,并配置prometheus.yml中的scrape_configs
 - job_name: "server"
    static_configs:
      - targets: ["192.168.49.130:9100"]
热更新prometheus,执行下面的命令。
curl -X POST http://ip:9090/-/reload
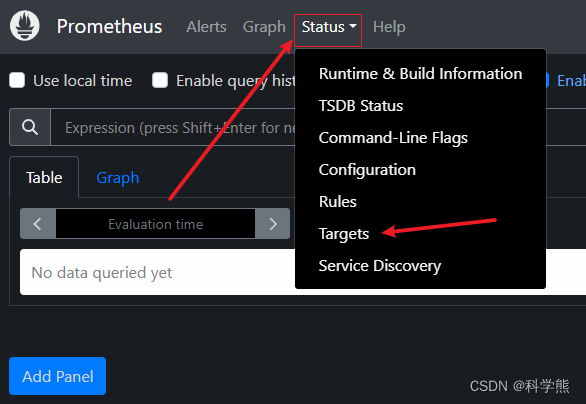
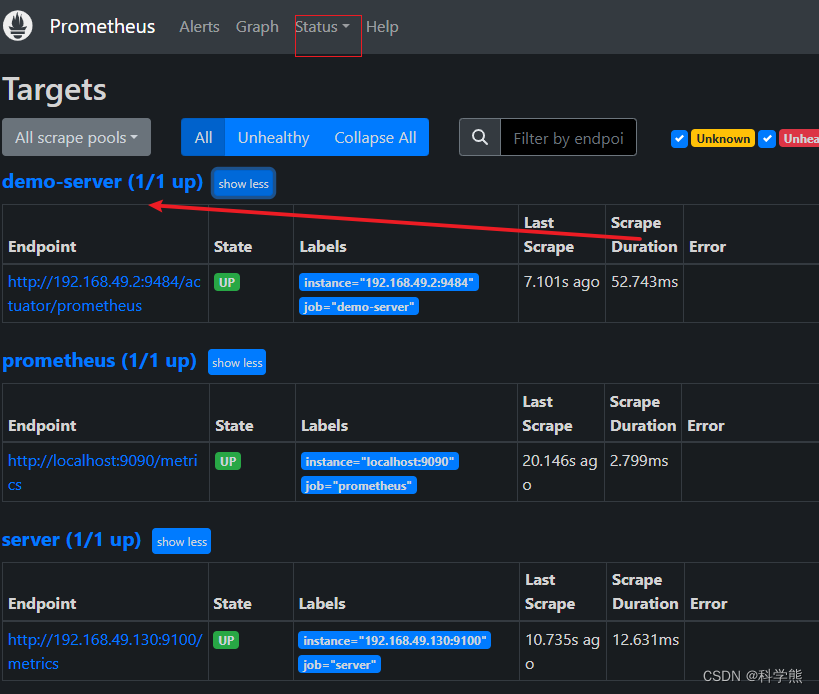
查看targets状态:
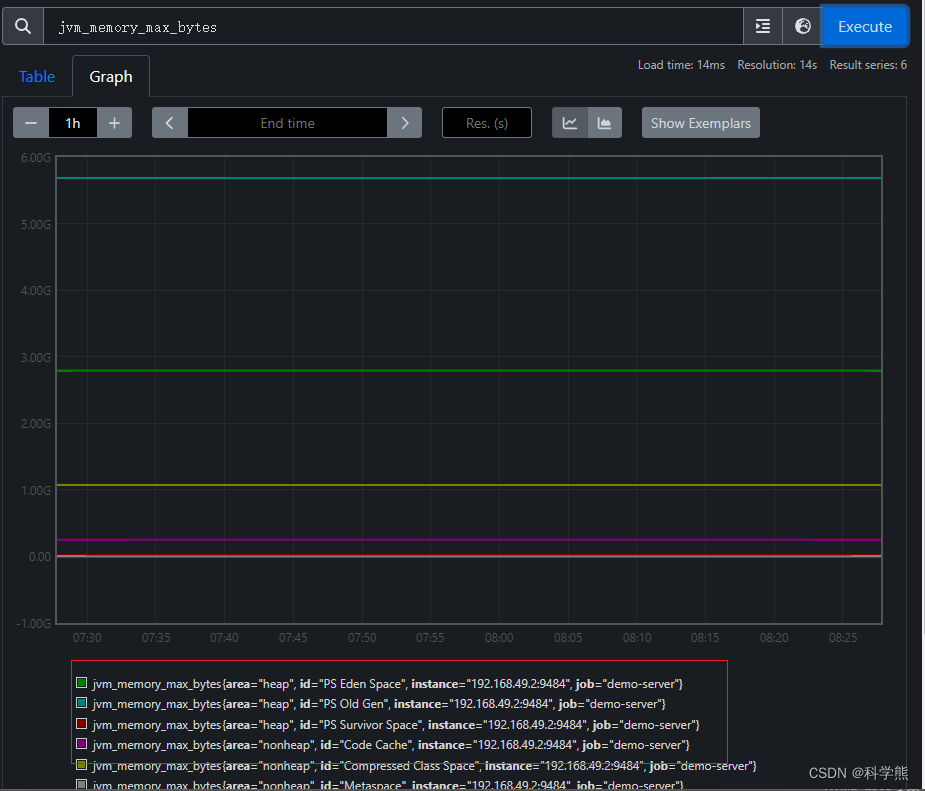
1.6 查看prometheus采集的数据
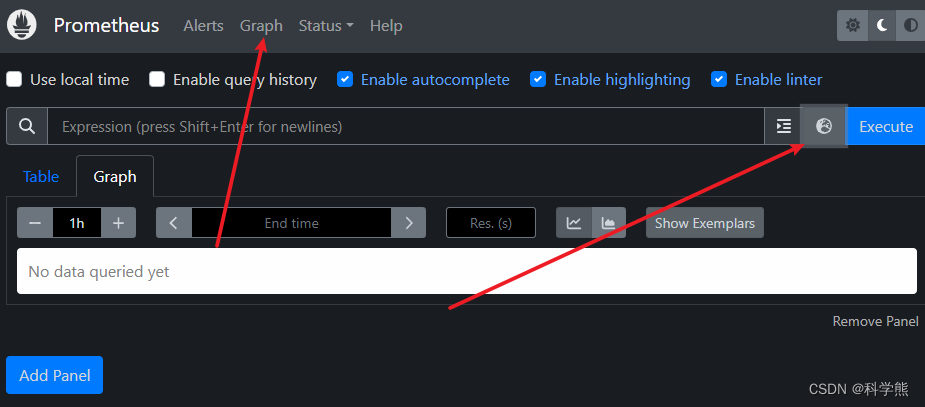
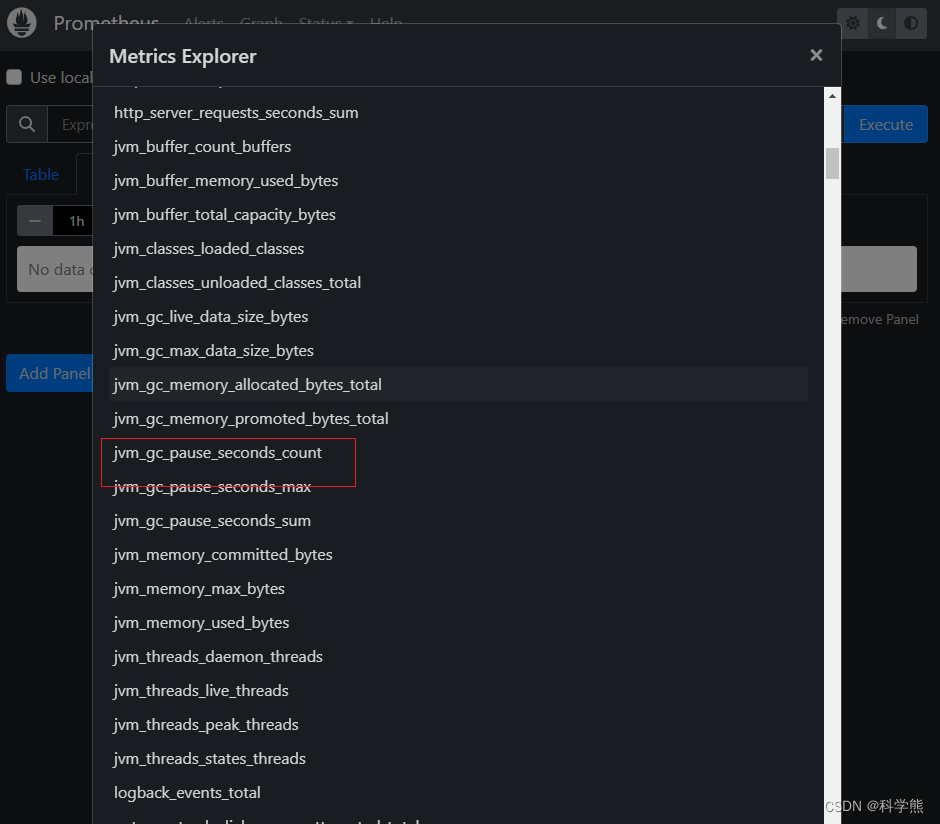
选中一个表达式,然后点击execute,便查询到对应的数据。表达式查询功能强大,更多使用参考官方文档。prometheus 表达式查询官方文档
2、部署grafana监控面板
2.1、通过docker 安装grafana
官方安装文档
docker run -d -p 3000:3000 --name grafana grafana/grafana-enterprise:8.2.0
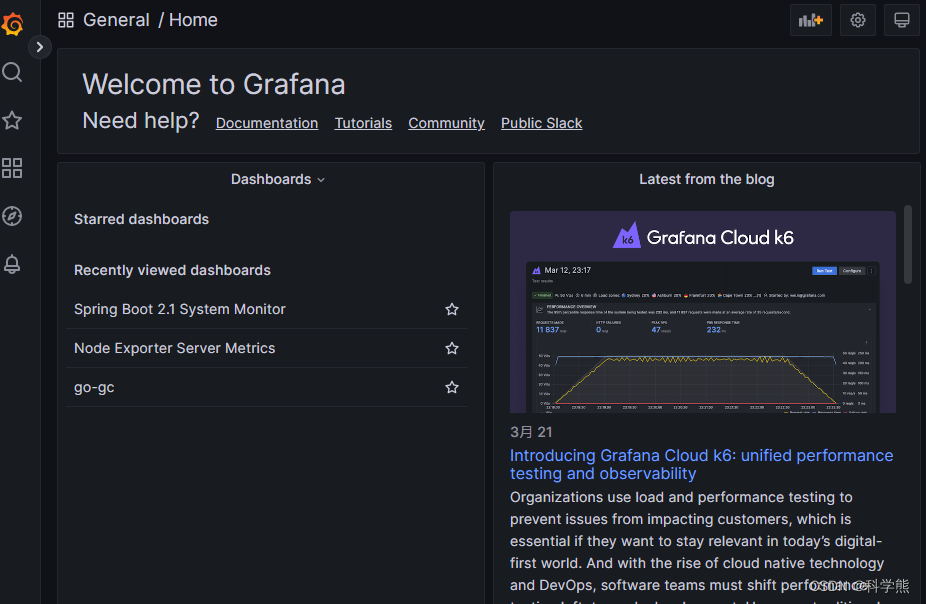
2.2、访问grafana web-ui
http://192.168.49.130:3000
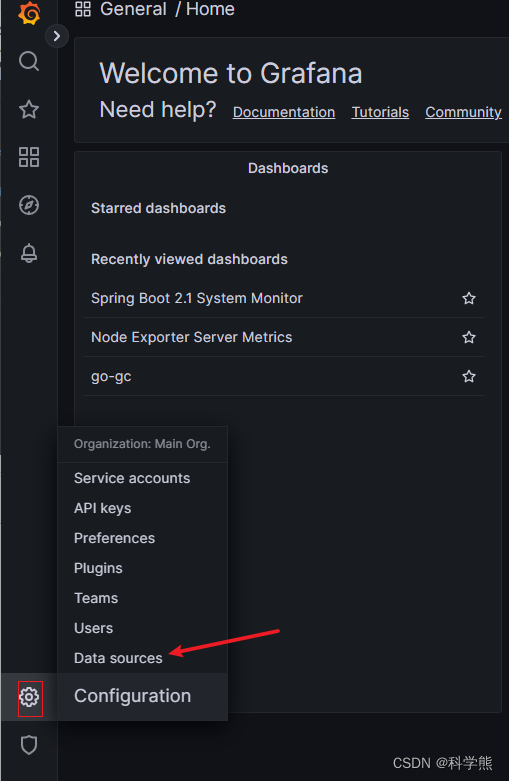
2.3、配置prometheus数据源
下面就是按图操作:
2.3.1、点击设置
2.3.2、点击add new data source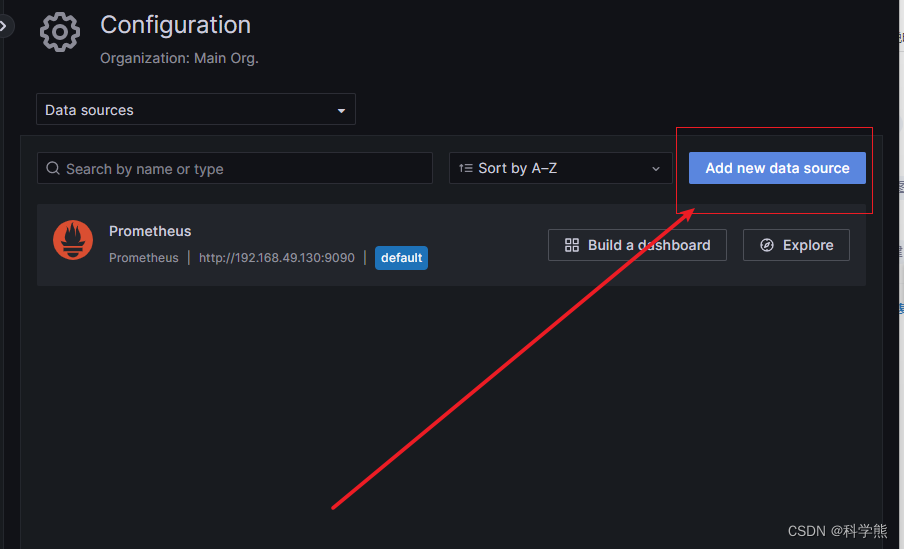
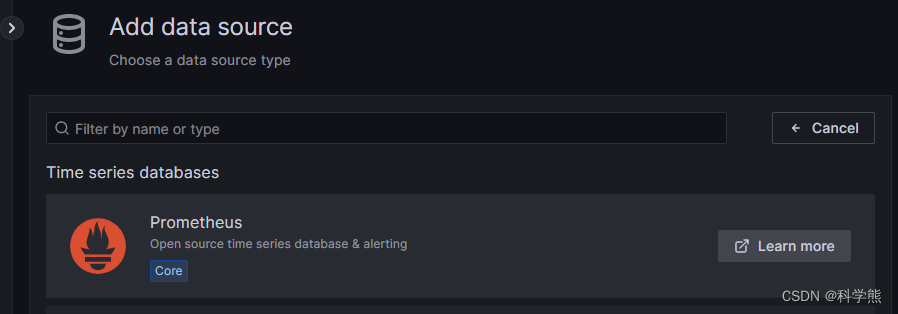
2.3.3、选择数据源类型-prometheus
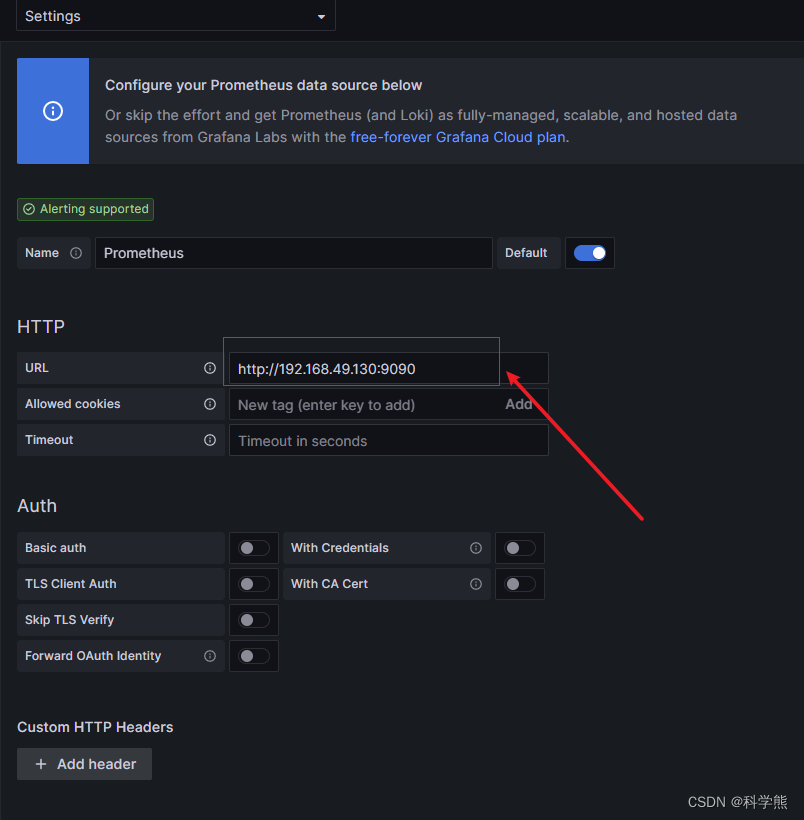
2.3.4、设置数据源地址
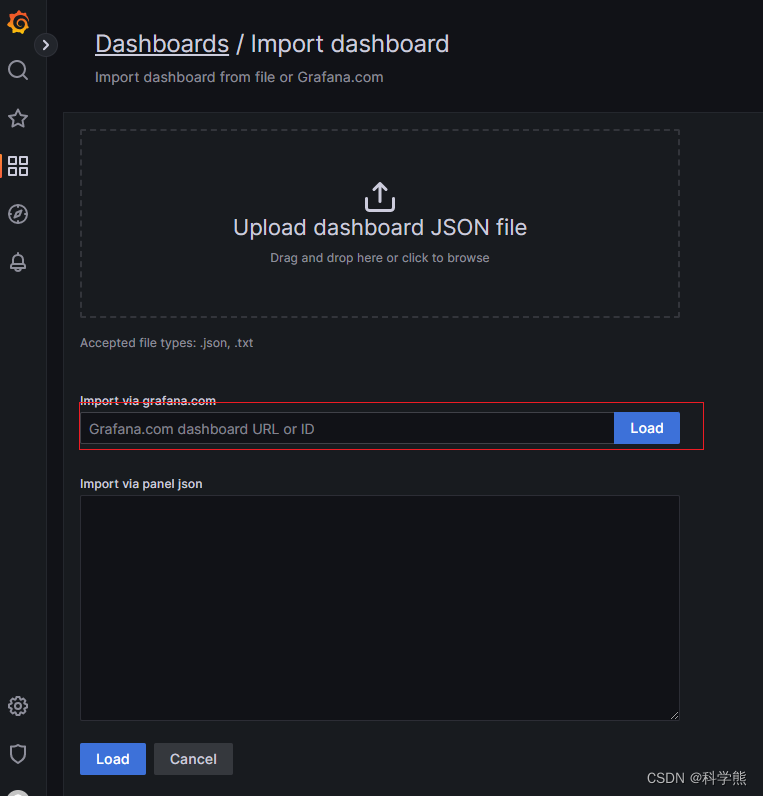
2.4、导入配置好的监控模板
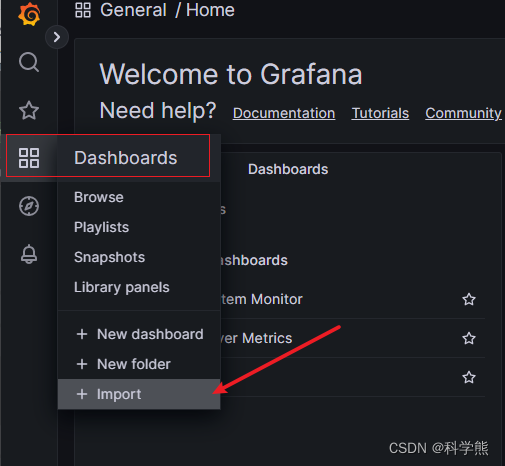
2.4.1、输入grafana官方提供的dashboard id
官方提供的dashboard网址
点击进去搜索Node Exporter Full
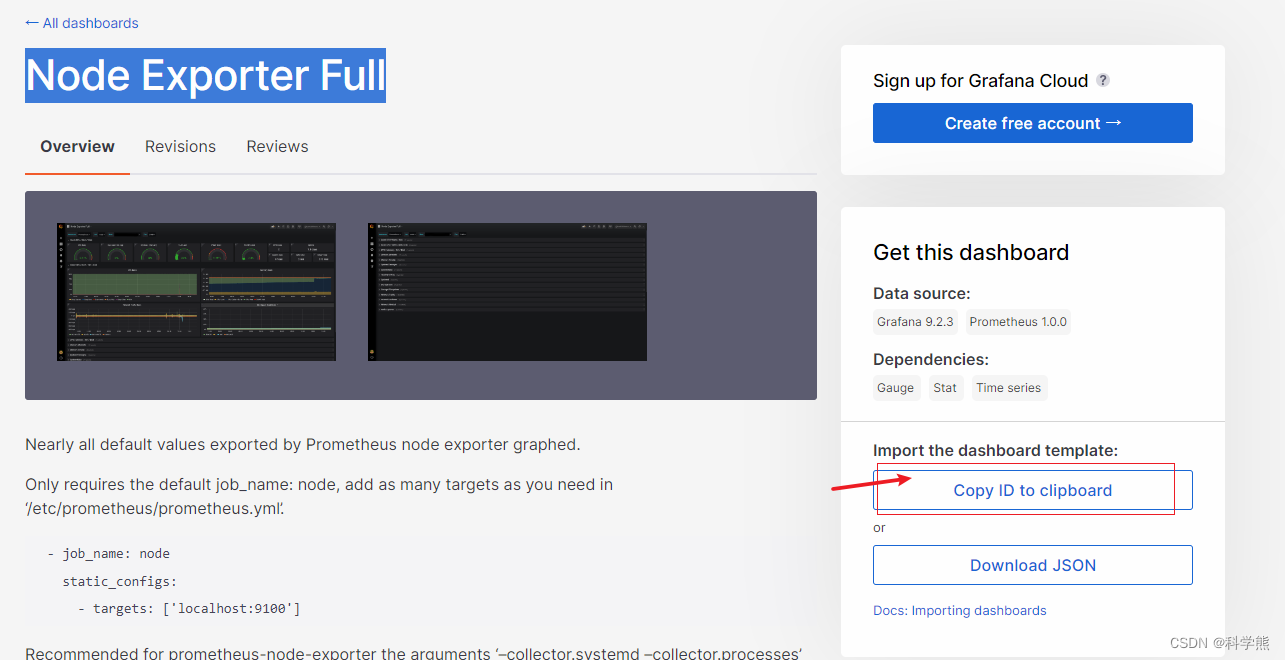
将copy到的id填到下面,然后load。
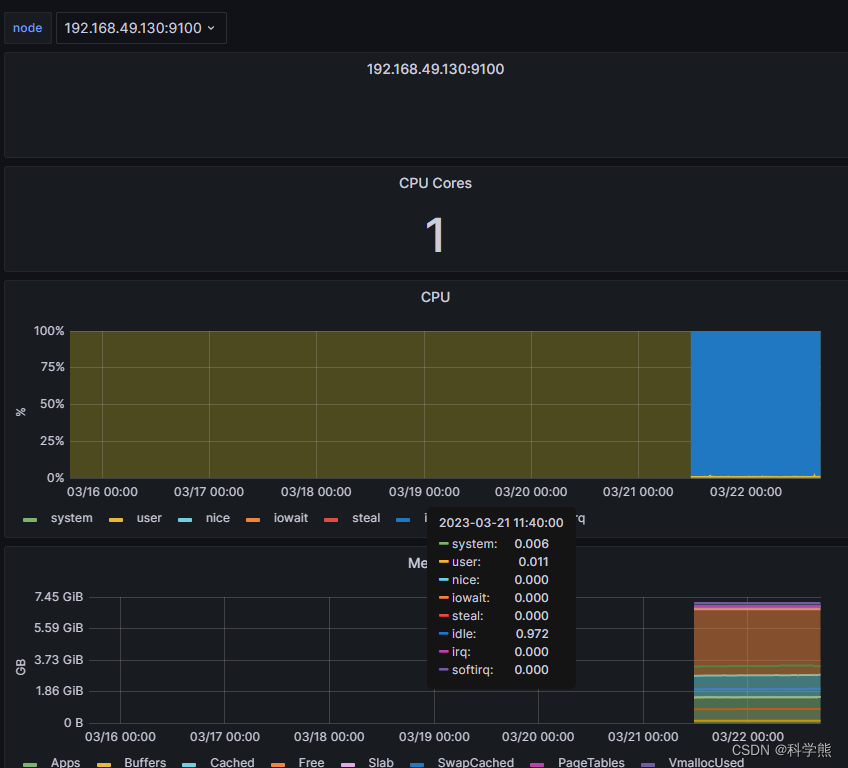
监控centos的监控界面:
3、springboot集成prometheus监控
3.1、将下面的依赖添加到pom中
 		<dependency>
            <groupId>io.micrometer</groupId>
            <artifactId>micrometer-registry-prometheus</artifactId>
            <scope>runtime</scope>
        </dependency>
         <dependency>
            <groupId>org.springframework.boot</groupId>
            <artifactId>spring-boot-starter-actuator</artifactId>
        </dependency>
配置文件中添加:
management:
  server:
    port: 9484
  endpoints:
    web:
      exposure:
        include: '*'
#        include: prometheus.metrics,health,info
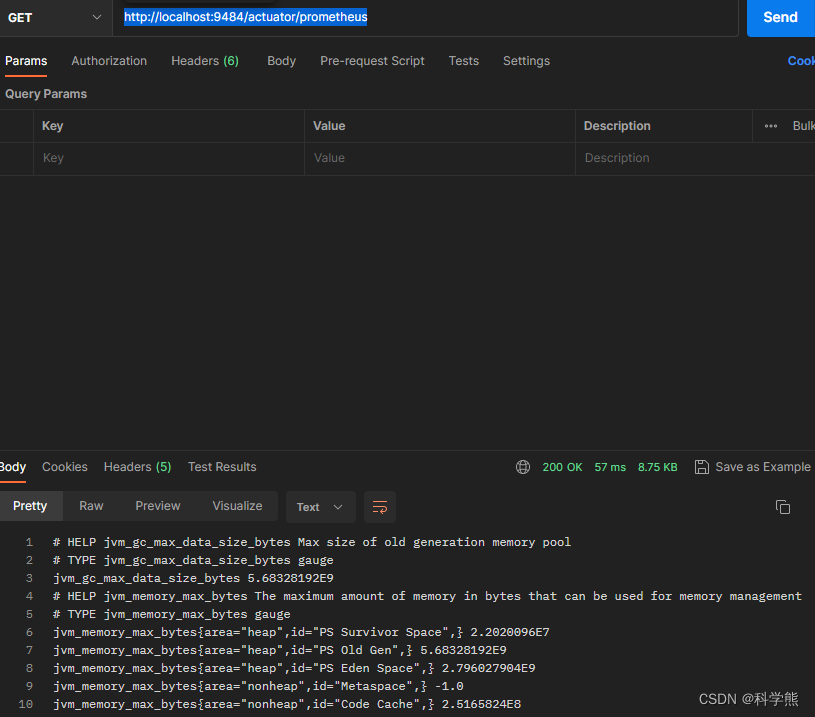
postman测试:http://localhost:9484/actuator/prometheus
3.2、设置prometheus的job
 - job_name: "demo-server"
    metrics_path: '/actuator/prometheus'
    scrape_interval: 5s
    static_configs:
      - targets: ["192.168.49.2:9484"]
热更新prometheus,执行下面的命令。
curl -X POST http://ip:9090/-/reload
查看targets状态:
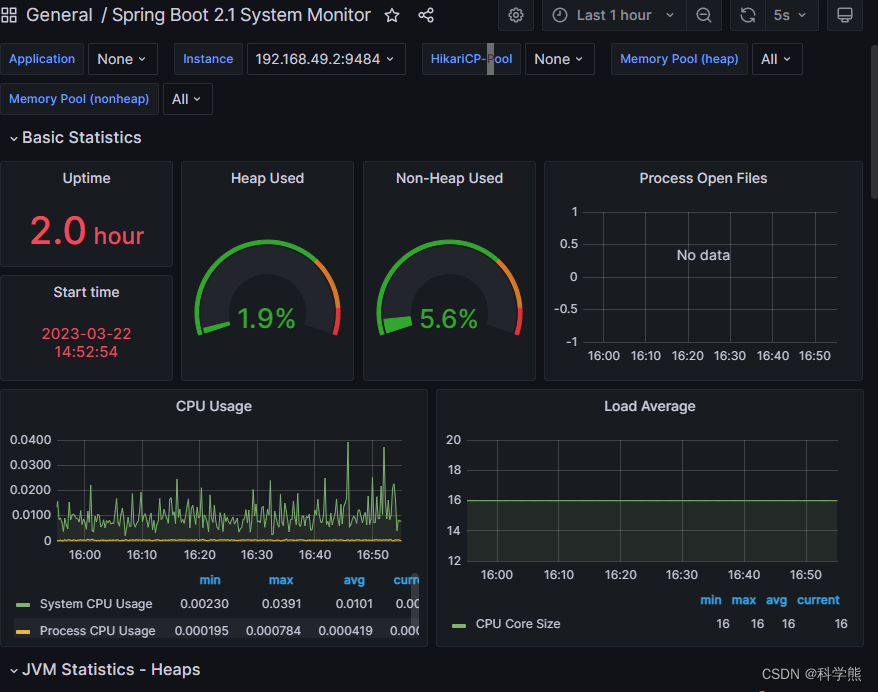
4、grafana配置promethues监控springboot应用
操作和添加监控服务器的一样。
首先去https://grafana.com/grafana/dashboards/ 去搜索,搜索micrometer,然后选择一个你中意的,copy它的id,导入监控面板。
最后的效果: