选型
通常后端应用都通过 api 接口暴露服务,通过 nginx log 监控服务有以下特点和优势
指标
应用监控使用 RED 指标,即
- requests 请求频率
- errors 错误数
- Duration 请求时延
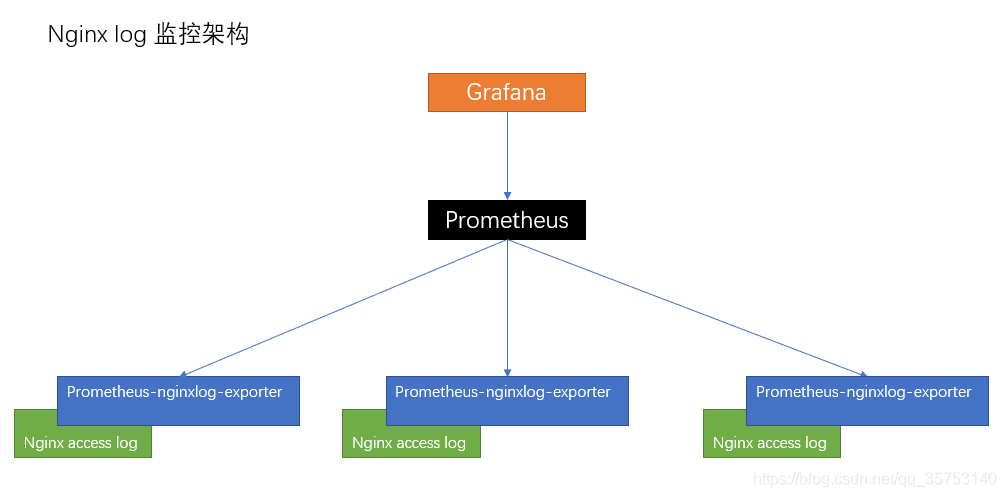
监控方案
- 使用 prometheus-nginx-exporter采集 nginx 的 access log,有三种采集方式
- 在 exporter 的配置文件中配置解析表达式解析日志文件
- Prometheus 抓取 exporter 解析转换成的指标
注意
目前 prometheus-nginx-exporter 仅支持普通文本格式的日志解析,不支持 json 格式的,通常 nginx 会配置 json 格式的日志以便输送到 es,可以额外再打印一份普通文本格式的日志用于 exporter 解析。
架构
配置
服务名为 app1,access log 存储在宿主机的 /var/logs/nginx 目录下。
- nginx 配置
log_format main   '{"@timestamp":"$time_iso8601",'
                        '"@source":"$server_addr",'
                        '"hostname":"$hostname",'
                        '"ip":"$http_x_forwarded_for",'
                        '"client":"$remote_addr",'
                        '"request_method":"$request_method",'
                        '"scheme":"$scheme",'
                        '"domain":"$server_name",'
                        '"referer":"$http_referer",'
                        '"request":"$request_uri",'
                        '"args":"$args",'
                        '"size":$body_bytes_sent,'
                        '"status": $status,'
                        '"responsetime":$request_time,'
                        '"upstreamtime":"$upstream_response_time",'
                        '"upstreamaddr":"$upstream_addr",'
                        '"http_user_agent":"$http_user_agent",'
                        '"https":"$https"'
                        '}';

    access_log  /app/logs/access.log  main;
    log_format  prometheus '[$time_local] $request_method "$request" '
                          '$body_bytes_sent $status $request_time $upstream_response_time';
- exporter daemonset 配置
apiVersion: v1
kind: ConfigMap
metadata:
  name: nginxlog-exporter-config
  namespace: monitor
data:
  config.yml: |
    namespaces:
    - name: app1
      format: '[$time_local] $request_method "$request" $body_bytes_sent $status $request_time $upstream_response_time'
      source:
        files:
          - /mnt/nginxlog/access1.log
      relabel_configs:
      - target_label: app
        from: request
        split: 2
        matches:
        - regexp: '/gateway/([a-z]+)(/.*)'
          replacement: $1
---
apiVersion: apps/v1
kind: DaemonSet
metadata:
  name: nginxlog-exporter
  namespace: monitor
  labels:
    app: nginxlog-exporter
spec:
  selector:
    matchLabels:
      name: nginxlog-exporter
  template:
    metadata:
      labels:
        name: nginxlog-exporter
    spec:
      hostNetwork: true
      containers:
      - name: nginxlog-exporter
        image: quay.io/martinhelmich/prometheus-nginxlog-exporter:v1
        imagePullPolicy: IfNotPresent
        args:
          [
            "-config-file",
            "/etc/prometheus-nginxlog-exporter/config.yml",
            "-enable-experimental",
          ]
        volumeMounts:
        - name: nginxlog-exporter-config
          mountPath: /etc/prometheus-nginxlog-exporter
        - name: container-log
          mountPath: /mnt/nginxlog
          readOnly: true
        ports:
          - name: http
            containerPort: 4040
            protocol: TCP
        readinessProbe:
          tcpSocket:
            port: 4040
          initialDelaySeconds: 5
          periodSeconds: 10
      terminationGracePeriodSeconds: 10
      volumes:
      - name: nginxlog-exporter-config
        configMap:
          name: nginxlog-exporter-config
      - name: container-log
        hostPath:
          path: /var/logs/nginx
- grafana proql
- QPS
sum by (app)(rate(app1_http_response_count_total[5m])- 一分钟内错误响应
increase(app1_http_response_count_total{status=~"4..|5.."}[1m]) > 0- 90线响应时间
app1_http_response_time_seconds{method="GET",quantile="0.9"} > 0- 一分钟内请求数量
increase(app1_http_response_count_total[1m])


