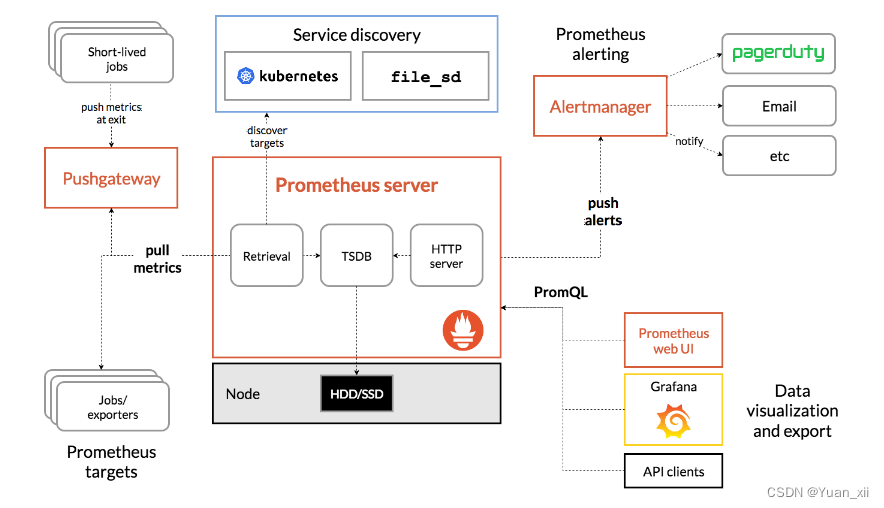
1. Prometheus简介
prometheus是一个开源的系统监控和告警工具;通过不断收集应用的指标数据到时序数据库中,实现持续监控应用的状态;
2.Prometheus特性
(1) 多维度的数据指标模型
prometheus将所有的数据以时序的方式存储;并且对于相同指标名称的任何标签组合均为对该指标的各个维度的描述;promQL允许我们过滤以及聚合这些维度的指标数据;
以"__"双下划线开头的指标名称用于内部使用
(2) PromQL, prometheus Query Language,供用于查询以及聚合时序数据;
(3) 可单机部署
(4) 默认以间隔拉取方式获取应用指标数据
(5) 支持应用主动推送指标数据
(6) 可通过静态配置或服务发现来发现应用
(7) 支持多种类型的图标和面板展示
3.部署Prometheus
prometheus_17">3.1.书写prometheus配置文件
prometheus 默认监控当前集群所有的Pod, 因此此处我们这里书写监控 namespce=default 集群下的所有Pod;
apiVersion: v1
kind: ConfigMap
metadata:
  name: prometheus-config
  namespace: monitoring
data:
  prometheus-config.yaml: |
    global:
      scrape_interval: 15s # 抓取数据的间隔
      scrape_timeout: 15s # 抓取数据的超时时间
      evaluation_interval: 1m # 评价规则的时间间隔
    scrape_configs: # 定义该抓取什么应用的指标
    - job_name: 'kubernetes-service-discovery'
      kubernetes_sd_configs:
      - role: pod
        kubeconfig_file: ""
        follow_redirects: true
        namespaces:
          names:
          - default # 监控namespace=default的集群
prometheus_deployment_41">3.2.部署prometheus deployment
创建 prometheus-monitor serviceaccount
apiVersion: v1
kind: ServiceAccount
metadata:
  namespace: monitoring
  name: prometheus-monitor
---
apiVersion: rbac.authorization.k8s.io/v1
kind: ClusterRoleBinding
metadata:
  name: rolebindingpromethuesmonitoradminpermission
subjects:
- kind: ServiceAccount
  name: prometheus-monitor
  namespace: monitoring
roleRef:
  kind: ClusterRole
  name: cluster-admin
  apiGroup: rbac.authorization.k8s.io
部署deployment
apiVersion: apps/v1
kind: Deployment
metadata:
  name: prometheus-server
  namespace: monitoring
  labels:
    app: prometheus-server
spec:
  replicas: 1
  selector:
    matchLabels:
      app: prometheus-server
      component: prometheus-server
  template:
    metadata:
      labels:
        app: prometheus-server
        component: prometheus-server
      annotations:
        prometheus.io/scrape: "false"
    spec:
     # serviceAccountName: prometheus-monitor
      securityContext:
        runAsUser: 0
      containers:
      - name: prometheus-server
        image:  prom/prometheus
        imagePullPolicy: IfNotPresent
        command:
          - prometheus
          - --config.file=/etc/prometheus/prometheus-config.yaml
          - --storage.tsdb.path=/prometheus
          - --storage.tsdb.retention=720h
        ports:
        - containerPort: 9090
          protocol: TCP
        volumeMounts:
        - mountPath: /etc/prometheus/
          name: prometheus-config
        - mountPath: /prometheus/
          name: prometheus-storage-volume
      volumes:
      - name: prometheus-config
        configMap:
          name: prometheus-config
      - name: prometheus-storage-volume
        persistentVolumeClaim:
          claimName: prometheus-storage-pvc
---
apiVersion: v1
kind: PersistentVolumeClaim
metadata:
  name: prometheus-storage-pvc
  namespace: monitoring
spec:
  accessModes:
  - ReadWriteOnce
  storageClassName: nfs-client
  resources:
    requests:
      storage: 5Gi
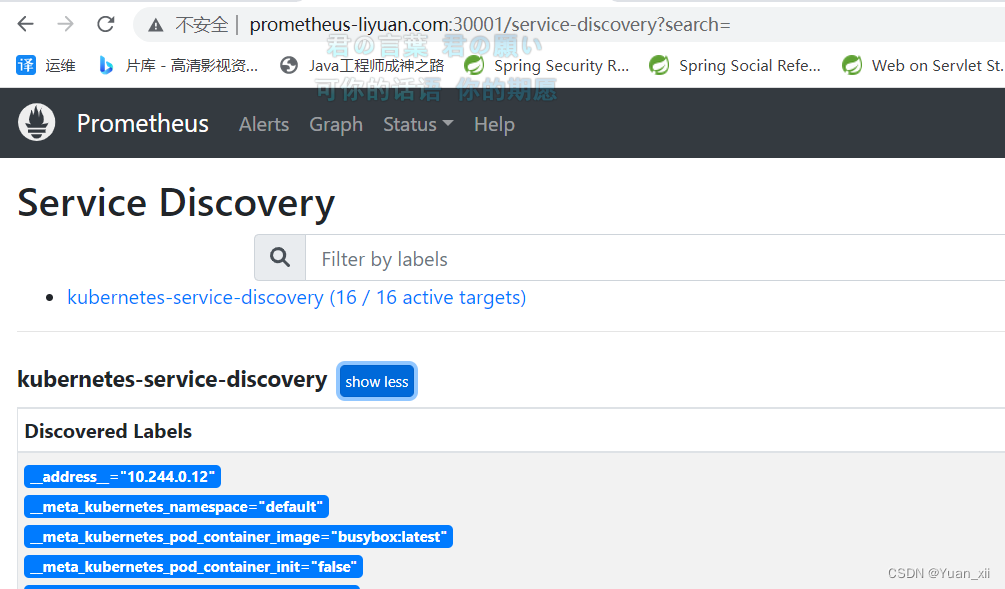
3.3.暴露Prometheus
对于如何配置ingress,请参考 运维开发实践 - Kubernetes - 从外部访问集群应用
---
apiVersion: v1
kind: Service
metadata:
  name: prometheus-server-svc
  namespace: monitoring
spec:
  ports:
  - port: 9090
    targetPort: 9090
  selector:
    app: prometheus-server
---
apiVersion: networking.k8s.io/v1
kind: Ingress
metadata:
  name: prometheus-ingress
  namespace: monitoring
spec:
  ingressClassName: nginx
  rules:
  - host: prometheus-liyuan.com
    http:
      paths:
      - path: /
        pathType: Prefix
        backend:
          service:
            name: prometheus-server-svc
            port:
              number: 9090
Reference
Promrthues Docs
遇到疑问欢迎留言,也欢迎关注我的公众号[ 从零开始的Go学习 ]