服务端搭建
https://blog.csdn.net/qq_37598011/article/details/101105086
pushgateway安装及其使用
https://prometheus.io/download/

wget https://github.com/prometheus/pushgateway/releases/download/v1.0.0/pushgateway-1.0.0.linux-amd64.tar.gz
tar -zxvf pushgateway-1.0.0.linux-amd64.tar.gz
cd pushgateway-1.0.0.linux-amd64/
./pushgateway于此同时需要修改Prometheus的配置文件
cd /usr/local/prometheus
vim prometheus.yml
- job_name: pushgateway
static_configs:
- targets: ['localhost:9091']
labels:
instance: pushgateway
重启
./prometheus
访问:http://localhost:9090/targets

访问:http://localhost:9091/#

测试(对于传过去的监控项会添加此处定义的标签 job=test instance=192.168.78.133 hostname=ip-192.168.78.133)
curl 127.0.0.1:9100/metrics|curl --data-binary @- http://127.0.0.1:9091/metrics/job/test/instance/192.168.78.133/hostname/ip-192.168.78.133


使用客户端库:https://prometheus.io/docs/instrumenting/clientlibs/
Alertmanager安装及其使用
Alertmanager安装
https://prometheus.io/download/

wget https://github.com/prometheus/alertmanager/releases/download/v0.20.0-rc.0/alertmanager-0.20.0-rc.0.linux-amd64.tar.gz
tar -zxvf alertmanager-0.20.0-rc.0.linux-amd64.tar.gz
mv alertmanager-0.20.0-rc.0.linux-amd64 /usr/local/alertmanager修改配置文件
cd /usr/local/alertmanager/
vim alertmanager.ymlglobal:
resolve_timeout: 5m #处理超时时间,默认为5min
smtp_smarthost: 'smtp.qq.com:25' # 邮箱smtp服务器代理
smtp_from: 'xxxxxxxx@QQ.com' # 发送邮箱名称
smtp_auth_username: 'xxxxxxxx@QQ.com' # 邮箱名称
smtp_auth_password: 'xxxxxxxx' # 授权码
smtp_require_tls: false
templates:
- 'template/*.tmpl'
route:
group_by: ['alertname'] #报警分组依据
group_wait: 10s #最初即第一次等待多久时间发送一组警报的通知
group_interval: 10m # 在发送新警报前的等待时间
repeat_interval: 1h # 发送重复警报的周期 对于email配置中,此项不可以设置过低,>否则将会由于邮件发送太多频繁,被smtp服务器拒绝
receiver: 'email' # 发送警报的接收者的名称,以下receivers name的名称
receivers:
- name: 'email'
email_configs: # 邮箱配置
- to: 'xxxxxxxx@QQ.com' # 接收警报的email配置
headers: { Subject: "[WARN] 报警邮件"} # 接收邮件的标题
send_resolved: true
webhook_configs:
- url: 'http://127.0.0.1:5001/'
inhibit_rules:
- source_match:
severity: 'critical'
target_match:
severity: 'warning'
equal: ['alertname', 'dev', 'instance']
创建模板文件
mkdir template
cd template
vim test.tmpl{{ define "test.html" }}
<table border="1">
<tr>
<td>报警项</td>
<td>实例</td>
<td>报警阀值</td>
<td>开始时间</td>
</tr>
{{ range $i, $alert := .Alerts }}
<tr>
<td>{{ index $alert.Labels "alertname" }}</td>
<td>{{ index $alert.Labels "instance" }}</td>
<td>{{ index $alert.Annotations "value" }}</td>
<td>{{ $alert.StartsAt }}</td>
</tr>
{{ end }}
</table>
{{ end }}
检测
cd ..
./amtool check-config alertmanager.yml 
Alertmanager启动!!!!
./alertmanager 修改Prometheus
创建Alertmanager规则
cd /usr/local/prometheus这里我举例服务掉线的情况
vim alertmanager_rules.yml groups:
- name: test-rules
rules:
- alert: InstanceDown # 告警名称
expr: up == 0 # 告警的判定条件,参考Prometheus高级查询来设定
for: 2m # 满足告警条件持续时间多久后,才会发送告警
labels: #标签项
team: node
annotations: # 解析项,详细解释告警信息
summary: "{{$labels.instance}}: has been down"
description: "{{$labels.instance}}: job {{$labels.job}} has been down "
value: "{{$value}}"
修改Prometheus.yml
vim prometheus.yml# my global config
global:
scrape_interval: 15s # Set the scrape interval to every 15 seconds. Default is every 1 minute.
evaluation_interval: 15s # Evaluate rules every 15 seconds. The default is every 1 minute.
# scrape_timeout is set to the global default (10s).
# Alertmanager configuration
alerting:
alertmanagers:
- static_configs:
- targets: ["localhost:9093"]
# Load rules once and periodically evaluate them according to the global 'evaluation_interval'.
rule_files:
- "alertmanager_rules.yml"
# - "first_rules.yml"
# - "second_rules.yml"
# A scrape configuration containing exactly one endpoint to scrape:
# Here it's Prometheus itself.
scrape_configs:
# The job name is added as a label `job=<job_name>` to any timeseries scraped from this config.
- job_name: 'prometheus'
# metrics_path defaults to '/metrics'
# scheme defaults to 'http'.
static_configs:
- targets: ['localhost:9090']
- job_name: 'server'
static_configs:
- targets: ['localhost:9100']
  - job_name: pushgateway
    static_configs:
      - targets: ['localhost:9091']
        labels:
          instance: pushgateway
检测
./promtool check config prometheus.yml
./prometheusOK启动!!!

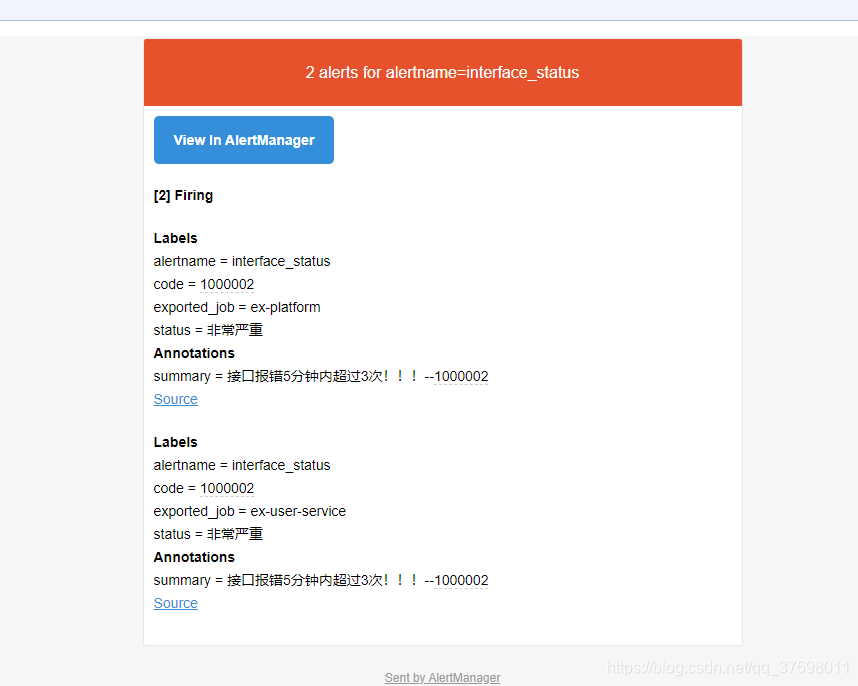
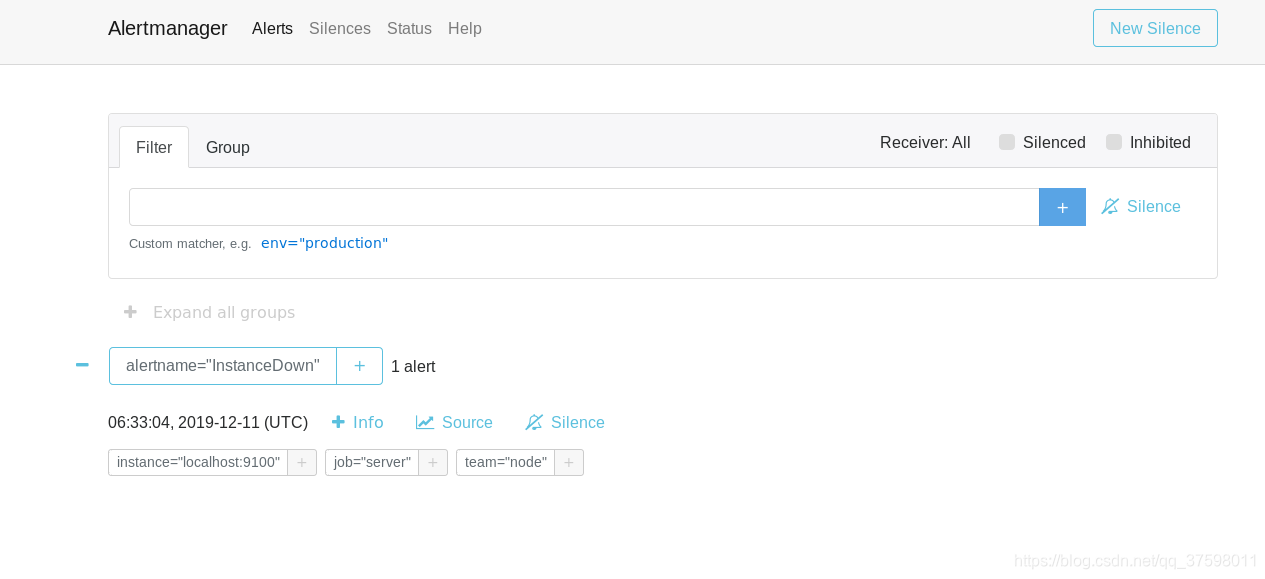
测试
停止node_exporter


例子:针对磁盘CPU、IO、磁盘使用、内存使用、TCP、网络流量监控告警
groups:
    - name: 主机状态-监控告警
      rules:
      - alert: 主机状态
        expr: up == 0
        for: 5m
        labels:
          status: 非常严重
        annotations:
          summary: "{{$labels.instance}}:服务器宕机"
          description: "{{$labels.instance}}:服务器延时超过5分钟"

      - alert: CPU使用情况
        expr: 100-(avg(irate(node_cpu_seconds_total{mode="idle"}[5m])) by(instance)* 100) > 80
        for: 1m
        labels:
          status: 一般告警
        annotations:
          summary: "{{$labels.mountpoint}} CPU使用率过高!"
          description: "{{$labels.mountpoint }} CPU使用大于80%(目前使用:{{$value}}%)"
      - alert: 内存使用
        expr: 100 -(node_memory_MemFree_bytes+node_memory_Buffers_bytes+node_memory_Cached_bytes ) / node_memory_MemTotal_bytes * 100> 80
        for: 1m
        labels:
          status: 严重告警
        annotations:
          summary: "{{$labels.mountpoint}} 内存使用率过高!"
          description: "{{$labels.mountpoint }} 内存使用大于80%(目前使用:{{$value}}%)"
      - alert: IO性能
        expr: (avg(irate(node_disk_io_time_seconds_total[1m])) by(instance)* 100) > 80
        for: 1m
        labels:
          status: 严重告警
        annotations:
          summary: "{{$labels.mountpoint}} 流入磁盘IO使用率过高!"
          description: "{{$labels.mountpoint }} 流入磁盘IO大于80%(目前使用:{{$value}})"

      - alert: 网络
        expr: ((sum(rate (node_network_receive_bytes_total{device!~'tap.*|veth.*|br.*|docker.*|virbr*|lo*'}[5m])) by (instance)) / 100) > 102400
        for: 1m
        labels:
          status: 严重告警
        annotations:
          summary: "{{$labels.mountpoint}} 流入网络带宽过高!"
          description: "{{$labels.mountpoint }}流入网络带宽持续2分钟高于100M. RX带宽使用率{{$value}}"

      - alert: 网络
        expr: ((sum(rate (node_network_transmit_bytes_total{device!~'tap.*|veth.*|br.*|docker.*|virbr*|lo*'}[5m])) by (instance)) / 100) > 102400
        for: 1m
        labels:
          status: 严重告警
        annotations:
          summary: "{{$labels.mountpoint}} 流出网络带宽过高!"
          description: "{{$labels.mountpoint }}流出网络带宽持续2分钟高于100M. RX带宽使用率{{$value}}"

      - alert: TCP会话
        expr: node_netstat_Tcp_CurrEstab > 1000
        for: 1m
        labels:
          status: 严重告警
        annotations:
          summary: "{{$labels.mountpoint}} TCP_ESTABLISHED过高!"
          description: "{{$labels.mountpoint }} TCP_ESTABLISHED大于1000%(目前使用:{{$value}}%)"

      - alert: 磁盘容量
        expr: 100-(node_filesystem_free_bytes{fstype=~"ext4|xfs"}/node_filesystem_size_bytes {fstype=~"ext4|xfs"}*100) > 80
        for: 1m
        labels:
          status: 严重告警
        annotations:
          summary: "{{$labels.mountpoint}} 磁盘分区使用率过高!"
          description: "{{$labels.mountpoint }} 磁盘分区使用大于80%(目前使用:{{$value}}%)"
妈妈再也不用担心我的服务器???