目录
一、部署Prometheus
1、环境准备工作
2、普罗米修斯的部署
prometheus-2.37.0.linux-amd64.tar.gz%20%E5%88%B0%20%2Fopt%20%E7%9B%AE%E5%BD%95%E4%B8%AD%EF%BC%8C%E5%B9%B6%E8%A7%A3%E5%8E%8B%EF%BC%88128%EF%BC%89-toc" style="margin-left:80px;">2.1 上传 prometheus-2.37.0.linux-amd64.tar.gz 到 /opt 目录中,并解压(128)
2.2 修改配置文件
2.3 配置系统启动文件,设置开机自启
prometheus%2C%E5%B9%B6%E8%AE%BF%E9%97%AE%E7%BD%91%E9%A1%B5%E9%AA%8C%E8%AF%81-toc" style="margin-left:80px;">2.4 开启prometheus,并访问网页验证
二、部署Exporters(192.168.239.130)
1、监控远程Linux主机(192.168.239.130)
2、监控远程MySQL
mysqld_exporter%E7%BB%84%E4%BB%B6-toc" style="margin-left:80px;">2.1 下载mysqld_exporter组件
2.2解压安装
2.3 安装mariadb数据库,并授权
2.4 创建一个mariadb配置文件
2.6 修改Prometheus服务器的配置文件
prometheus%E6%9C%8D%E5%8A%A1%E5%99%A8-toc" style="margin-left:80px;">2.7 访问prometheus服务器
三、部署Grafana进行展示
1、下载安装Grafana(192.168.239.129)
2、配置数据源
3、导入模板
4、为数据源做数据展示
5.配置告警平台
6、Grafana 图形显示 MySQL 监控数据
7、Grafana+onealert报警

一、部署Prometheus
1、环境准备工作
服务器类型 IP地址 组件
Prometheus服务器 192.168.239.128 Prometheus、node_exporter
grafana服务器 192.168.239.129 Grafana
agent服务器 192.168.239.130 node_exporter
2、普罗米修斯的部署
Download | Prometheus
以上是普罗米修斯下载地址
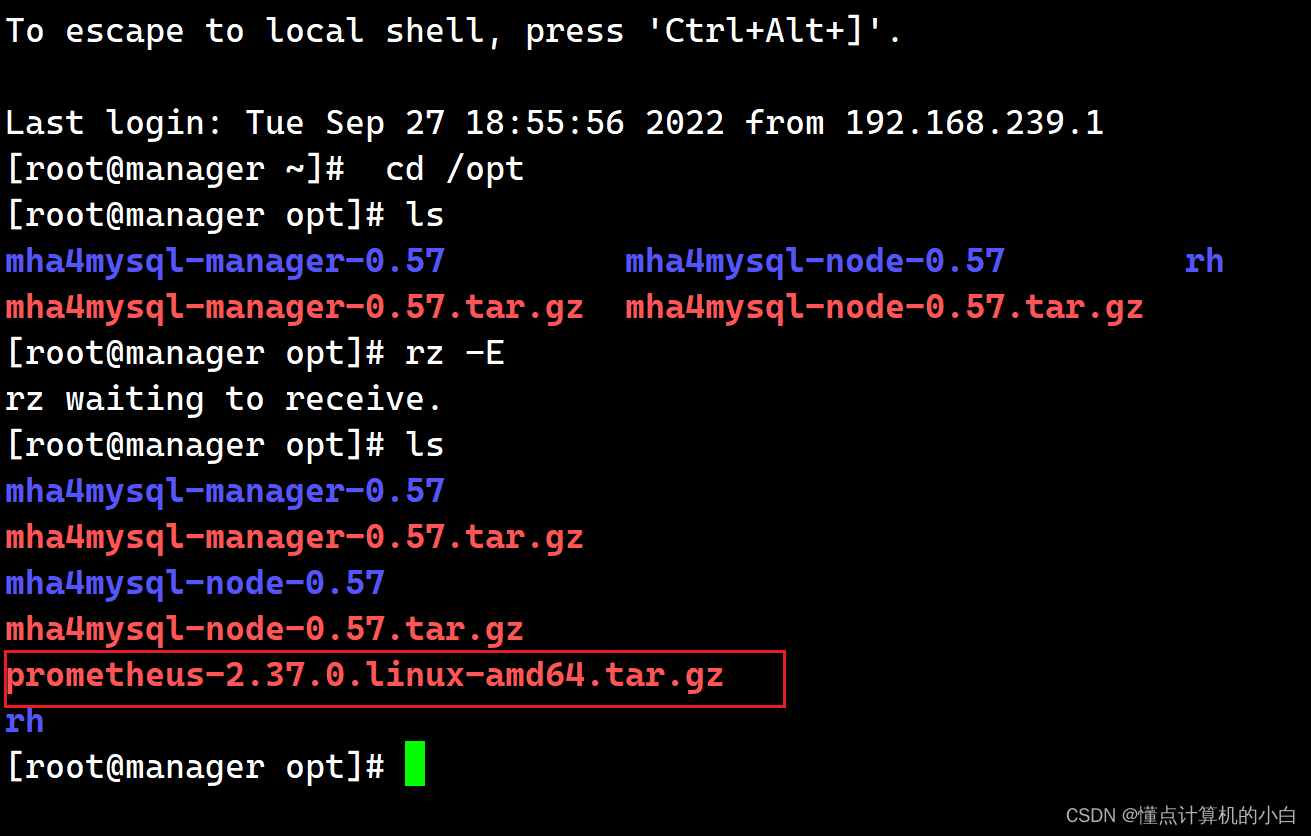
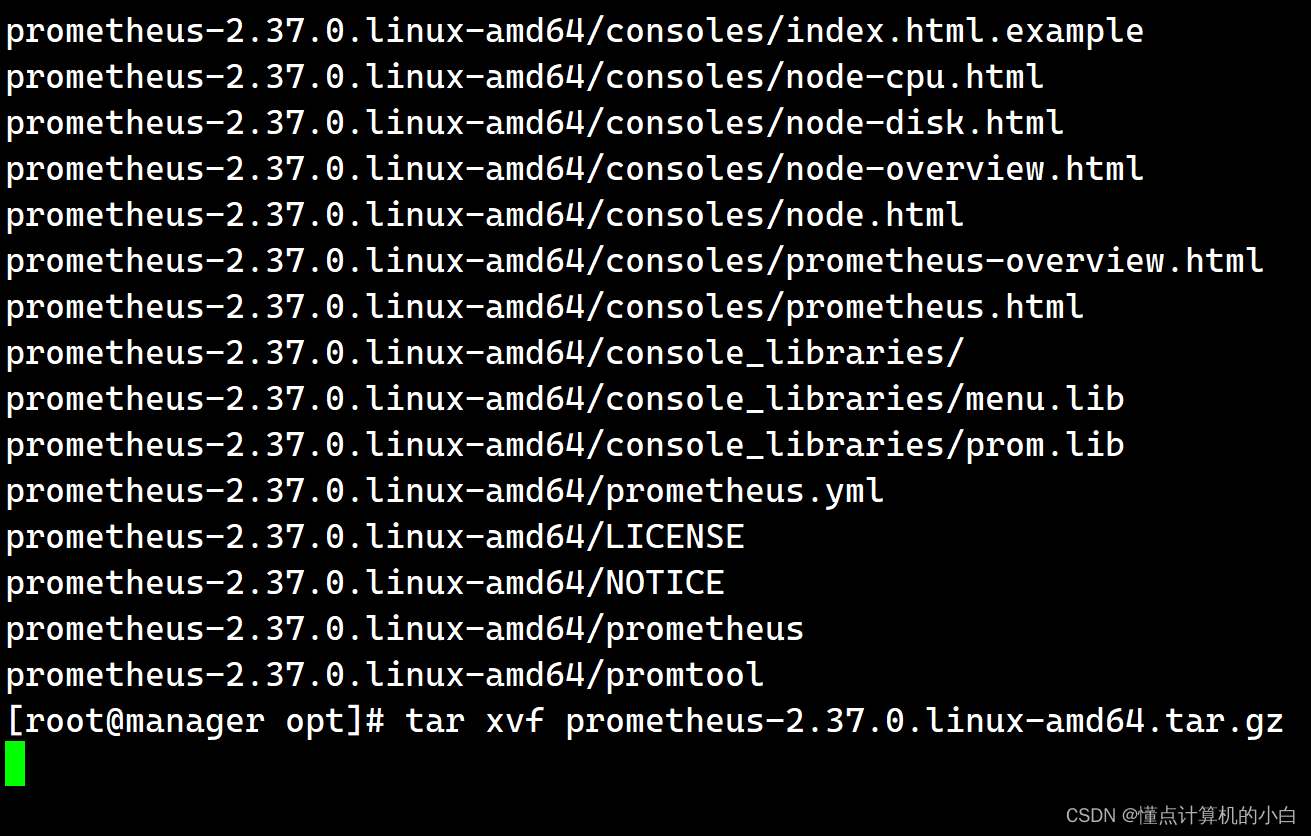
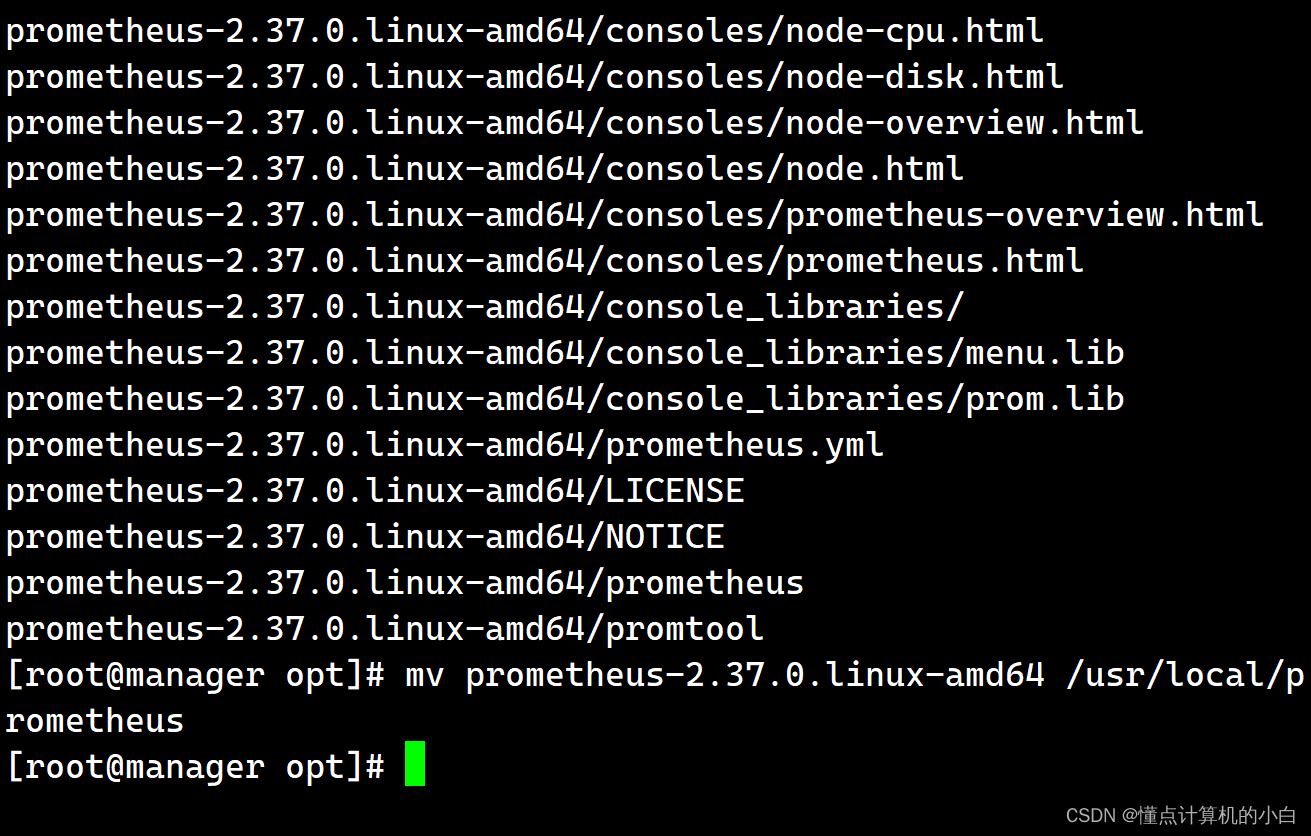
prometheus-2.37.0.linux-amd64.tar.gz%20%E5%88%B0%20%2Fopt%20%E7%9B%AE%E5%BD%95%E4%B8%AD%EF%BC%8C%E5%B9%B6%E8%A7%A3%E5%8E%8B%EF%BC%88128%EF%BC%89" style="margin-left:0px;text-align:justify;">2.1 上传 prometheus-2.37.0.linux-amd64.tar.gz 到 /opt 目录中,并解压(128)

2.2 修改配置文件
cat /usr/local/prometheus/prometheus.yml | grep -v "^#"

global:                                #用于prometheus的全局配置,比如采集间隔,抓取超时时间等

  scrape_interval: 15s                #采集目标主机监控数据的时间间隔,默认为1m

  evaluation_interval: 15s          #触发告警生成alert的时间间隔,默认是1m

  # scrape_timeout is set to the global default (10s).

  scrape_timeout: 10s                #数据采集超时时间,默认10s


alerting:                       #用于alertmanager实例的配置,支持静态配置和动态服务发现的机制

  alertmanagers:

    - static_configs:

        - targets:

          # - alertmanager:9093


rule_files:                     #用于加载告警规则相关的文件路径的配置,可以使用文件名通配机制

  # - "first_rules.yml"

  # - "second_rules.yml"


scrape_configs:                   #用于采集时序数据源的配置

  # The job name is added as a label `job=<job_name>` to any timeseries scraped from this config.

  - job_name: "prometheus"            #每个被监控实例的集合用job_name命名,支持静态配置(static_configs)和动态服务发现的机制(*_sd_configs)


    # metrics_path defaults to '/metrics'

    # scheme defaults to 'http'.


    static_configs:                     #静态目标配置,固定从某个target拉取数据

      - targets: ["localhost:9090"]
cat /usr/local/prometheus/prometheus.yml | grep -v "^#"
global: #用于prometheus的全局配置,比如采集间隔,抓取超时时间等
scrape_interval: 15s #采集目标主机监控数据的时间间隔,默认为1m
evaluation_interval: 15s #触发告警生成alert的时间间隔,默认是1m
# scrape_timeout is set to the global default (10s).
scrape_timeout: 10s #数据采集超时时间,默认10s
alerting: #用于alertmanager实例的配置,支持静态配置和动态服务发现的机制
alertmanagers:
- static_configs:
- targets:
# - alertmanager:9093
rule_files: #用于加载告警规则相关的文件路径的配置,可以使用文件名通配机制
# - "first_rules.yml"
# - "second_rules.yml"
scrape_configs: #用于采集时序数据源的配置
# The job name is added as a label `job=<job_name>` to any timeseries scraped from this config.
- job_name: "prometheus" #每个被监控实例的集合用job_name命名,支持静态配置(static_configs)和动态服务发现的机制(*_sd_configs)
# metrics_path defaults to '/metrics'
# scheme defaults to 'http'.
static_configs: #静态目标配置,固定从某个target拉取数据
- targets: ["localhost:9090"]

2.3 配置系统启动文件,设置开机自启
vim /usr/lib/systemd/system/prometheus.service


[Unit]

Description=Prometheus Server

Documentation=https://prometheus.io

After=network.target


[Service]

Type=simple

ExecStart=/usr/local/prometheus/prometheus \

--config.file=/usr/local/prometheus/prometheus.yml \

--storage.tsdb.path=/usr/local/prometheus/data/ \

--storage.tsdb.retention=15d \

--web.enable-lifecycle


ExecReload=/bin/kill -HUP $MAINPID

Restart=on-failure


[Install]

WantedBy=multi-user.target
vim /usr/lib/systemd/system/prometheus.service
[Unit]
Description=Prometheus Server
Documentation=https://prometheus.io
After=network.target
[Service]
Type=simple
ExecStart=/usr/local/prometheus/prometheus \
--config.file=/usr/local/prometheus/prometheus.yml \
--storage.tsdb.path=/usr/local/prometheus/data/ \
--storage.tsdb.retention=15d \
--web.enable-lifecycle
ExecReload=/bin/kill -HUP $MAINPID
Restart=on-failure
[Install]
WantedBy=multi-user.target

prometheus%2C%E5%B9%B6%E8%AE%BF%E9%97%AE%E7%BD%91%E9%A1%B5%E9%AA%8C%E8%AF%81" style="margin-left:0px;text-align:justify;">2.4 开启prometheus,并访问网页验证
systemctl start prometheus
systemctl enable prometheus
netstat -natp | grep :9090
浏览器访问:http://192.168.239.128:9090 ,访问到 Prometheus 的 Web UI 界面
点击页面的 Status -> Targets,如看到 Target 状态都为 UP,说明 Prometheus 能正常采集到数据
http://192.168.239.128:9090/metrics ,可以看到 Prometheus 采集到自己的指标数据


查看自己的指标数据

二、部署Exporters(192.168.239.130)
1、监控远程Linux主机(192.168.239.130)
在远程linux主机及agent上安装node_export组件
下载地址
https://prometheus.io/download/
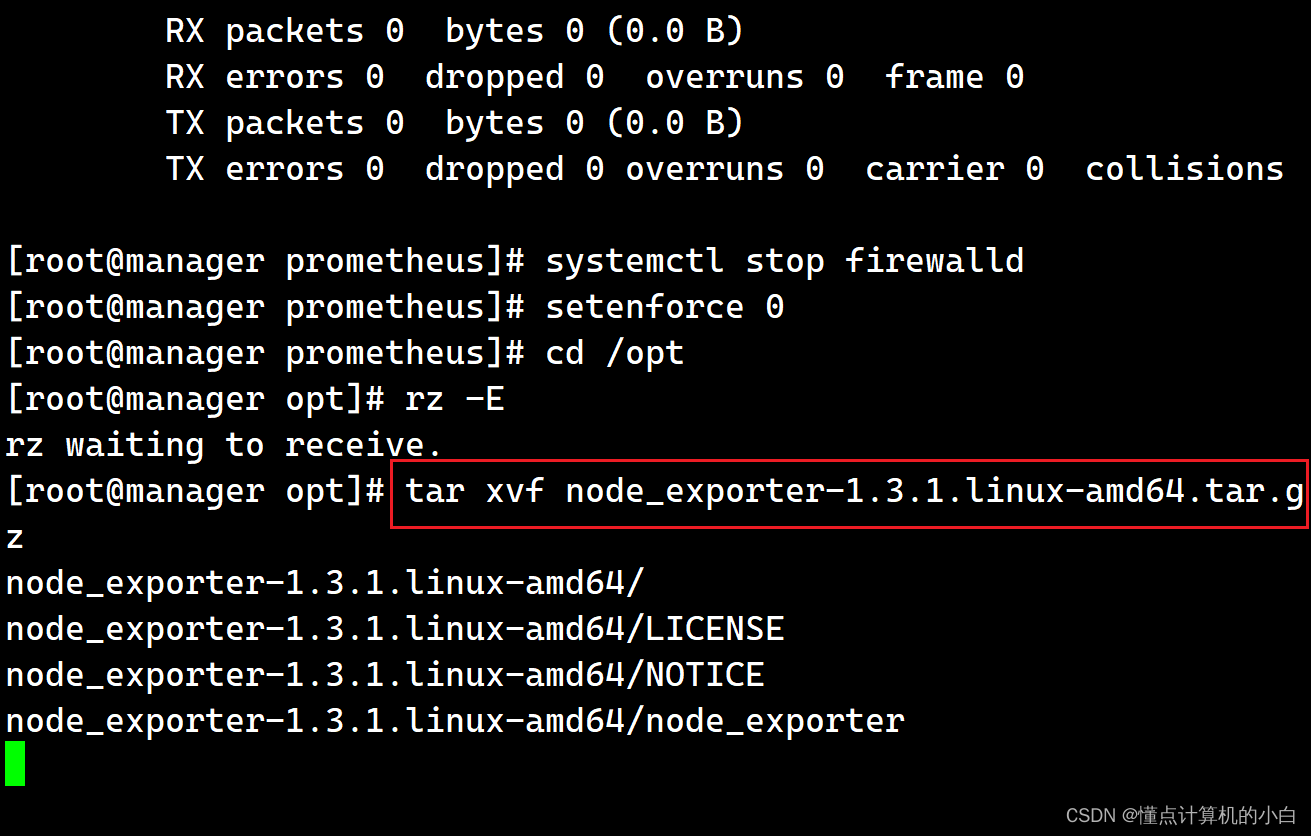
1.1 上传 node_exporter-1.3.1.linux-amd64.tar.gz 到 /opt 目录中,并解压
cd /opt/
tar xf node_exporter-1.3.1.linux-amd64.tar.gz
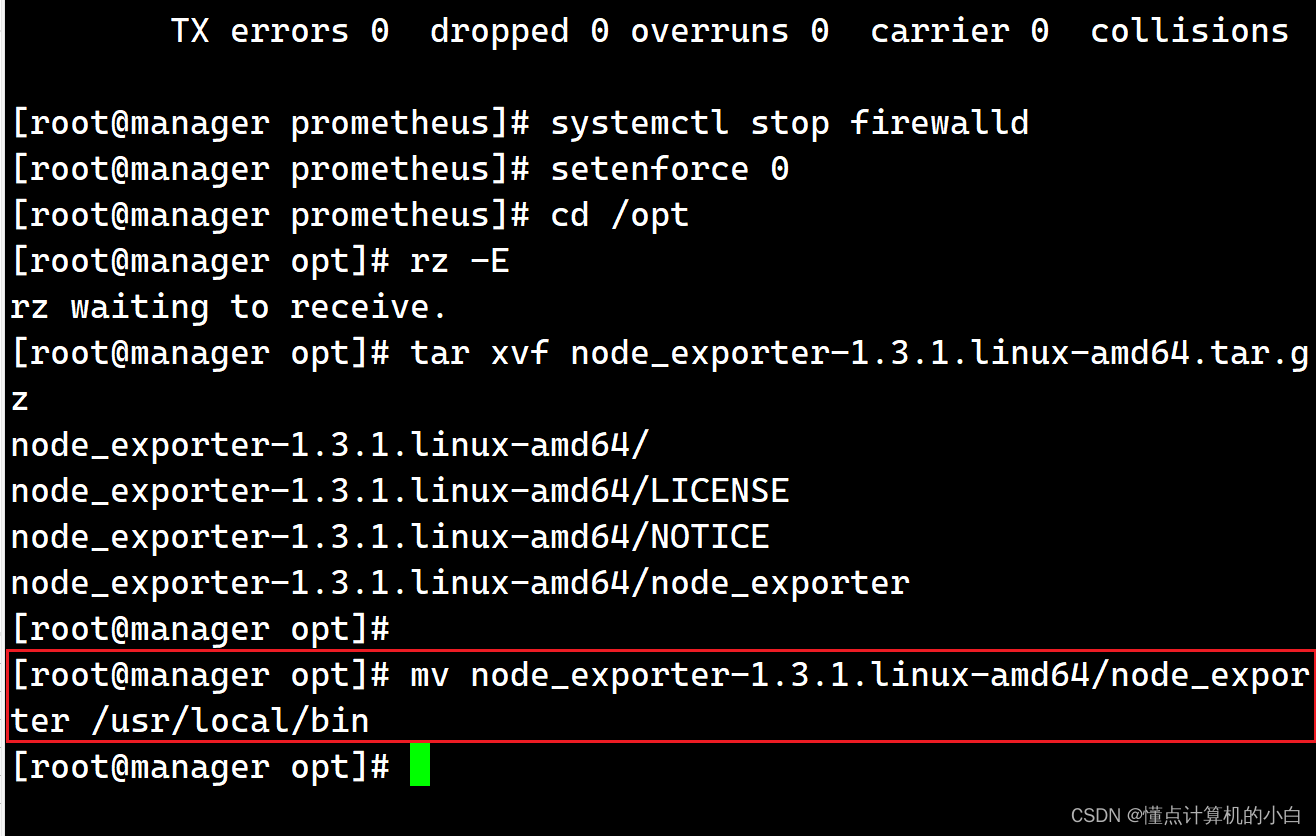
mv node_exporter-1.3.1.linux-amd64/node_exporter /usr/local/bin
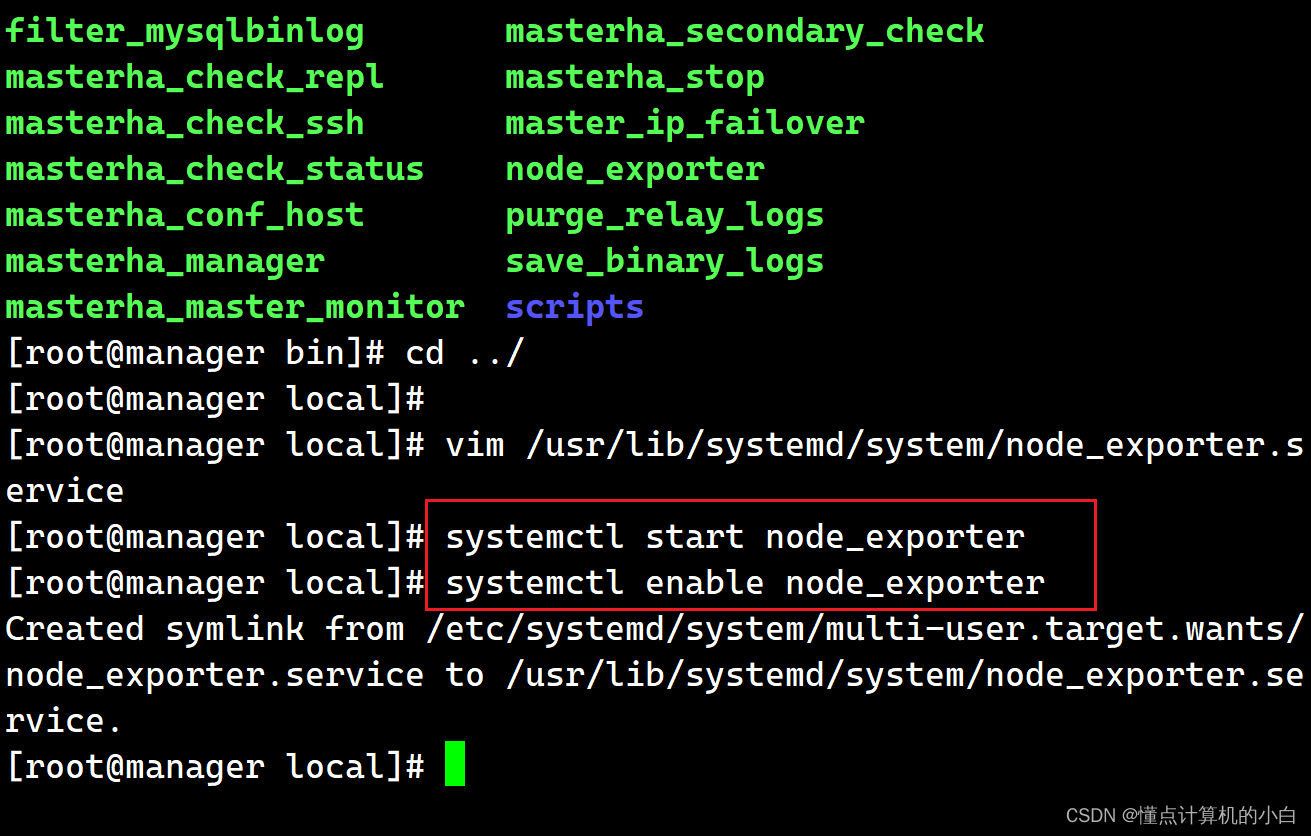
1.2 配置启动文件,设置开机自启
vim /usr/lib/systemd/system/node_exporter.service

[Unit]

Description=mysqld_exporter

Documentation=https://prometheus.io/

After=network.target

[Service]

Type=simple

ExecStart=/usr/local/bin/node_exporter \

--collector.ntp \

--collector.mountstats \

--collector.systemd \

--collector.tcpstat

ExecReload=/bin/kill -HUP $MAINPID

Restart=on-failure

[Install]

WantedBy=multi-user.target
vim /usr/lib/systemd/system/node_exporter.service
[Unit]
Description=mysqld_exporter
Documentation=https://prometheus.io/
After=network.target
[Service]
Type=simple
ExecStart=/usr/local/bin/node_exporter \
--collector.ntp \
--collector.mountstats \
--collector.systemd \
--collector.tcpstat
ExecReload=/bin/kill -HUP $MAINPID
Restart=on-failure
[Install]
WantedBy=multi-user.target

1.3 启动node_exporter

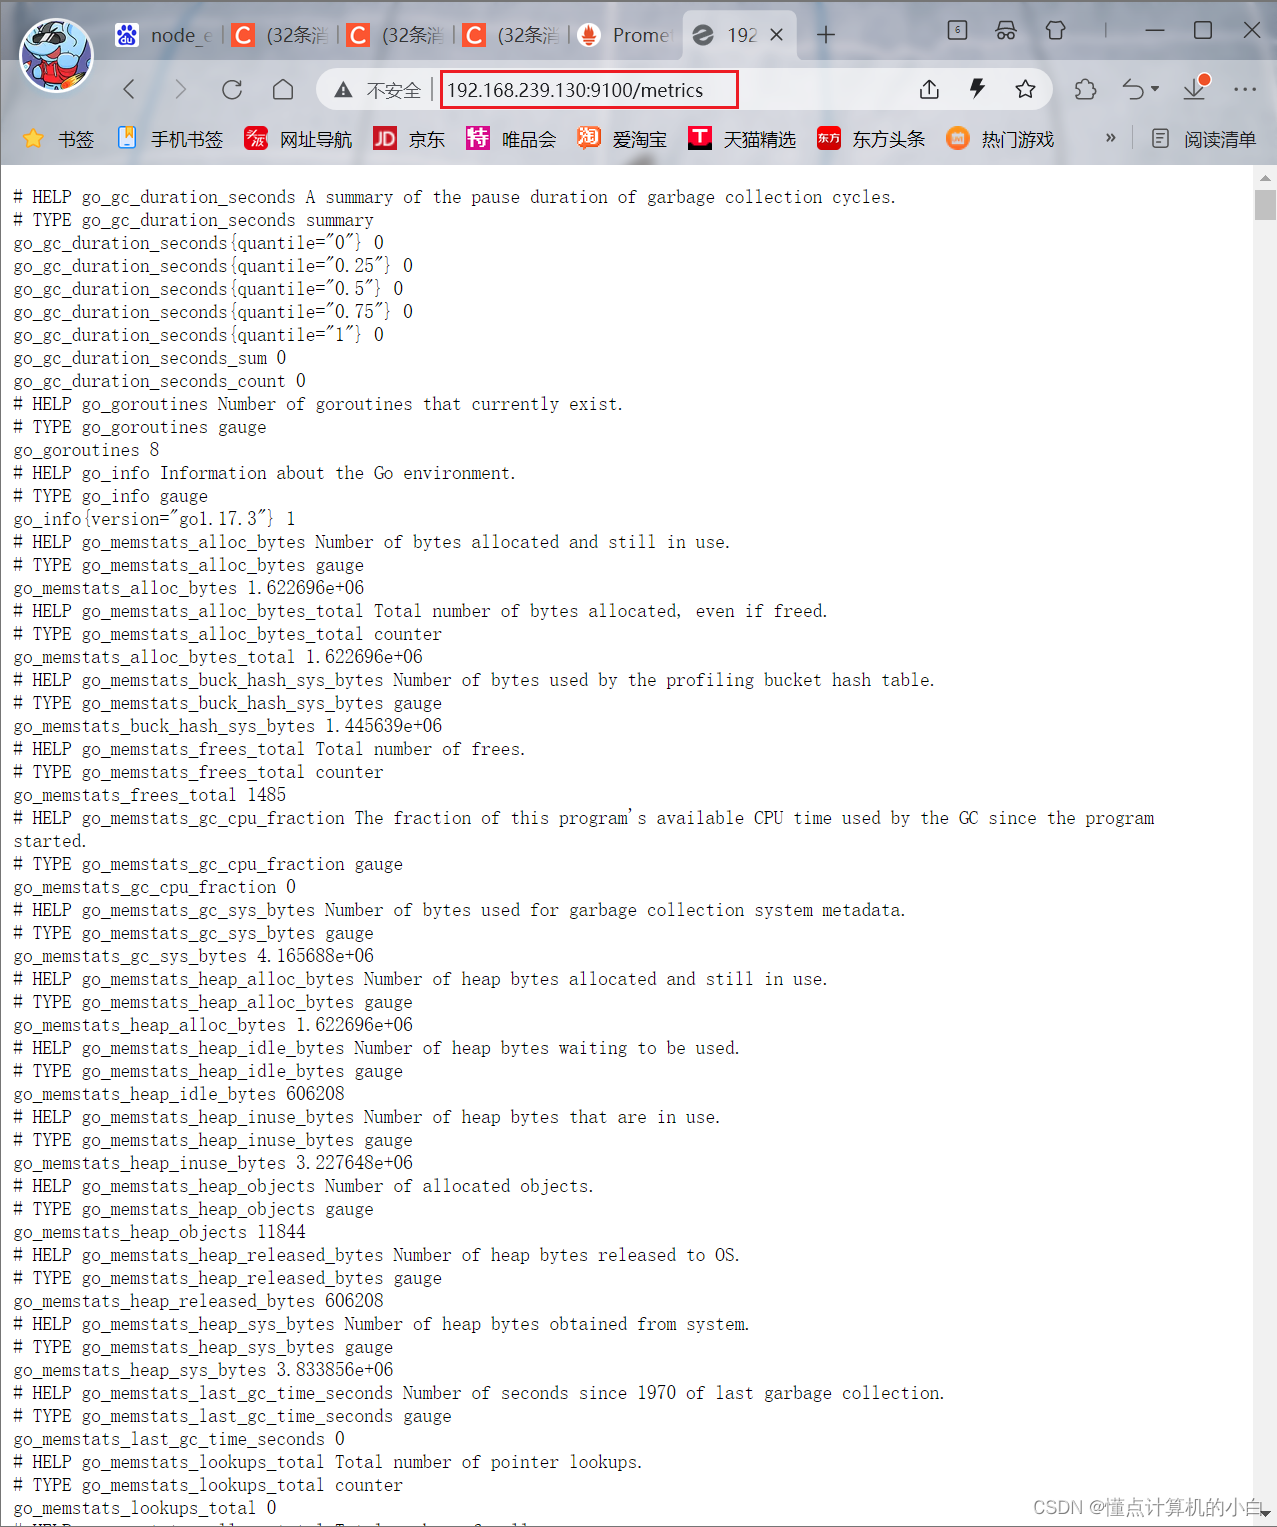
通过浏览器访问 http:// 被监控端 IP:9100/metrics 就可以查看到 node_exporter 在被监控端收集的监控信息:
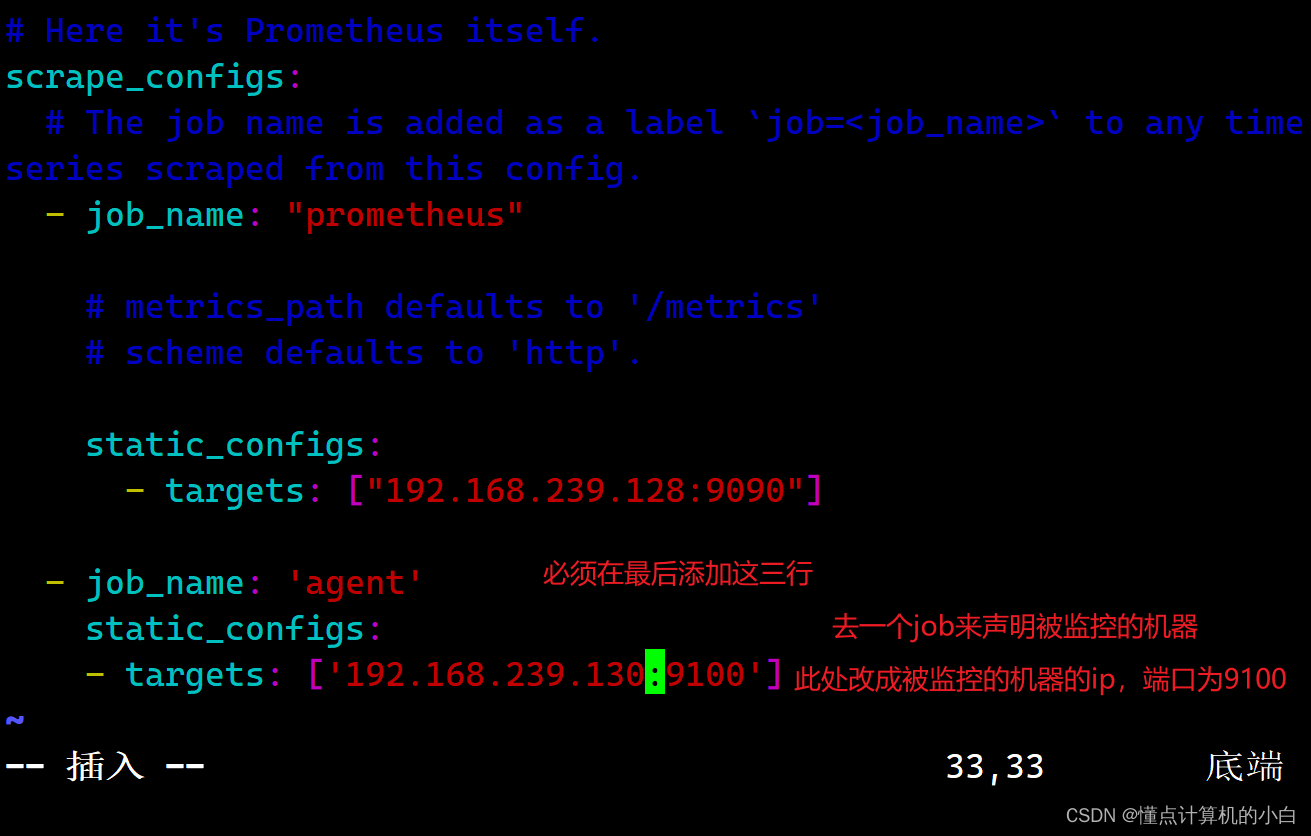
1.4 修改Prometheus服务器的配置文件128
回到 Prometheus 服务器的配置文件里添加被监控机器的配置段
vim /usr/local/prometheus/prometheus.yml
- job_name: 'agent'
static_configs:
- targets: ['192.168.239.130:9100']
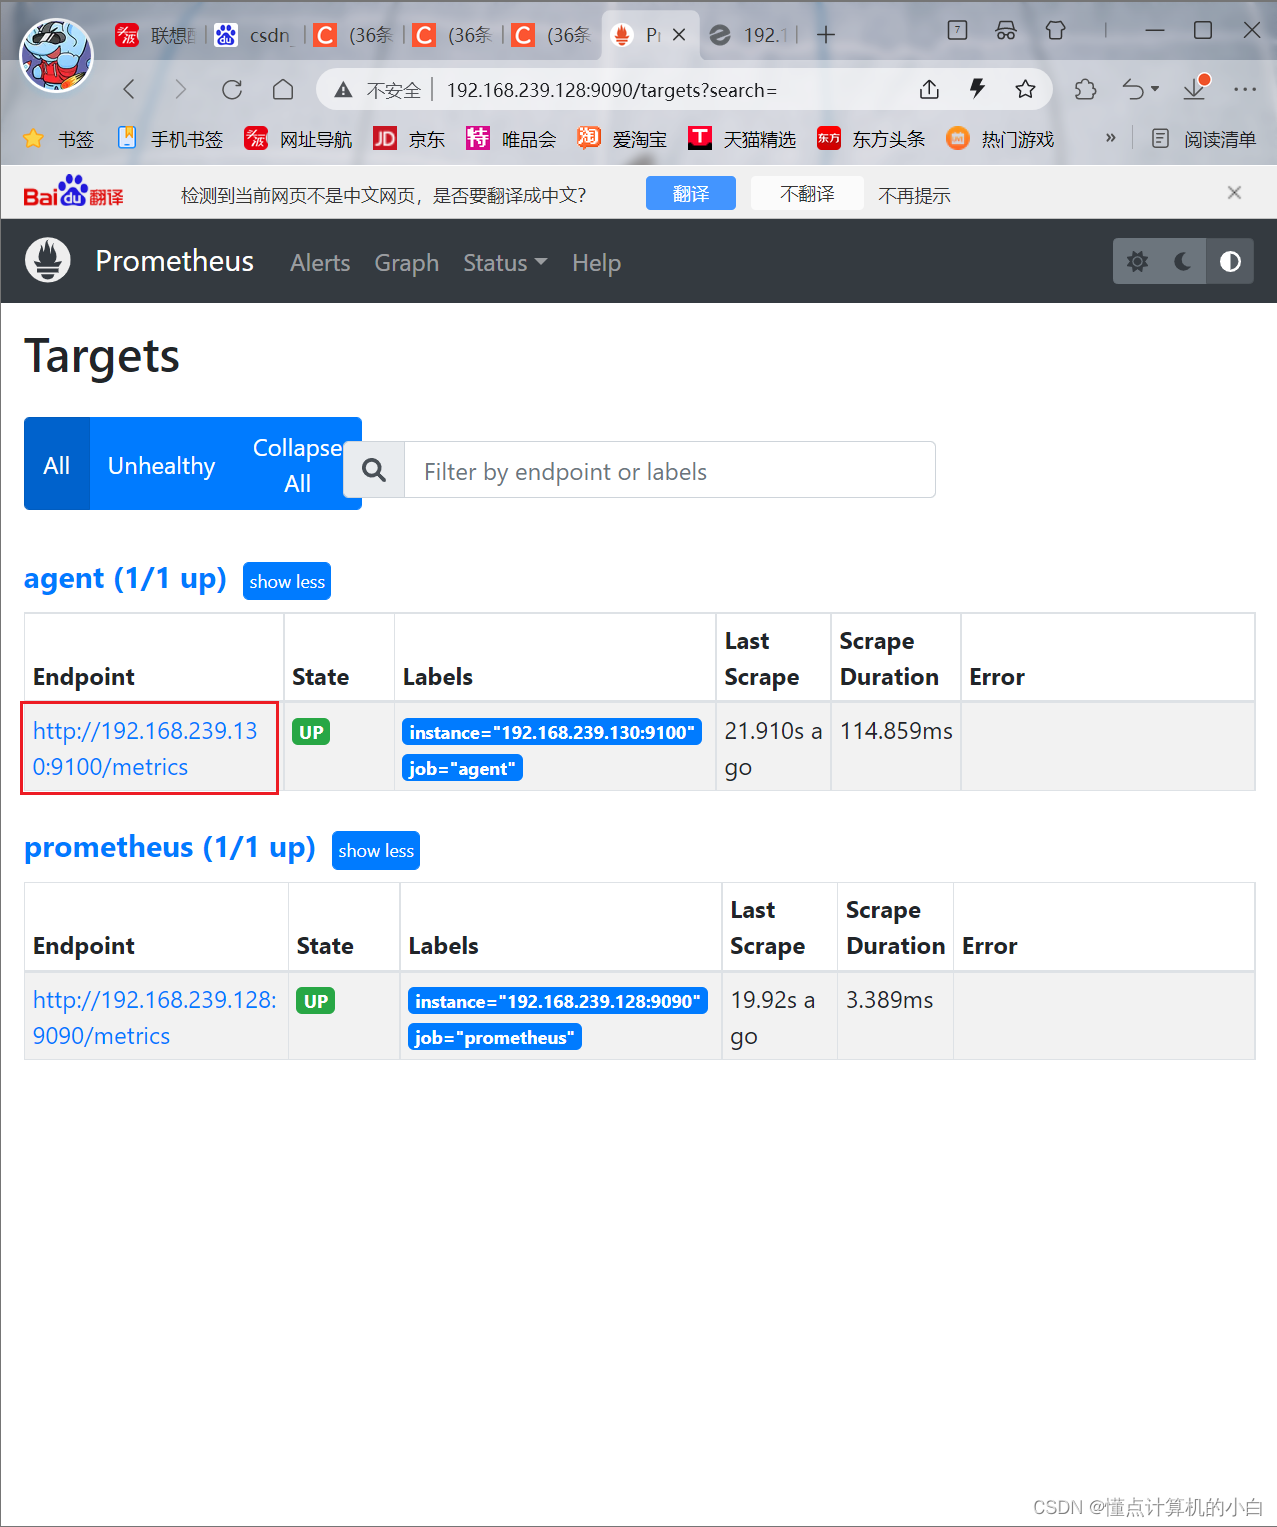
1.5 访问prometheus服务器
回到 web 管理界面→点 Status→点 Targets→可以看到多了一台监控目标
2、监控远程MySQL
在被管理机 agent上安装 mysqld_exporter 组件
下载地址:
https://prometheus.io/download/
mysqld_exporter%E7%BB%84%E4%BB%B6" style="margin-left:0px;text-align:justify;">2.1 下载mysqld_exporter组件
wget https://github.com/prometheus/mysqld_exporter/releases/download/v0.14.0/mysqld_exporter-0.14.0.linux-amd64.tar.gz
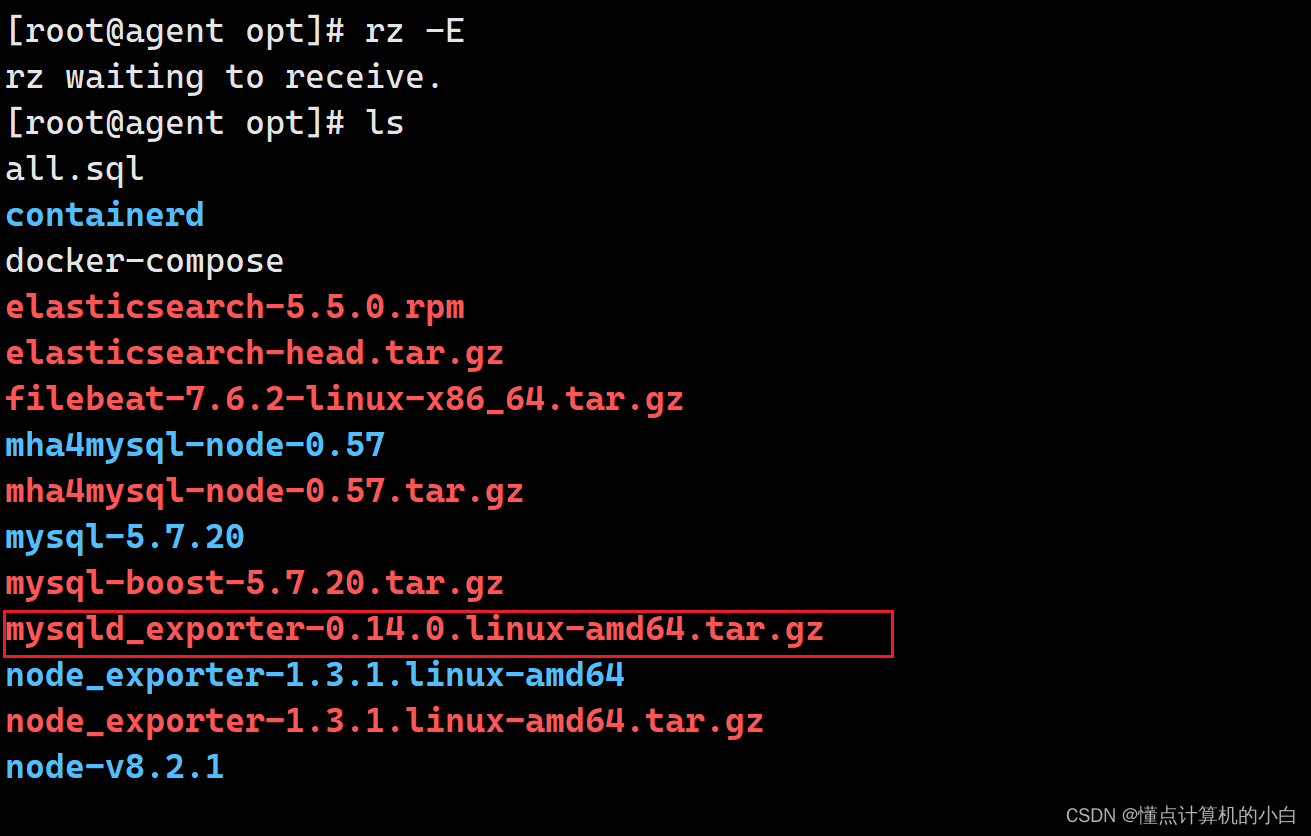
2.2解压安装
[root@agent opt]# tar xf mysqld_exporter-0.14.0.linux-amd64.tar.gz -C /usr/local
[root@agent opt]# mv /usr/local/mysqld_exporter-0.14.0.linux-amd64/ /usr/local/mysqld_exporter
[root@agent opt]# ls /usr/local/mysqld_exporter/
LICENSE mysqld_exporter NOTICE


2.3 安装mariadb数据库,并授权
yum install mariadb\* -y

systemctl start mariadb
systemctl enable mariadb
#进入数据库
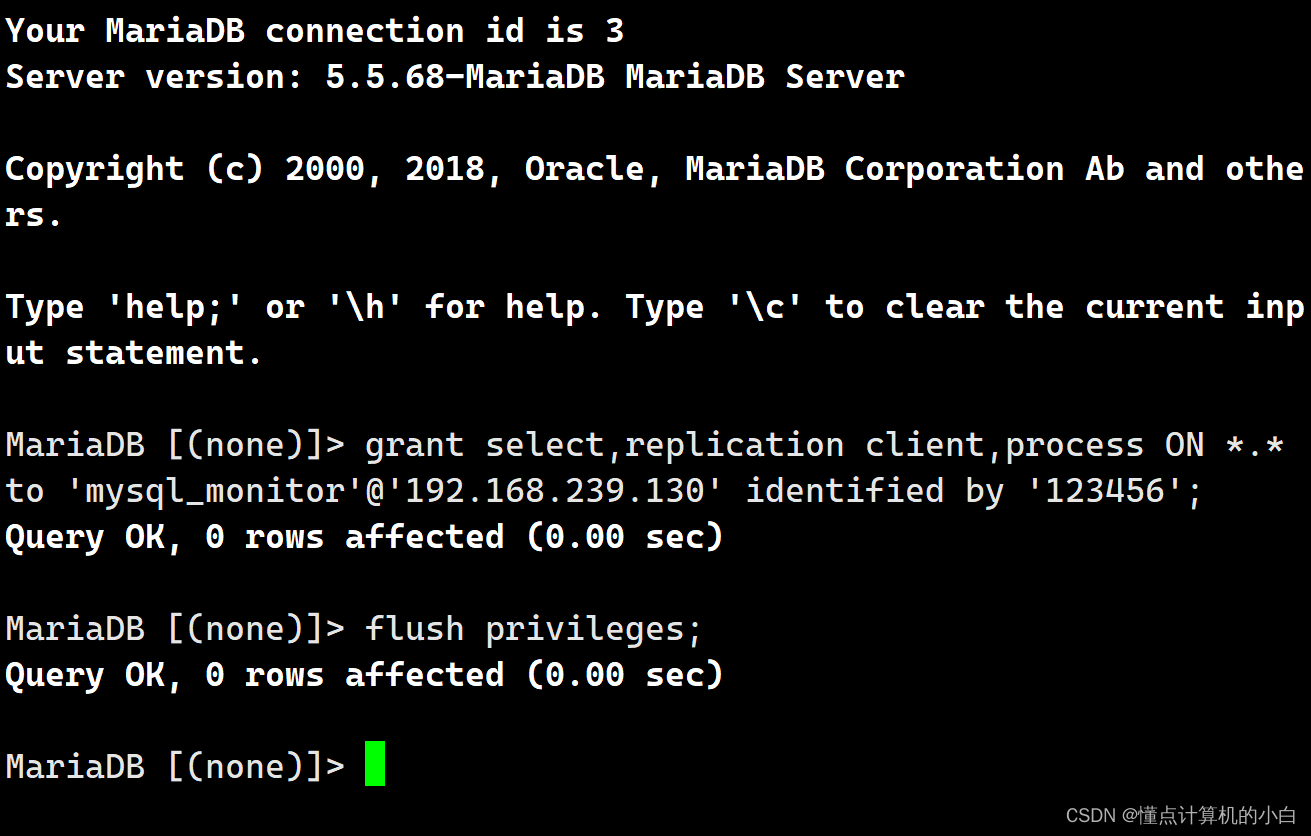
授权IP为192.168.239.130,因为不是prometheus服务器直接来找mariadb获取数据,而是prometheus服务器找mysql_exporter,然后mysql_exporter再找mariadb.所以这个IP指的是mysql_exporter的IP.
grant select,replication client,process ON *.* to 'mysql_monitor'@'192.168.239.130' identified by '123456';
flush privileges;

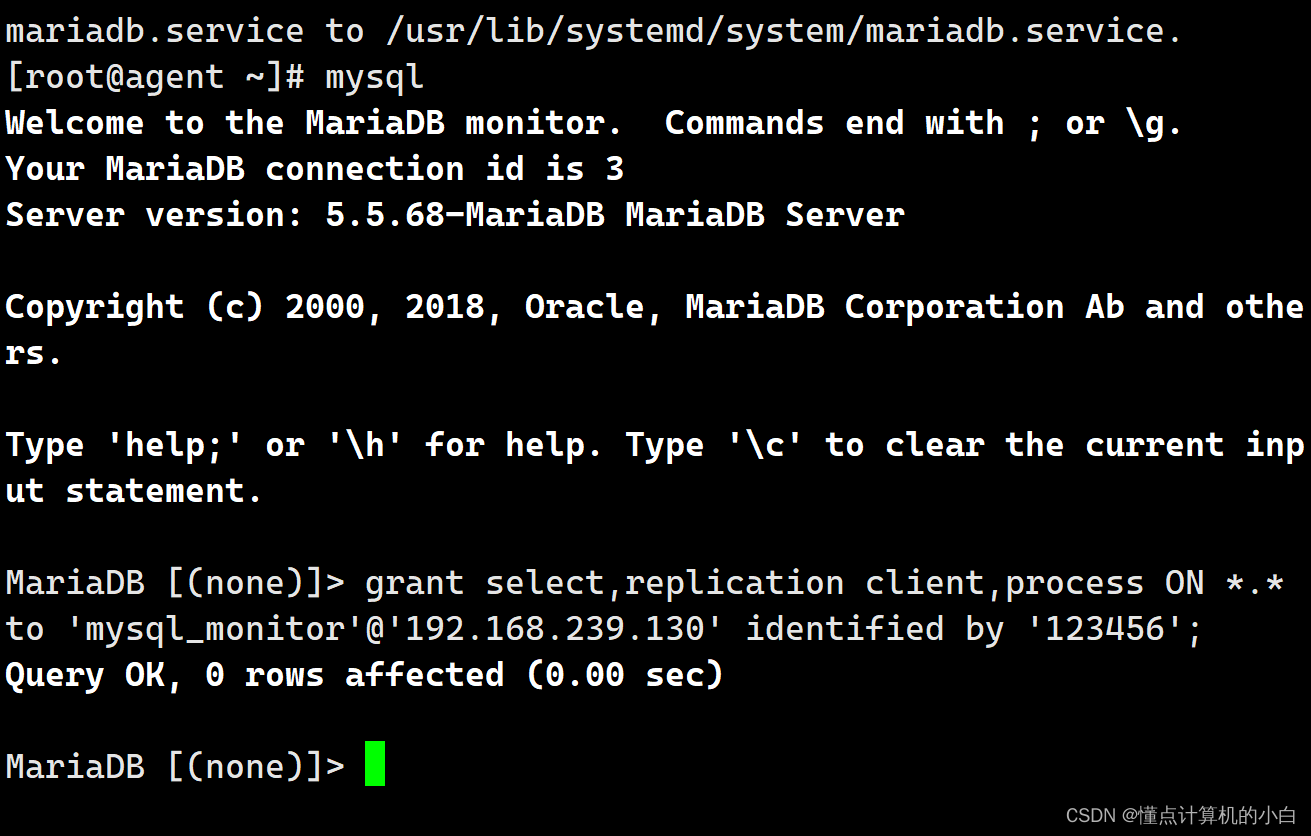
这里的ip是mysql_exporter的ip
2.4 创建一个mariadb配置文件
创建一个mariadb配置文件,写上连接的用户名和密码(和上面的授权的用户名和密码要对应)
vim /usr/local/mysqld_exporter/ .my.cnf
[client]
user=mysql_monitor
password=123456

2.5 配置启动文件,启动mysql_exporter
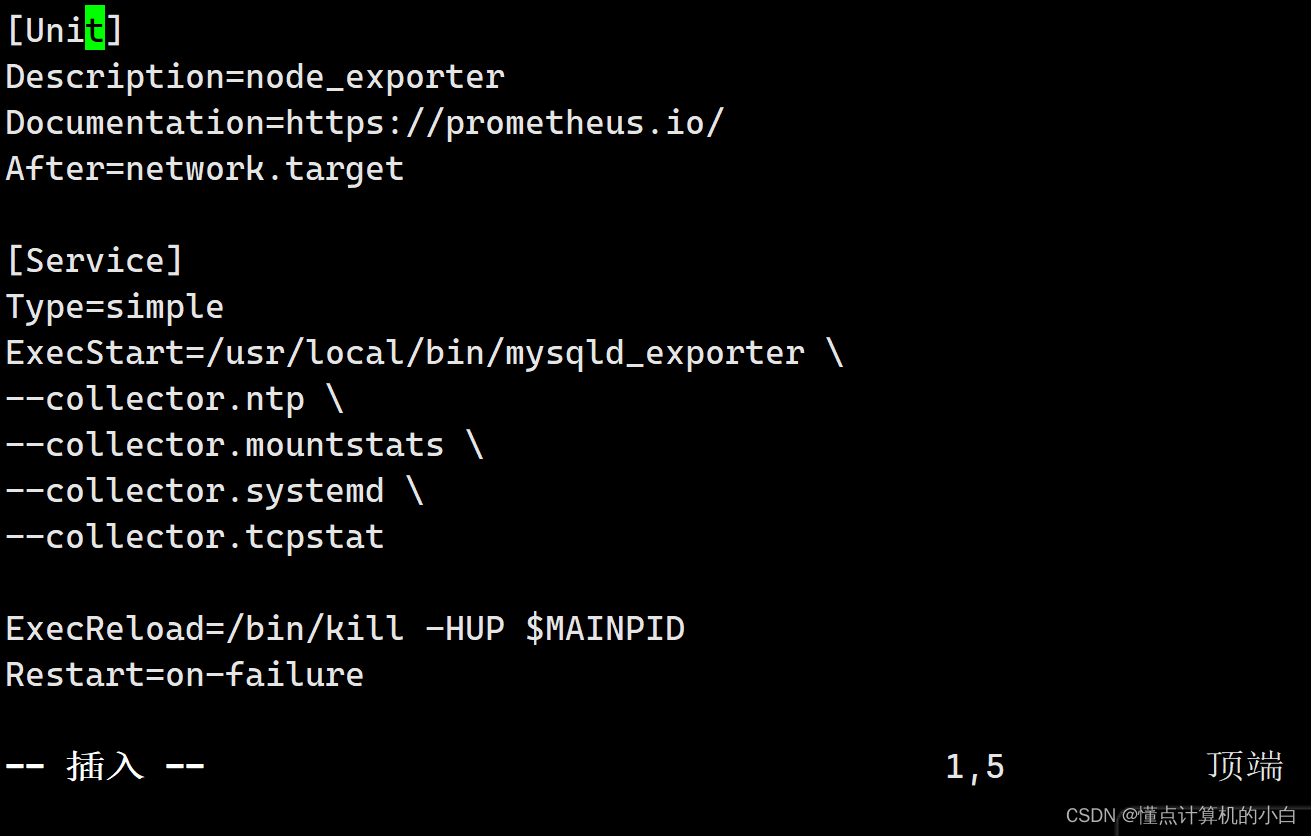
[root@agent ~]# vim /usr/lib/systemd/system/mysqld_exporter.service

[Unit]

Description=node_exporter

Documentation=https://prometheus.io/

After=network.target

[Service]

Type=simple

ExecStart=/usr/local/bin/mysqld_exporter \

--collector.ntp \

--collector.mountstats \

--collector.systemd \

--collector.tcpstat

ExecReload=/bin/kill -HUP $MAINPID

Restart=on-failure

[Install]

WantedBy=multi-user.target
[root@agent ~]# vim /usr/lib/systemd/system/mysqld_exporter.service
[Unit]
Description=node_exporter
Documentation=https://prometheus.io/
After=network.target
[Service]
Type=simple
ExecStart=/usr/local/bin/mysqld_exporter \
--collector.ntp \
--collector.mountstats \
--collector.systemd \
--collector.tcpstat
ExecReload=/bin/kill -HUP $MAINPID
Restart=on-failure
[Install]
WantedBy=multi-user.target

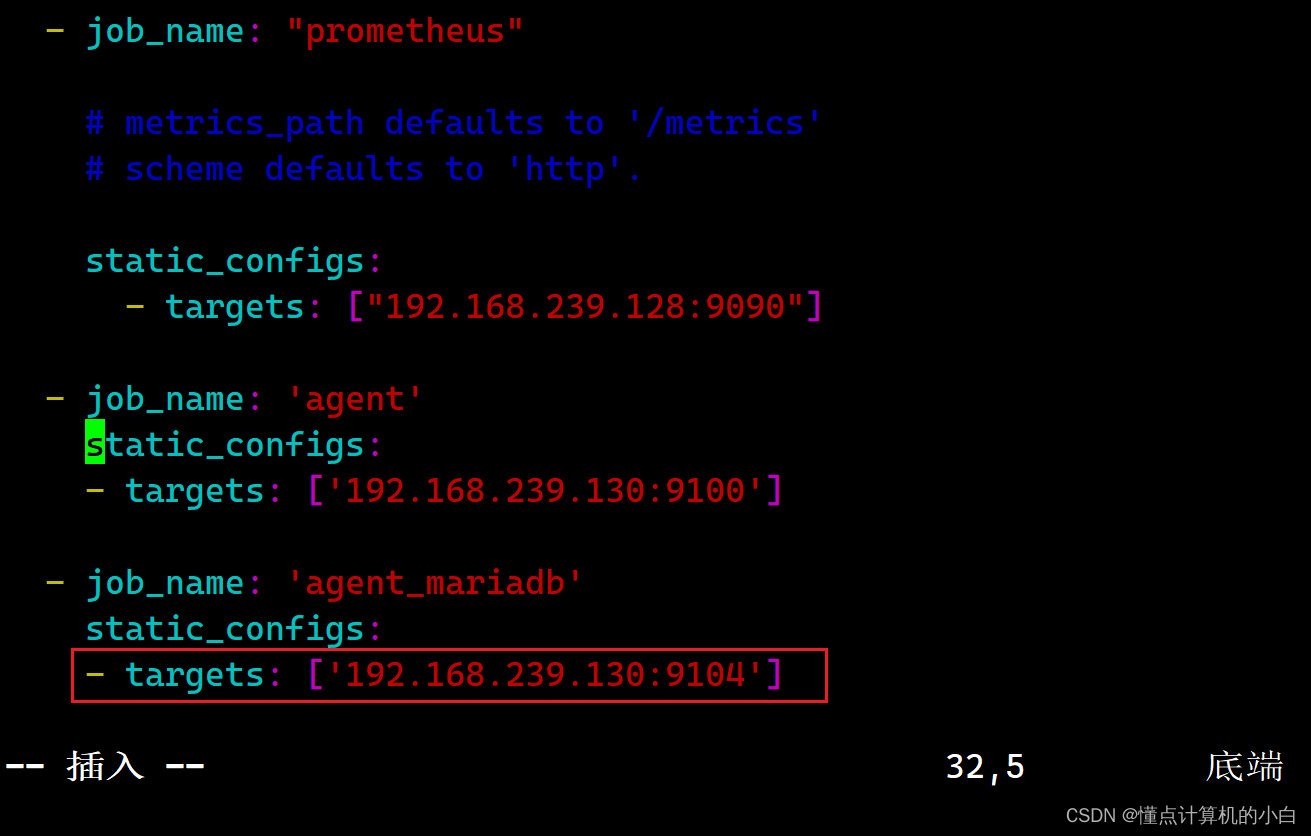
2.6 修改Prometheus服务器的配置文件
回到 Prometheus 服务器的配置文件里添加被监控的 mariadb 的配置段
vim /usr/local/prometheus/prometheus.yml
- job_name: 'agent_mariadb'
static_configs:
- targets: ['192.168.239.130:9104']
systemctl restart prometheus
prometheus%E6%9C%8D%E5%8A%A1%E5%99%A8" style="margin-left:0px;text-align:justify;">2.7 访问prometheus服务器
回到 web 管理界面→点 Status→点 Targets→可以看到监控 mariadb

三、部署Grafana进行展示
Grafana 是一个开源的度量分析和可视化工具,可以通过将采集的数据分析,查询,然后进行可视化的展示,并能实现报警。
https://grafana.com/grafana/download/
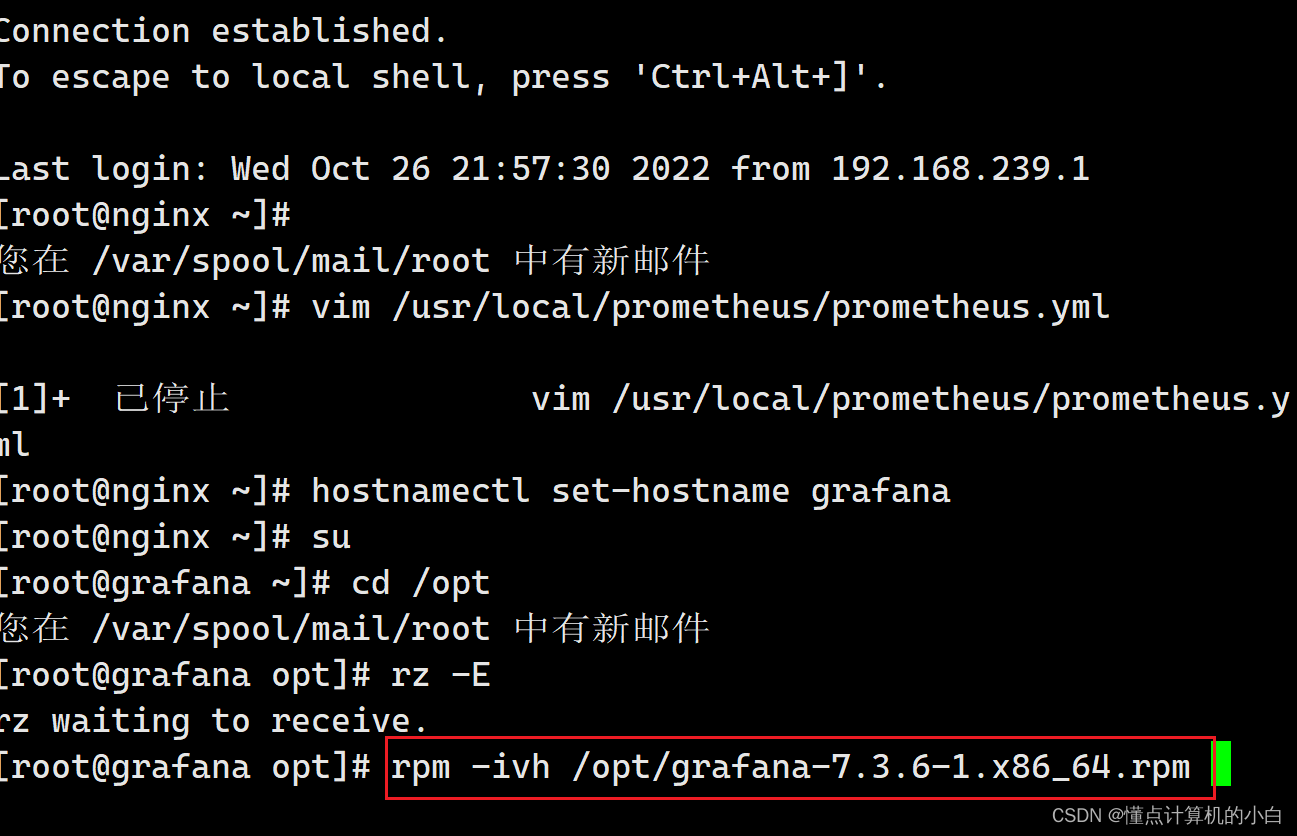
1、下载安装Grafana(192.168.239.129)
#使用yum解决依赖关系 我这边直接上传软件包到opt
yum install -y grafana-7.4.0-1.x86_64.rpm
或
rpm -ivh /opt/grafana-7.3.6-1.x86_64.rpm
systemctl start grafana-server
systemctl enable grafana-server
netstat -natp | grep :3000
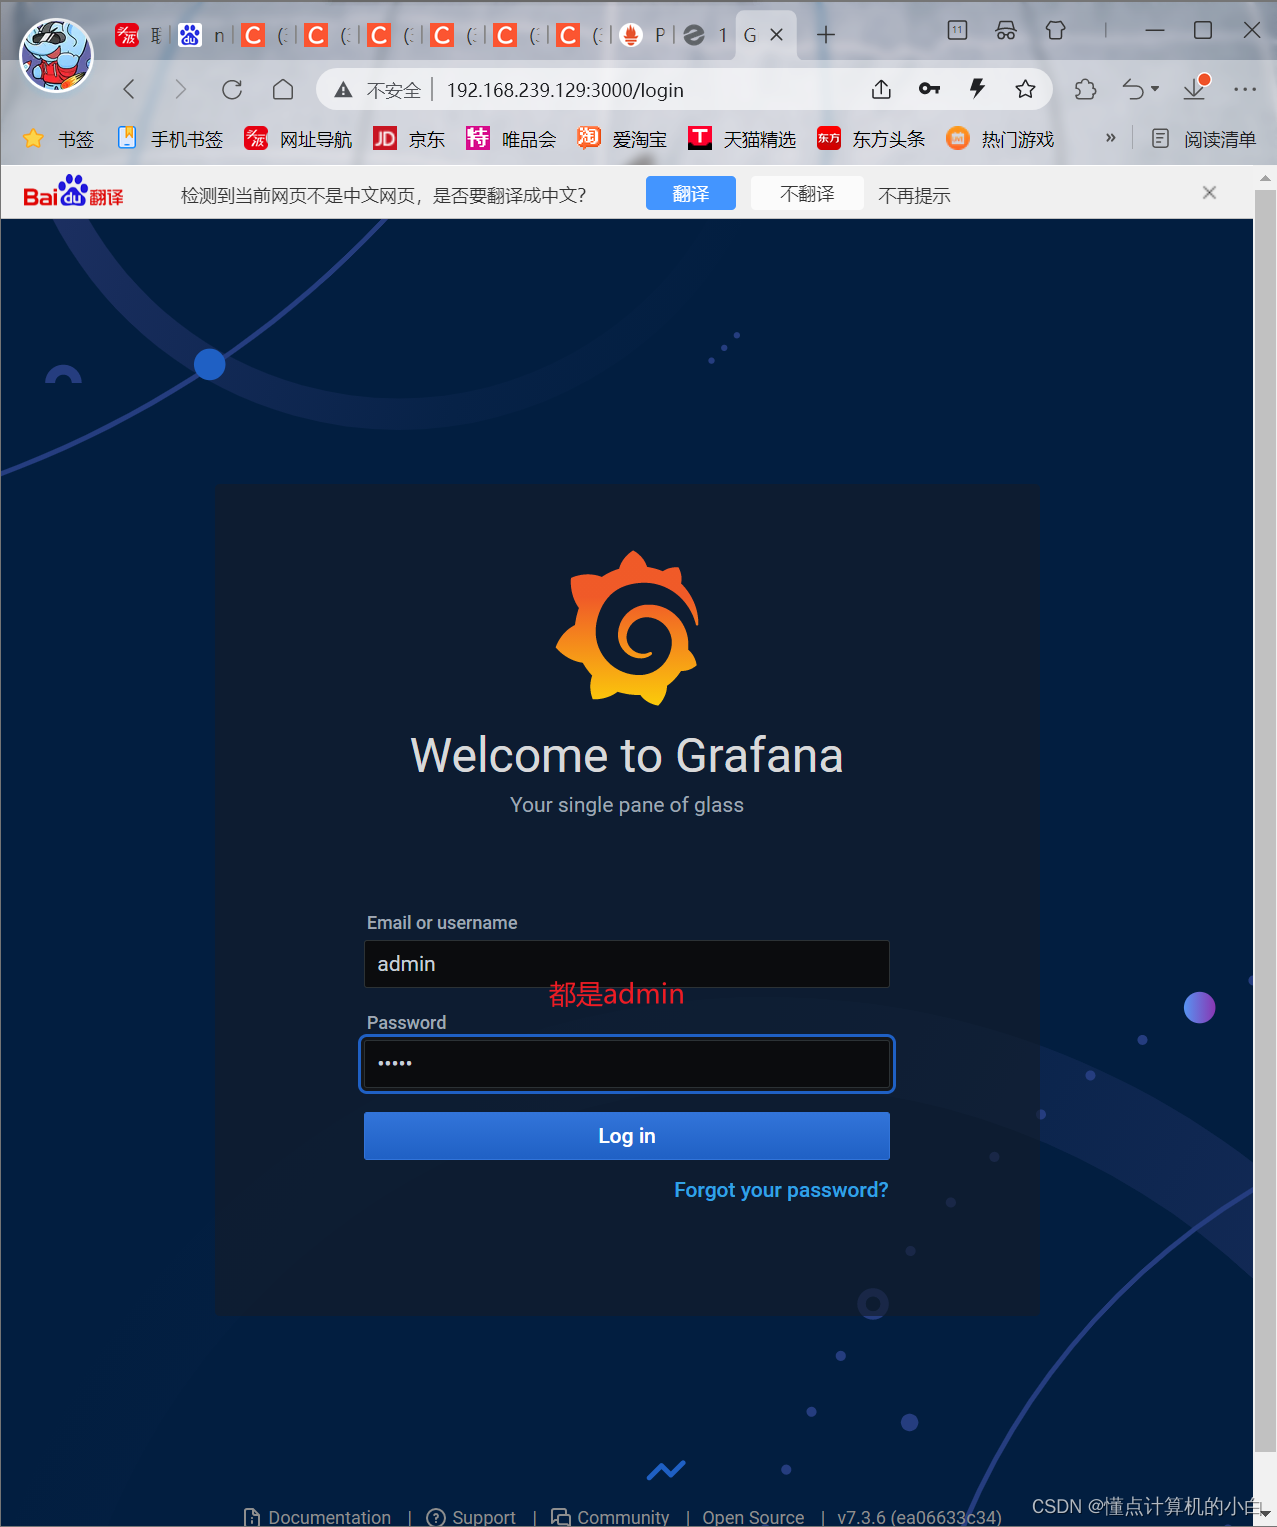
浏览器访问:http://192.168.239.129:3000 ,默认账号和密码为 admin/admin

后直接使用浏览器访问即可端口跟3000


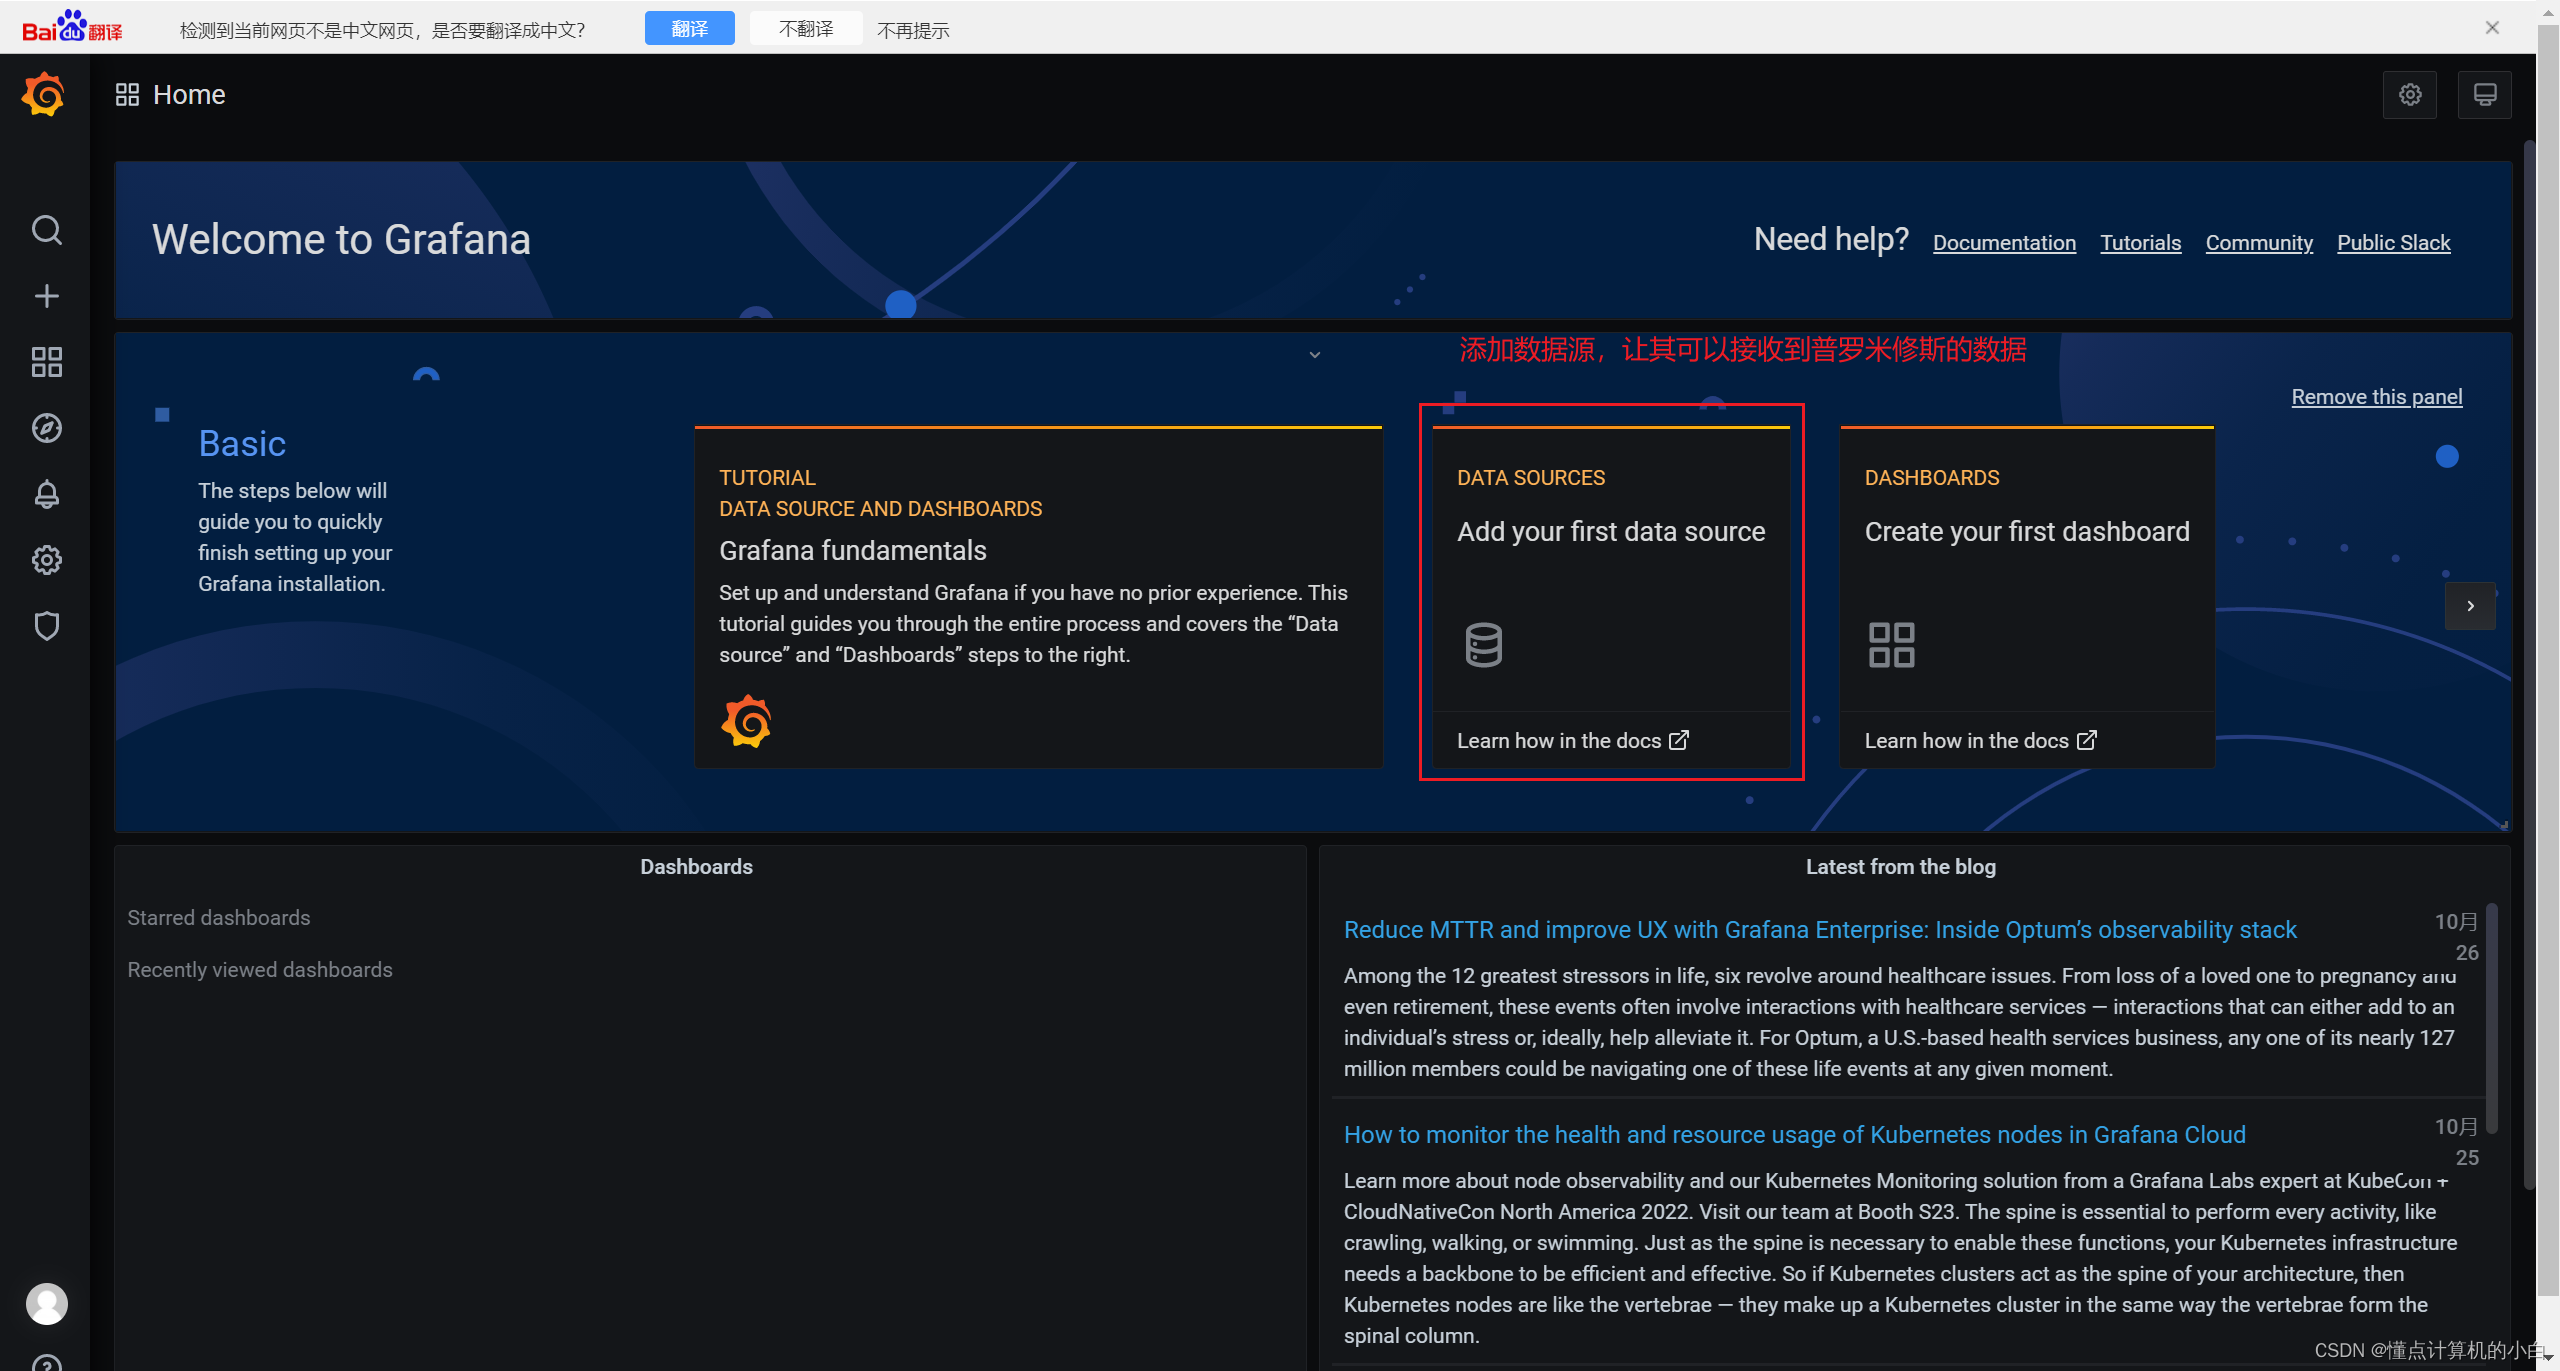
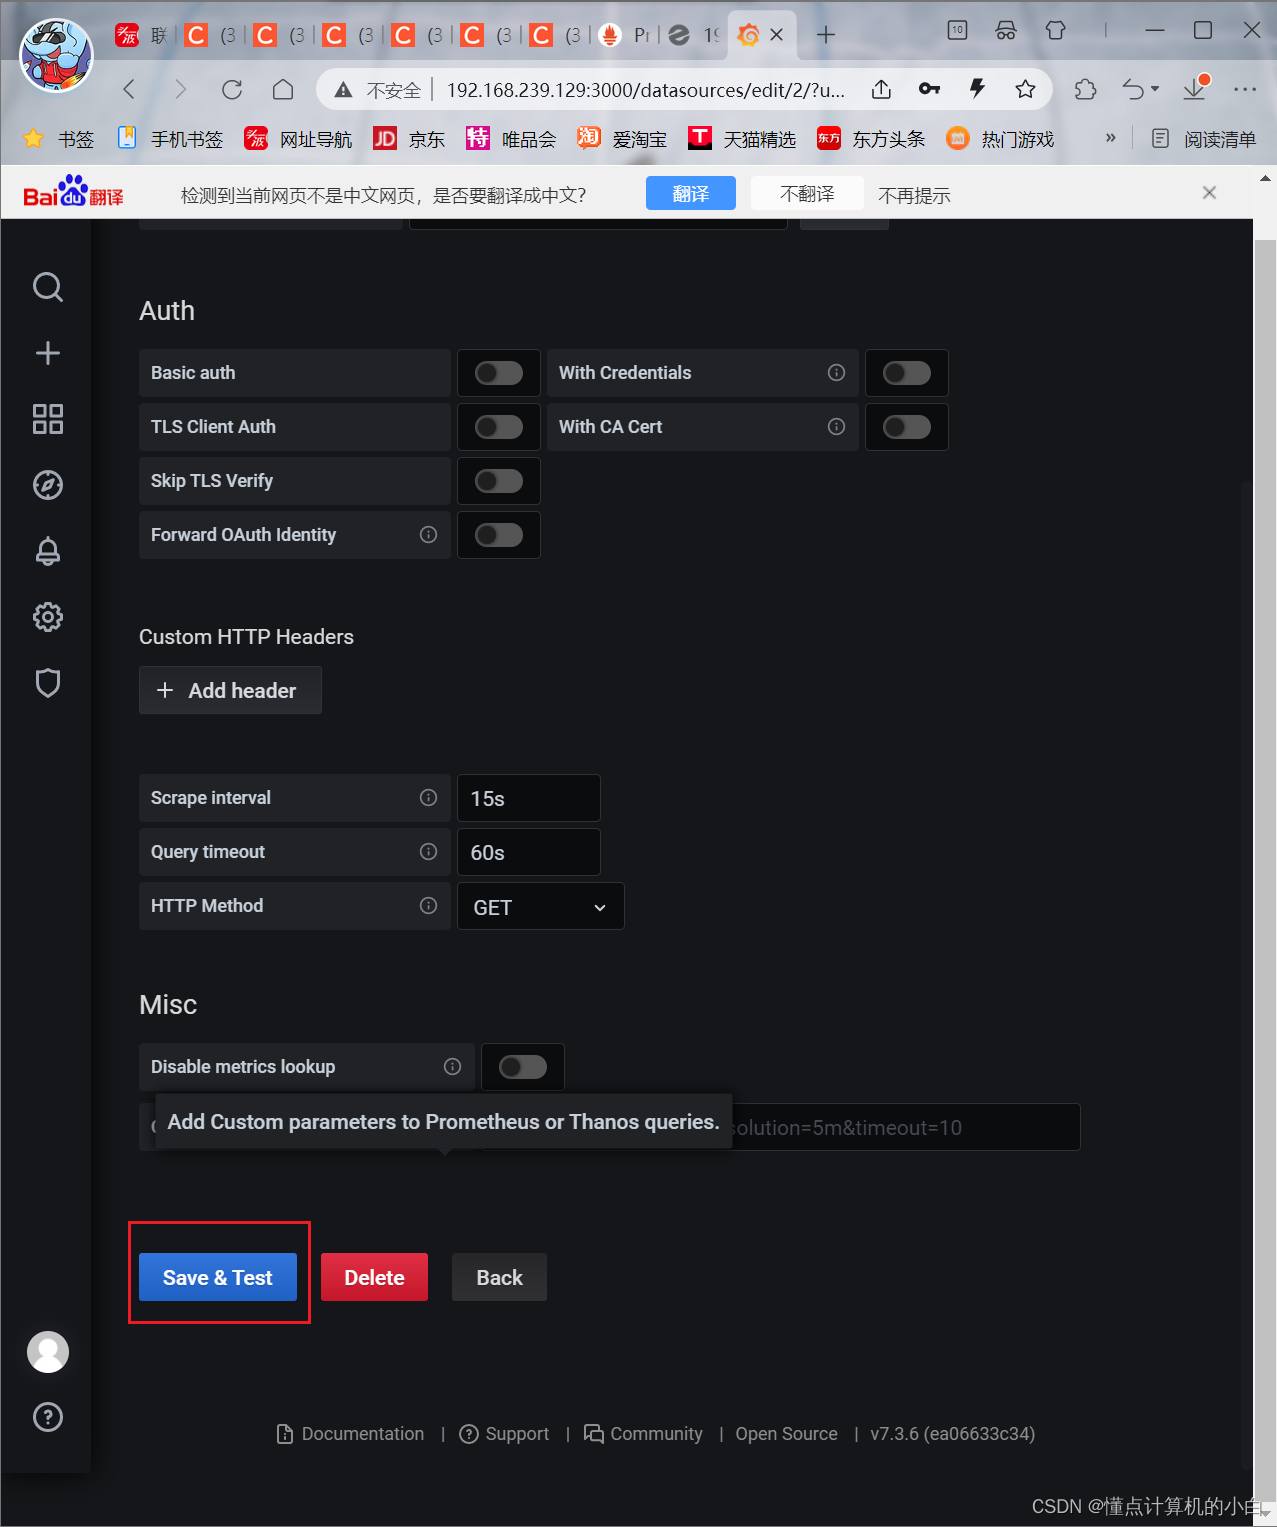
2、配置数据源
下面我们把 Prometheus 服务器收集的数据做为一个数据源添加到 grafana,让 grafana 可以得到 Prometheus 的数据。

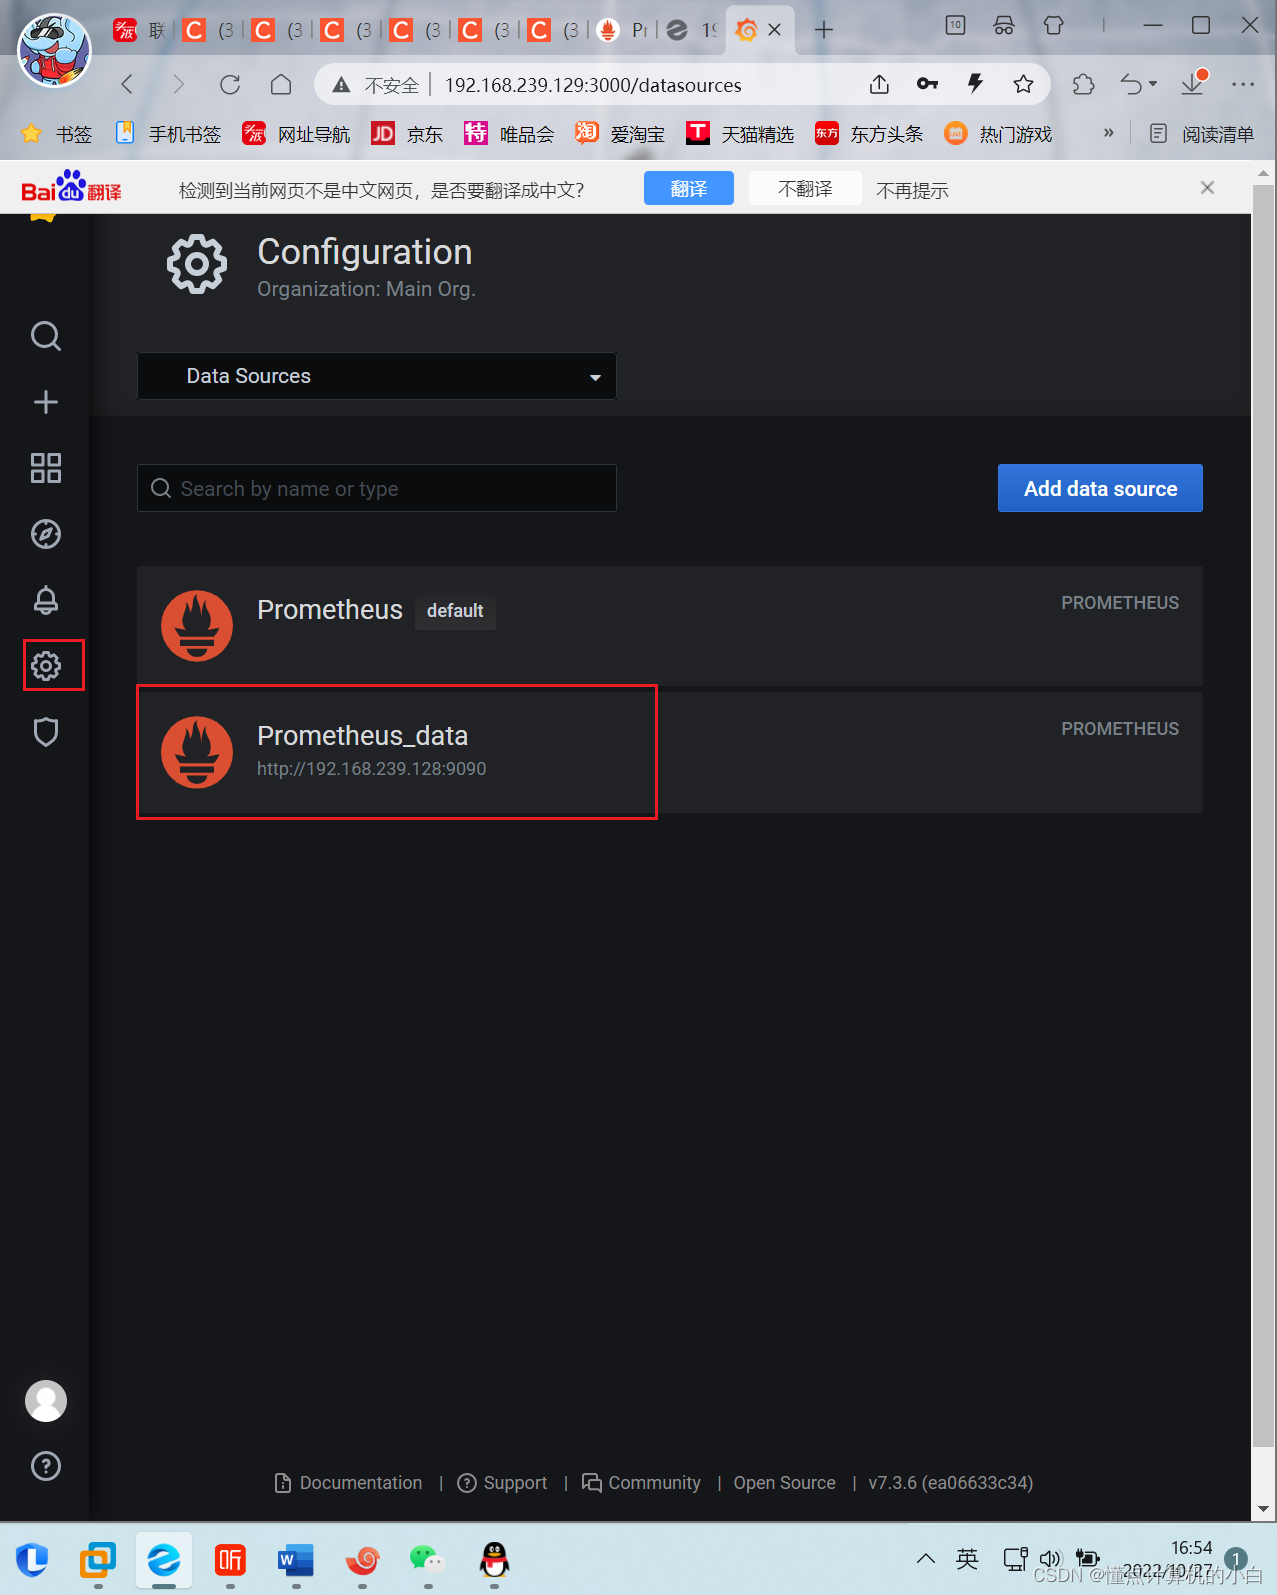
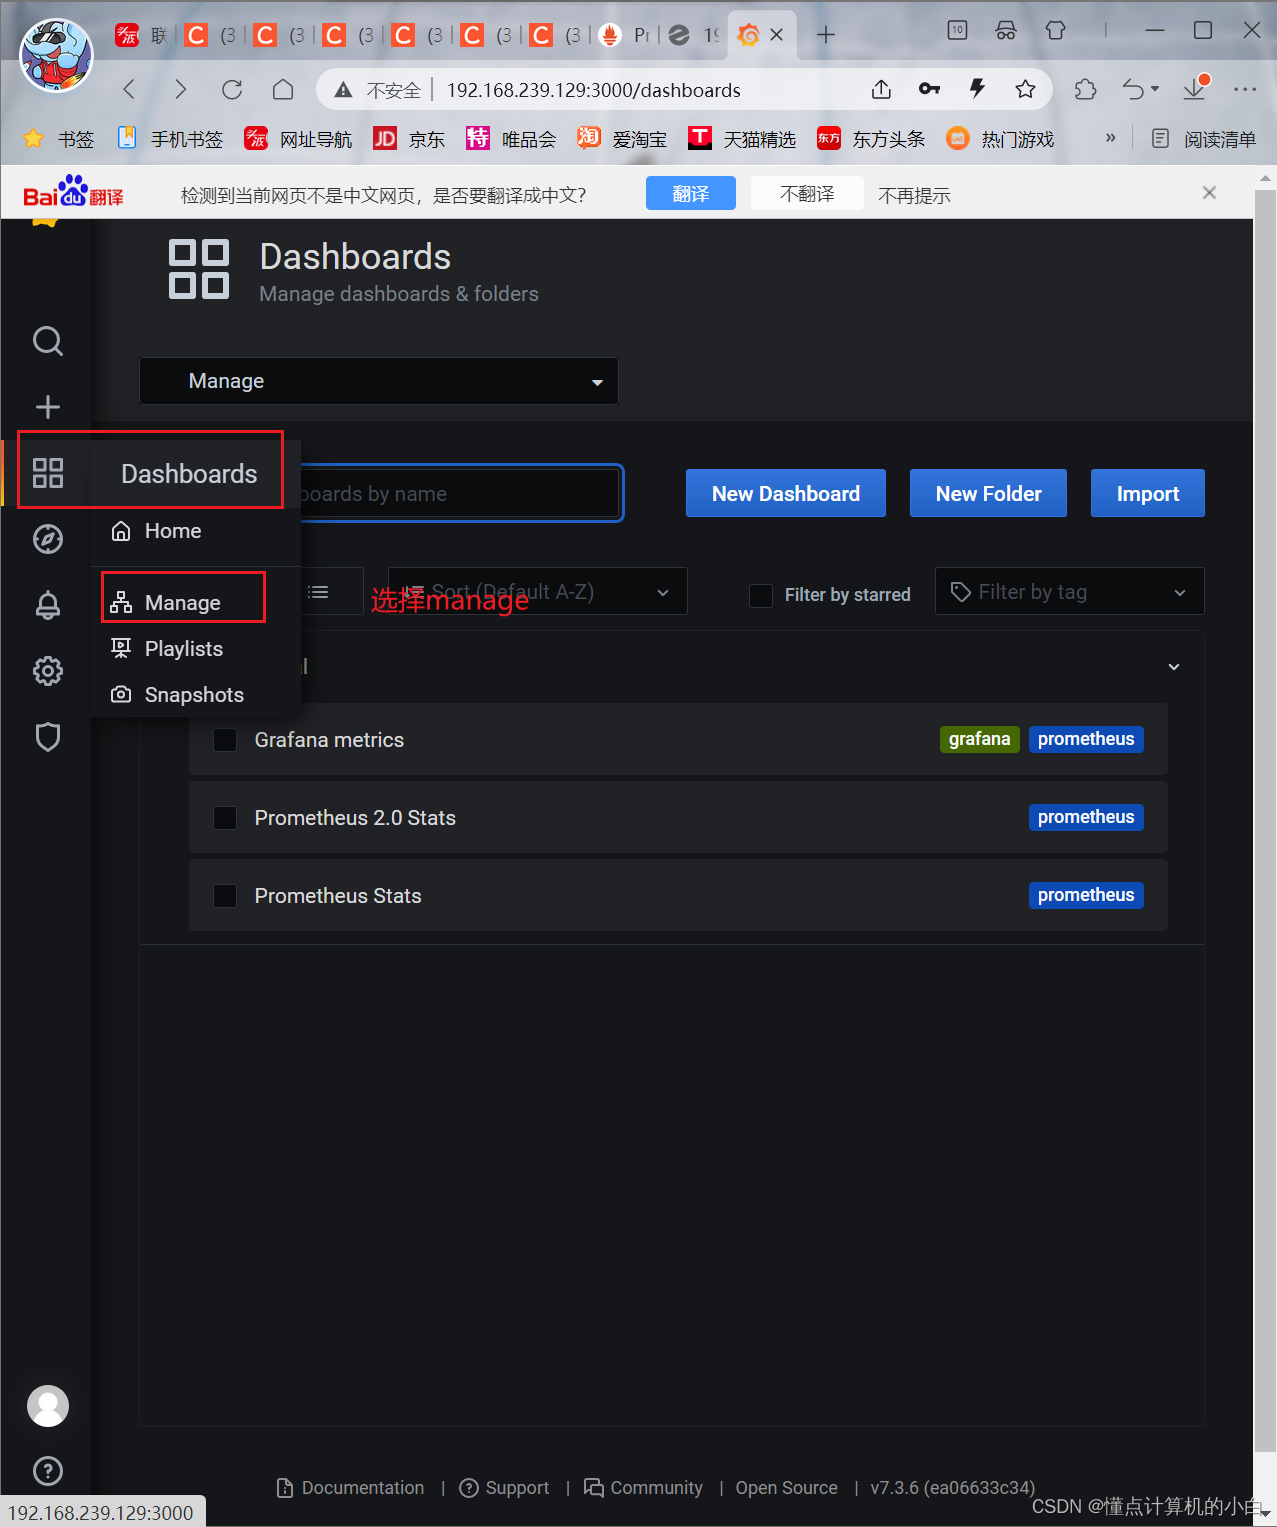
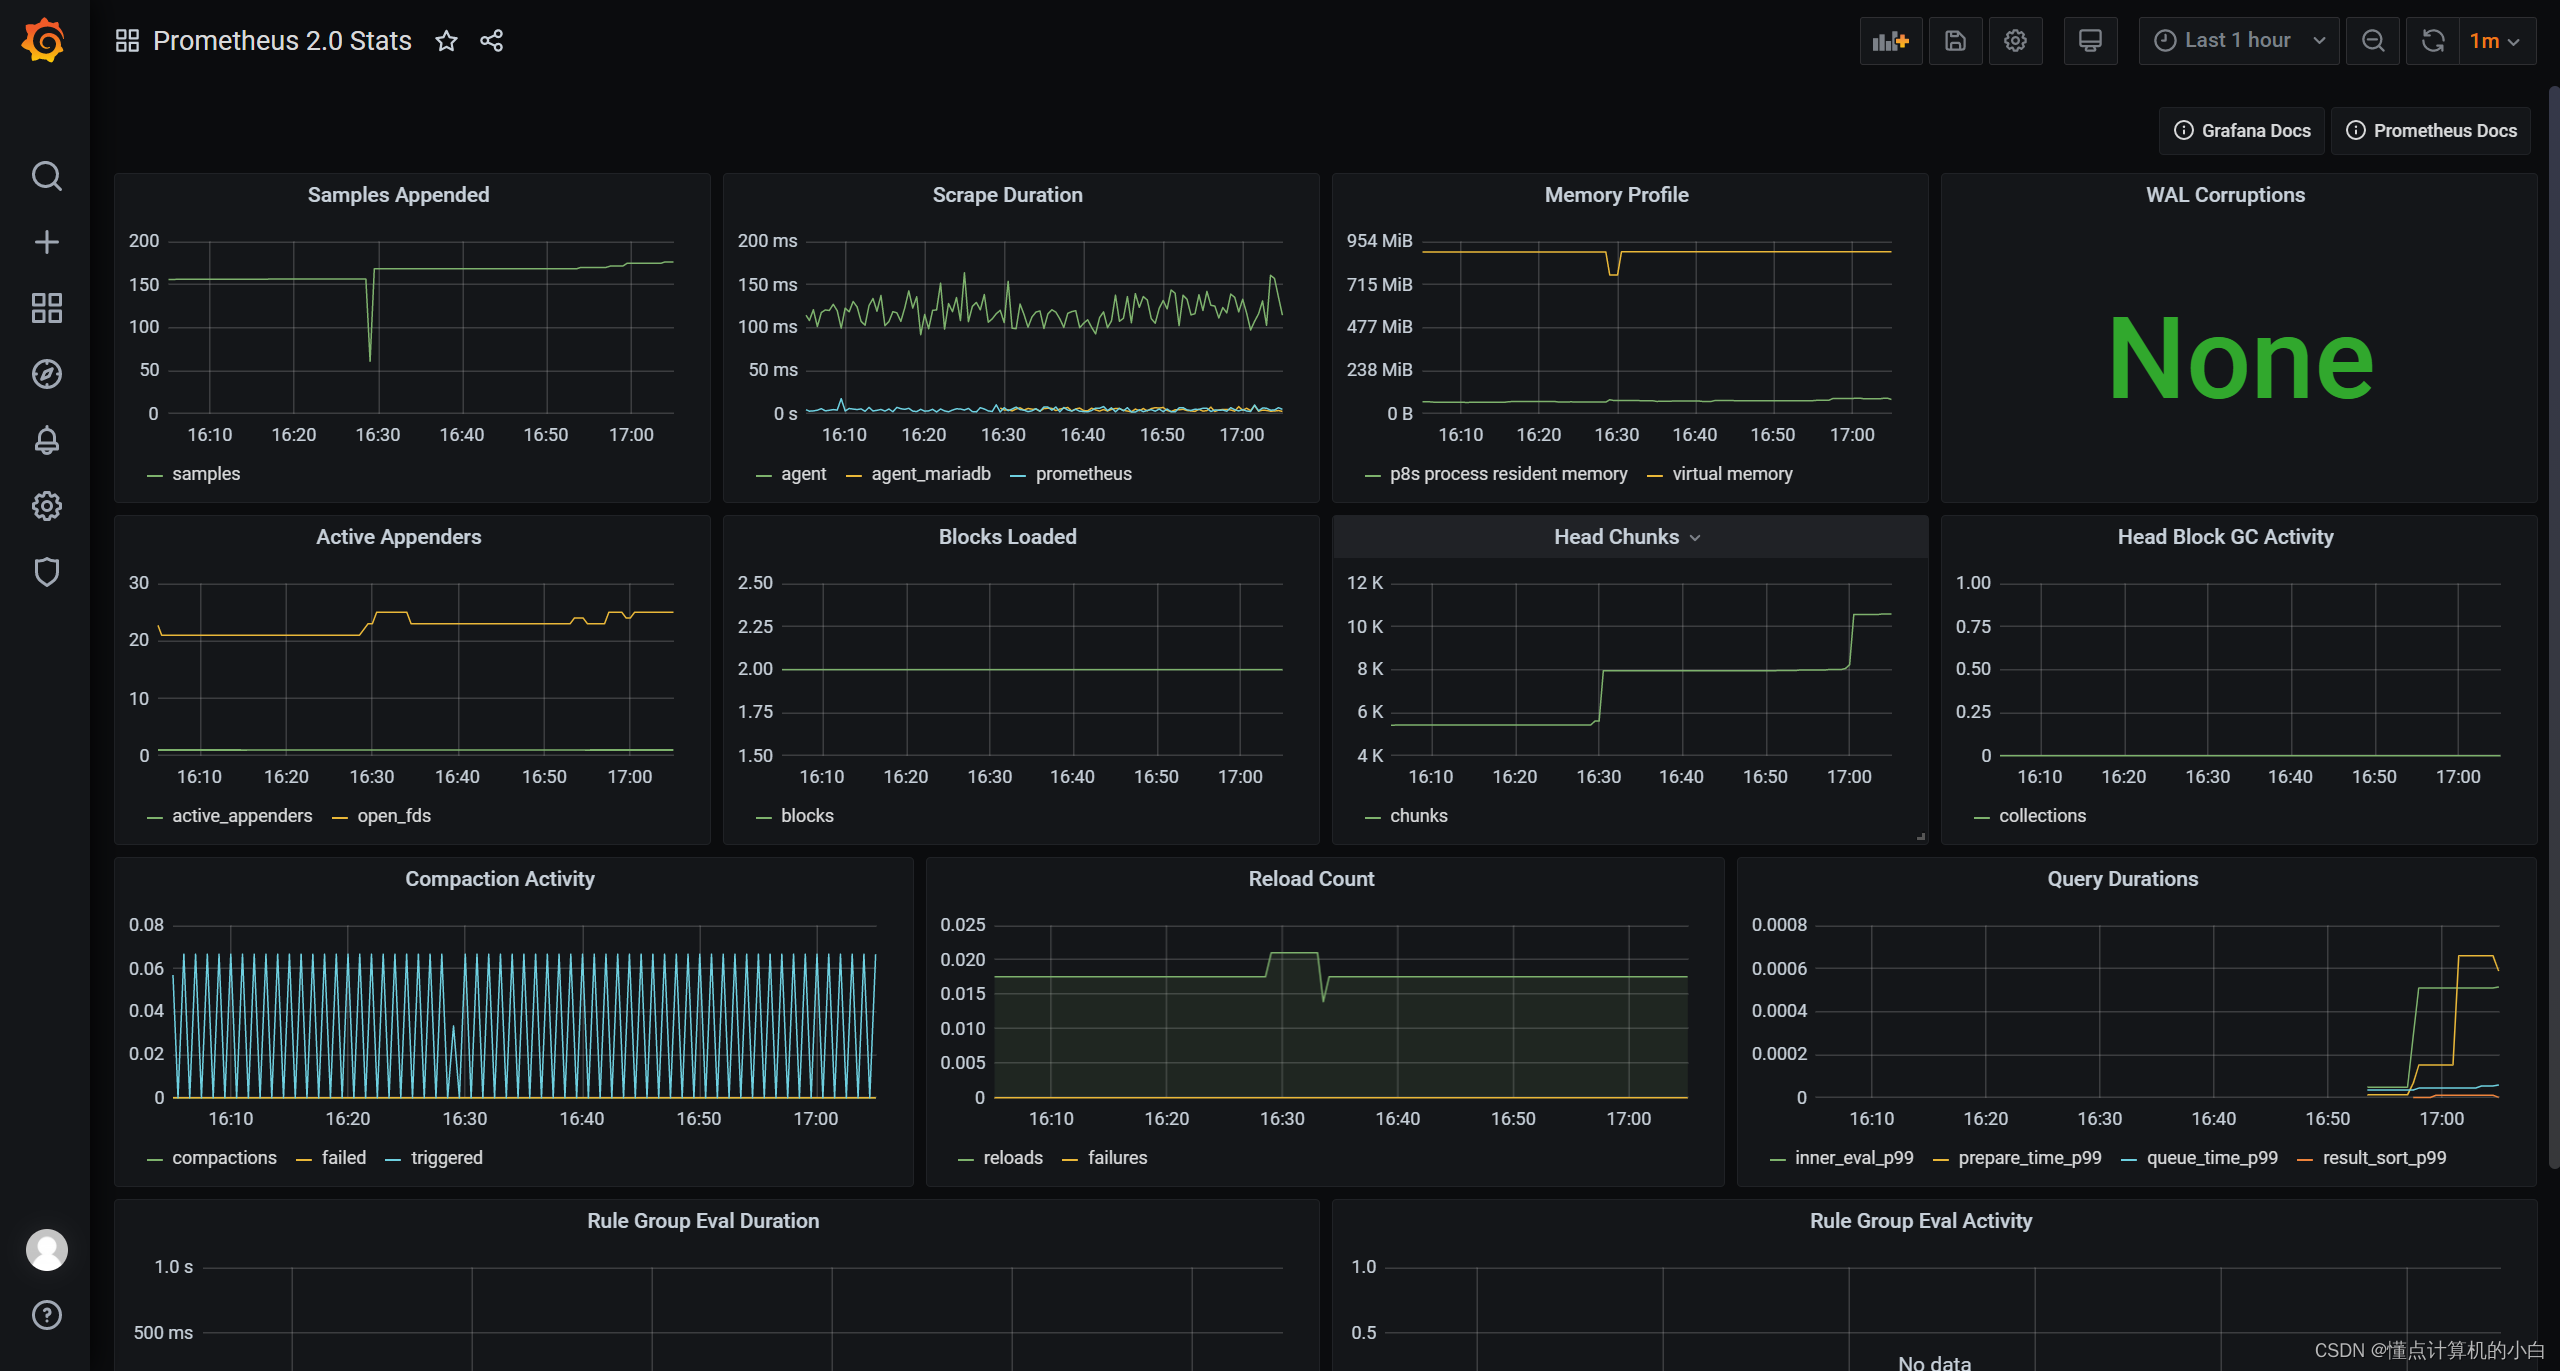
3、导入模板
点击prometheus_data,选择Dashboards


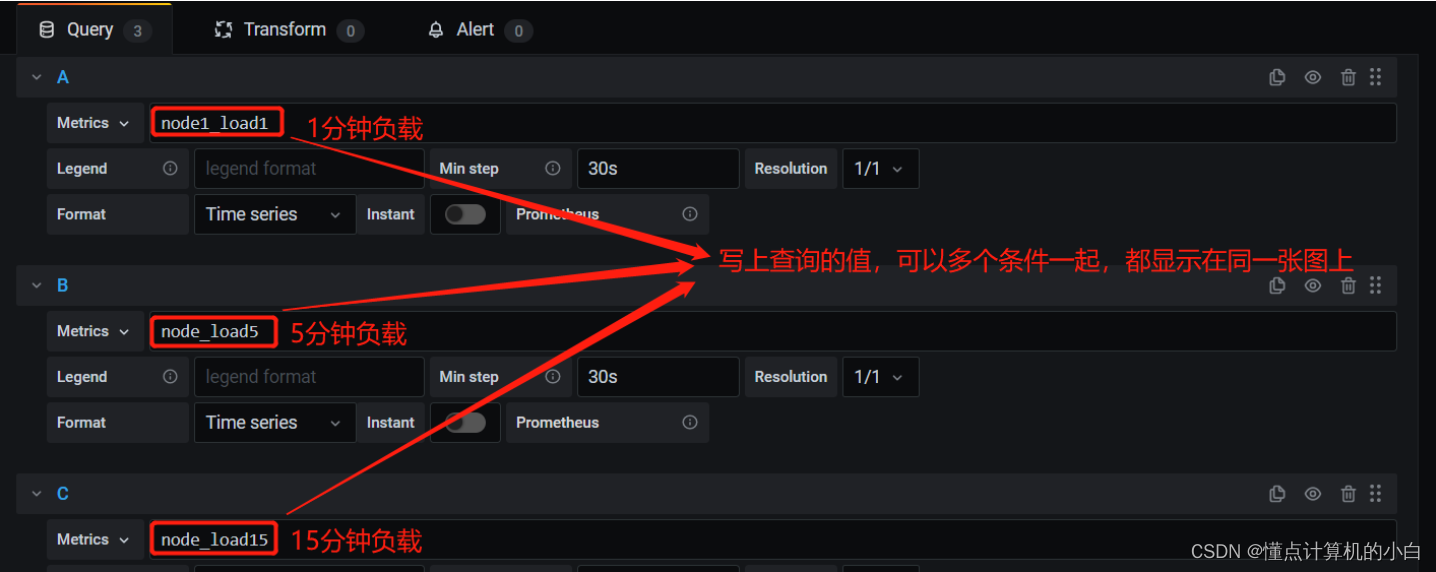
4、为数据源做数据展示

5.配置告警平台
浏览器访问:https://grafana.com/grafana/dashboards ,在页面中搜索 node exporter ,选择适合的面板,点击 Copy ID 或者 Download JSON
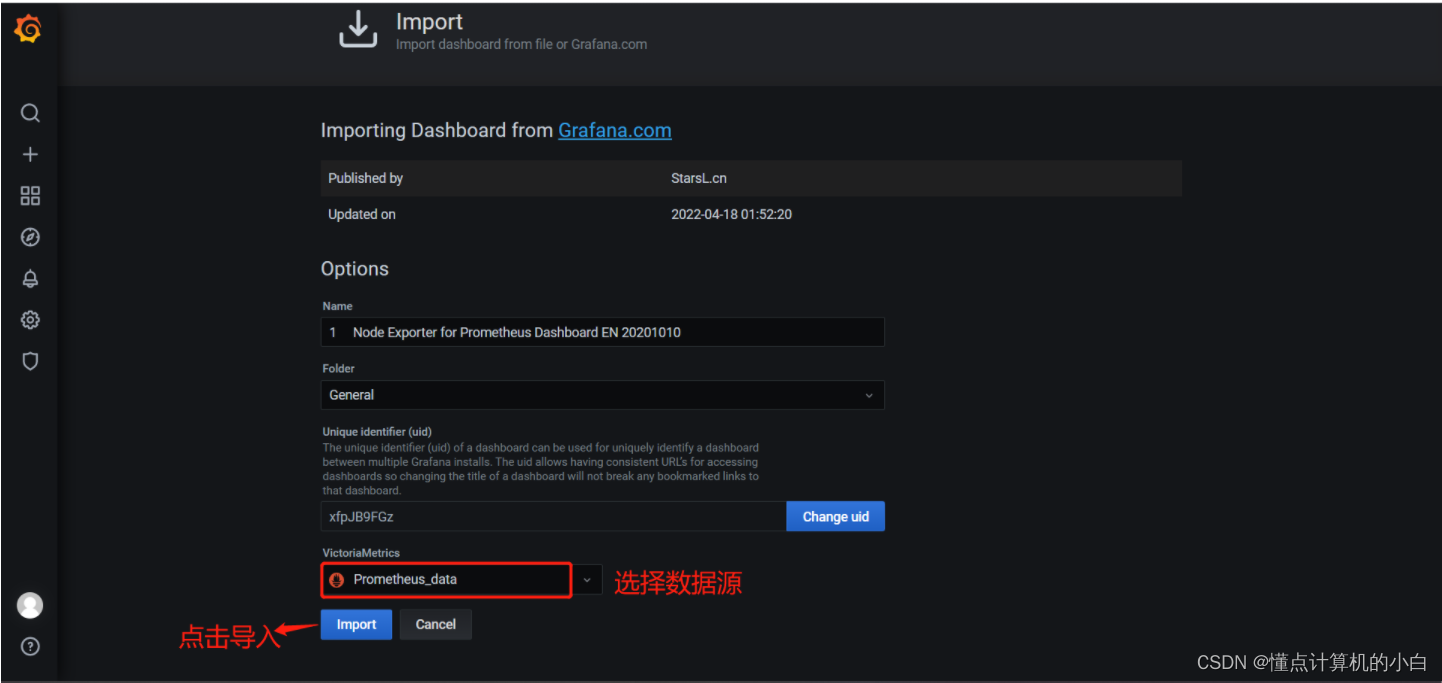
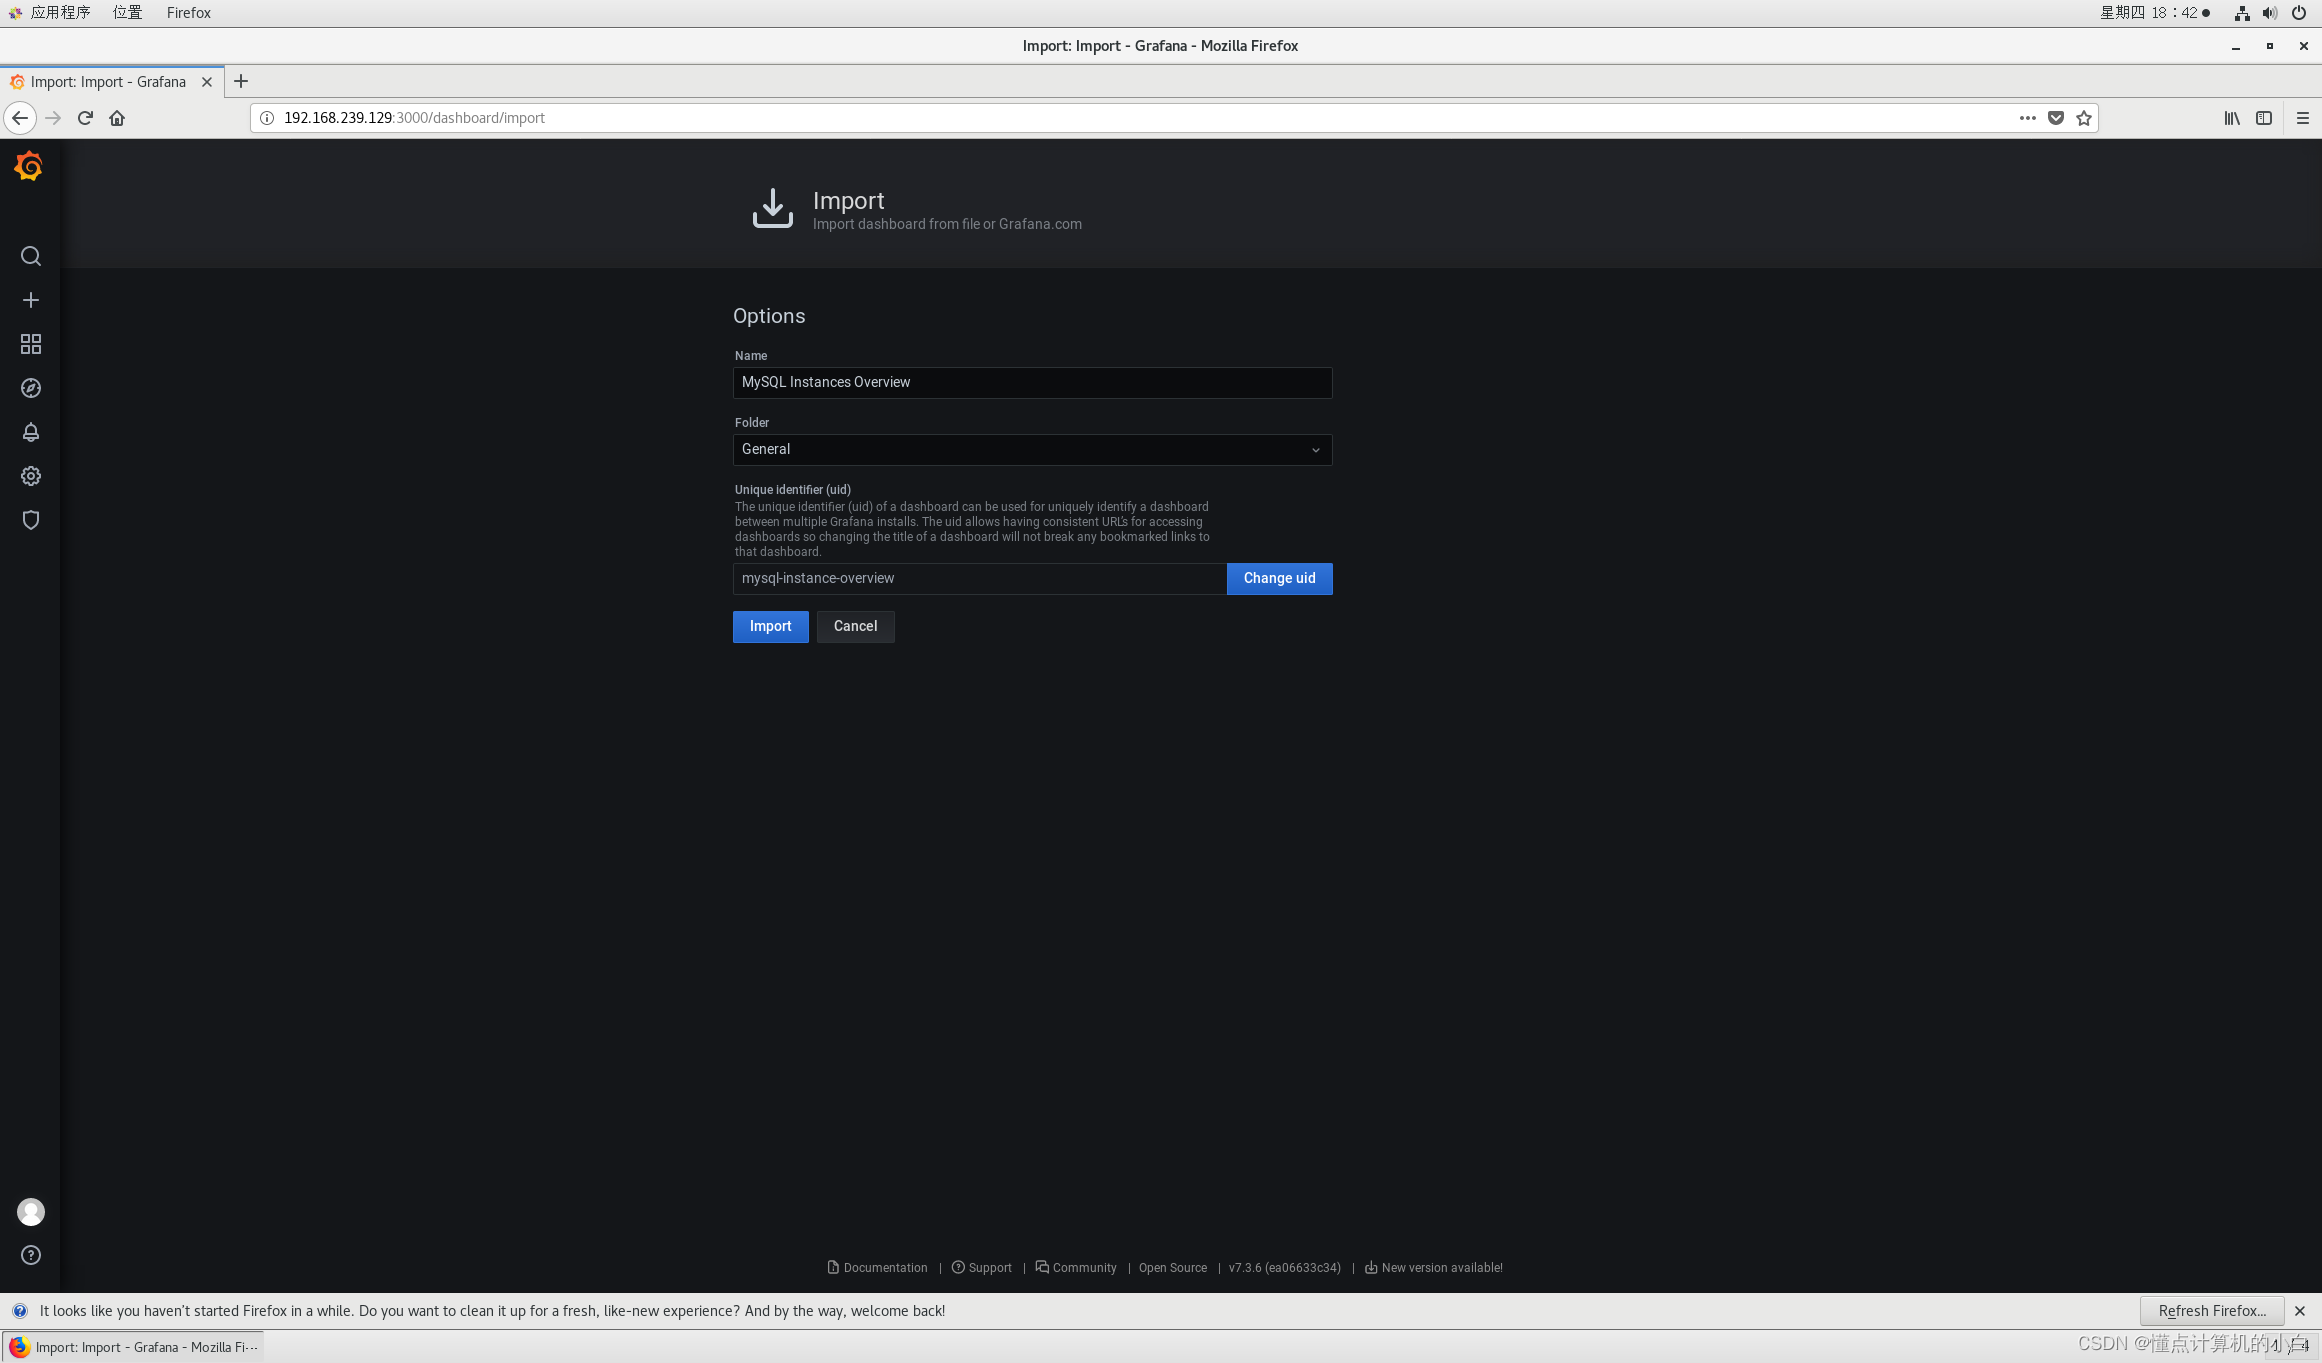
在 grafana 页面中,+ Create -> Import ,输入面板 ID 号或者上传 JSON 文件,点击 Load,即可导入监控面板


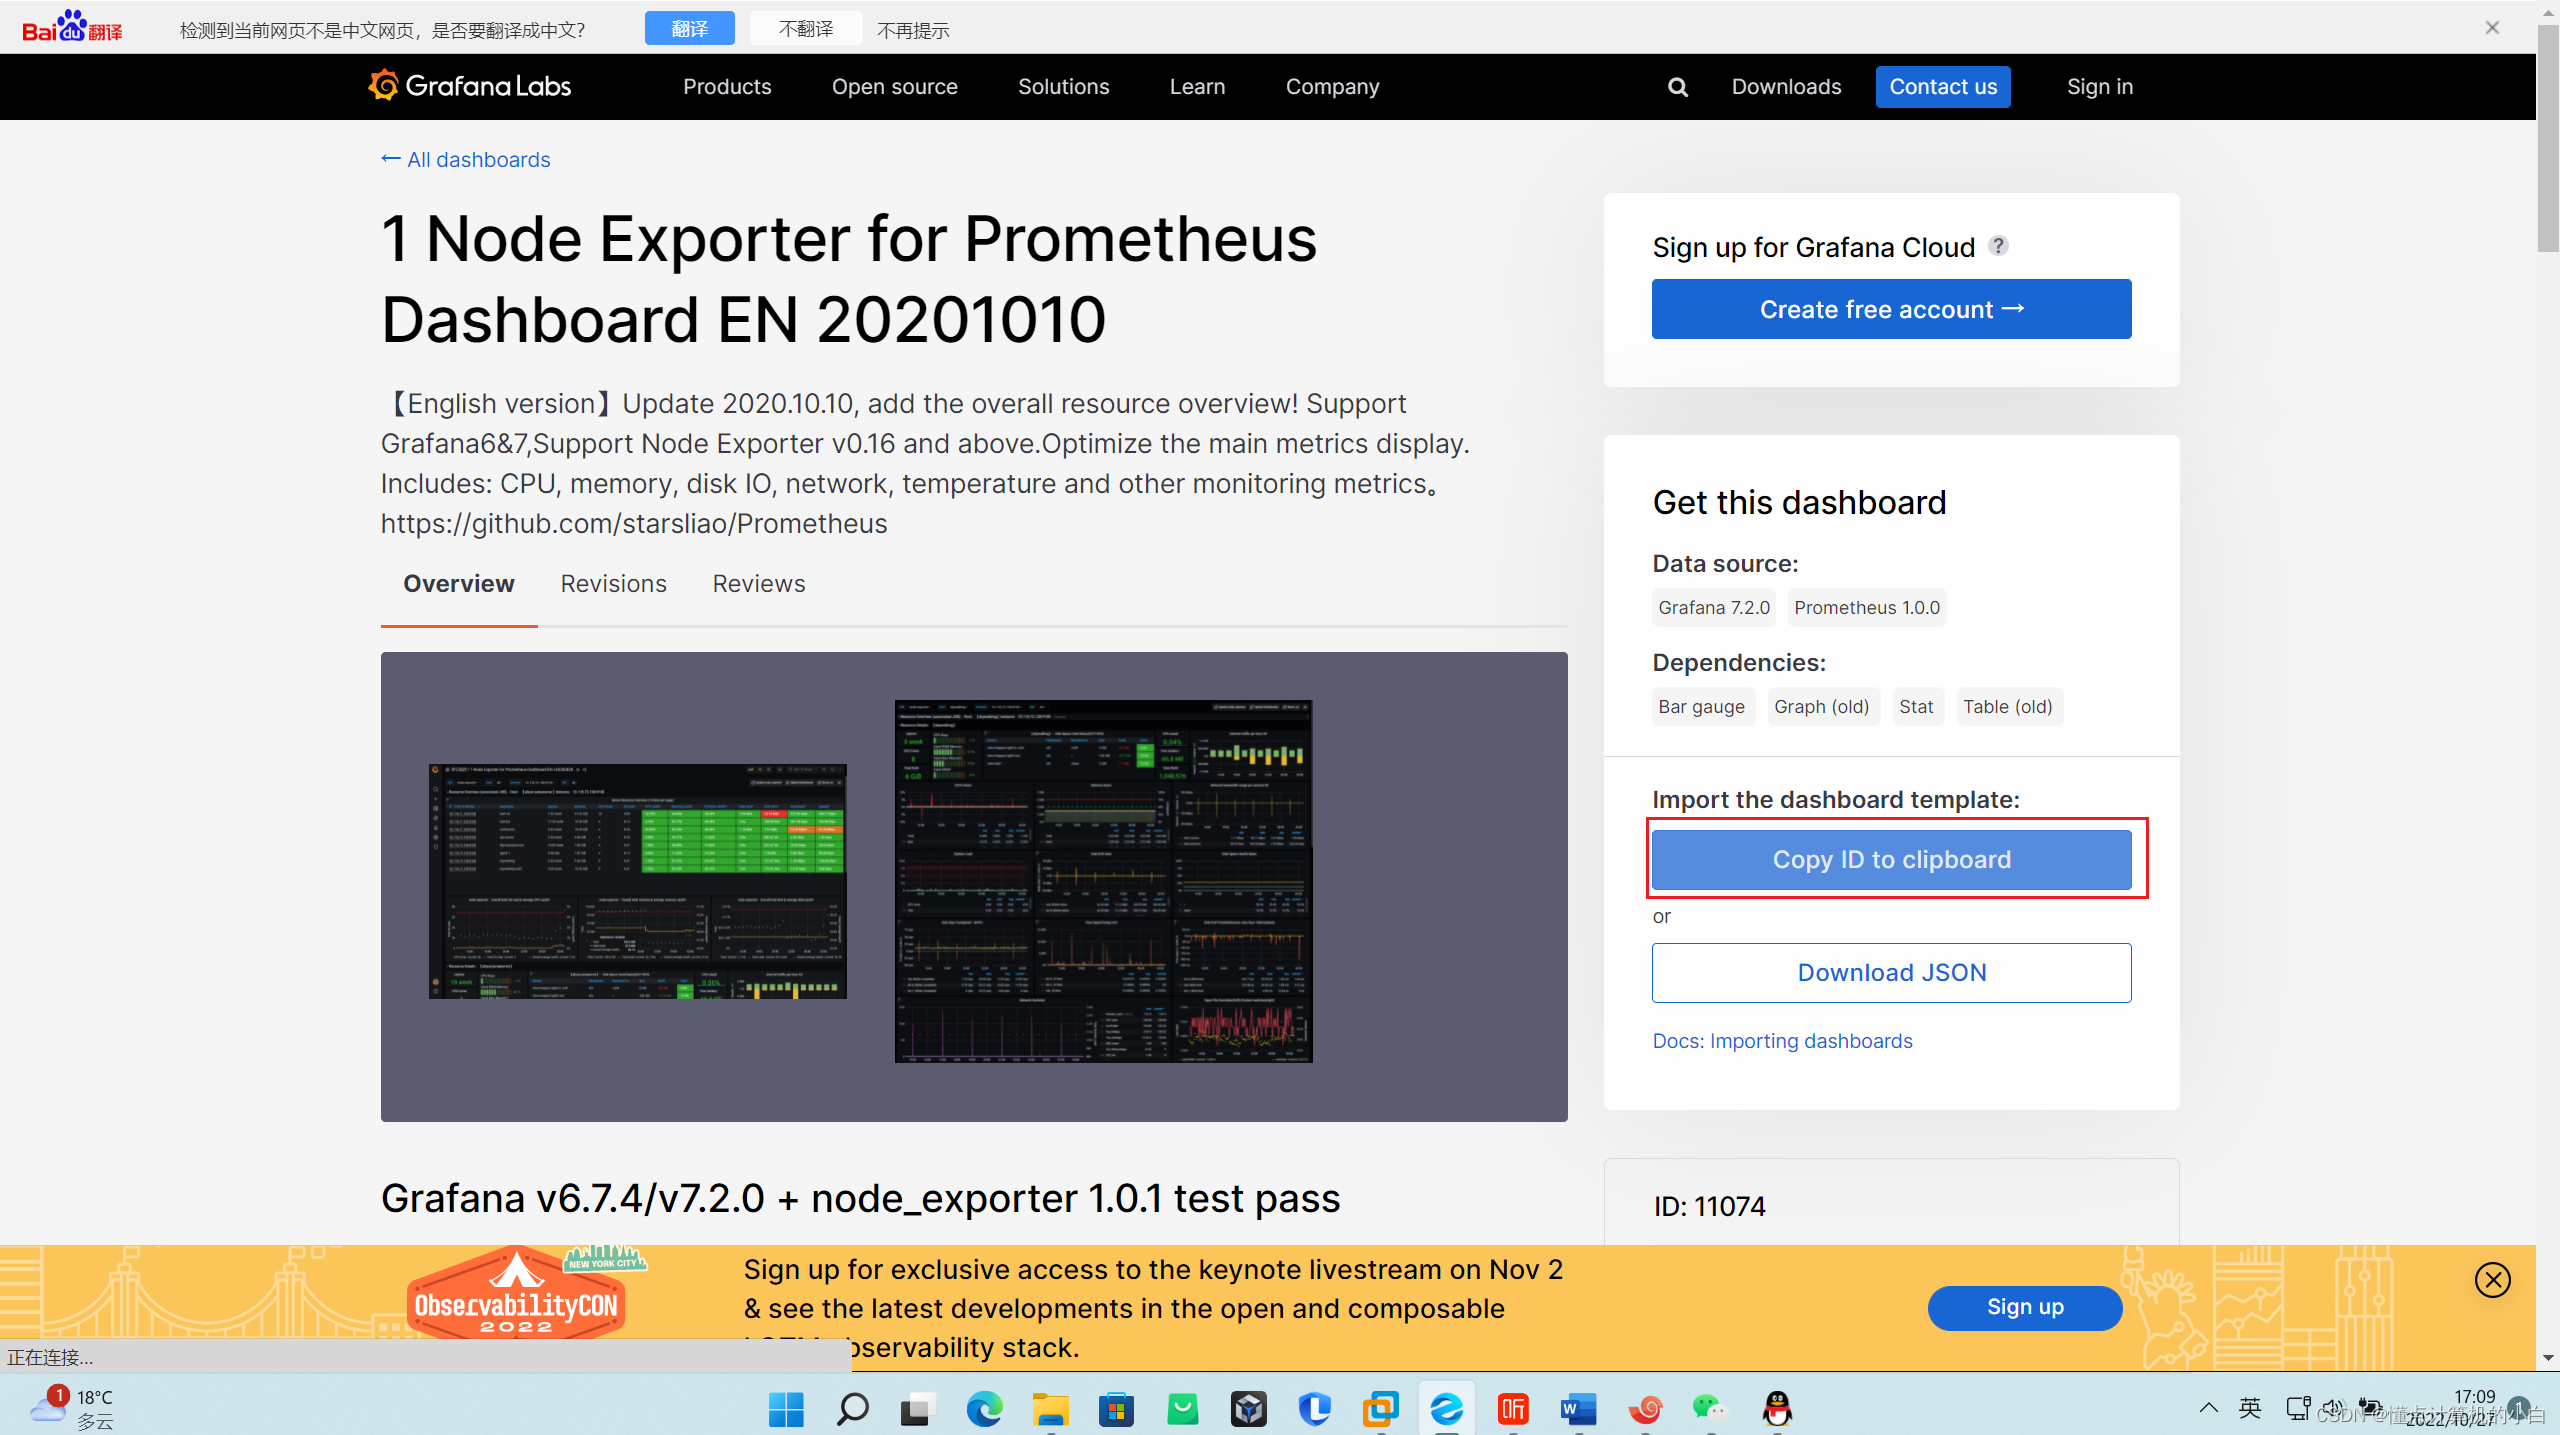
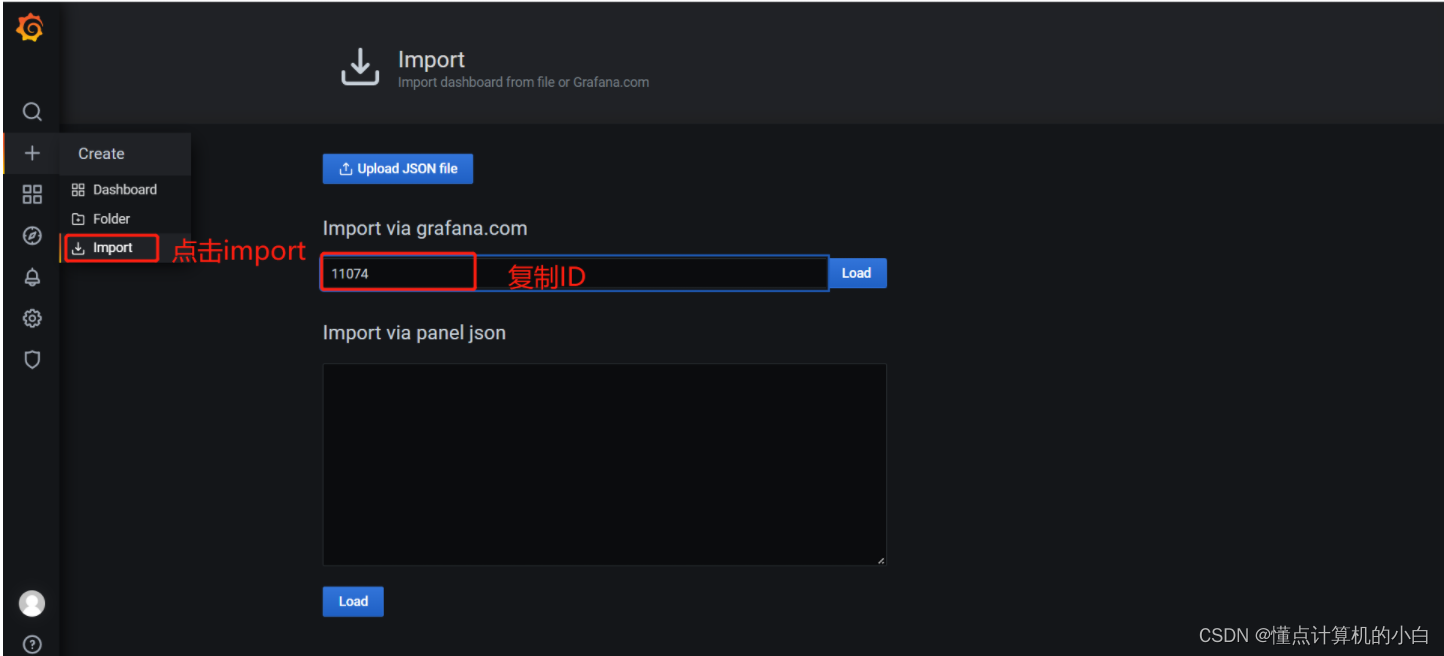
然后点击import导入


可以看出还是使用pro语句来查询的
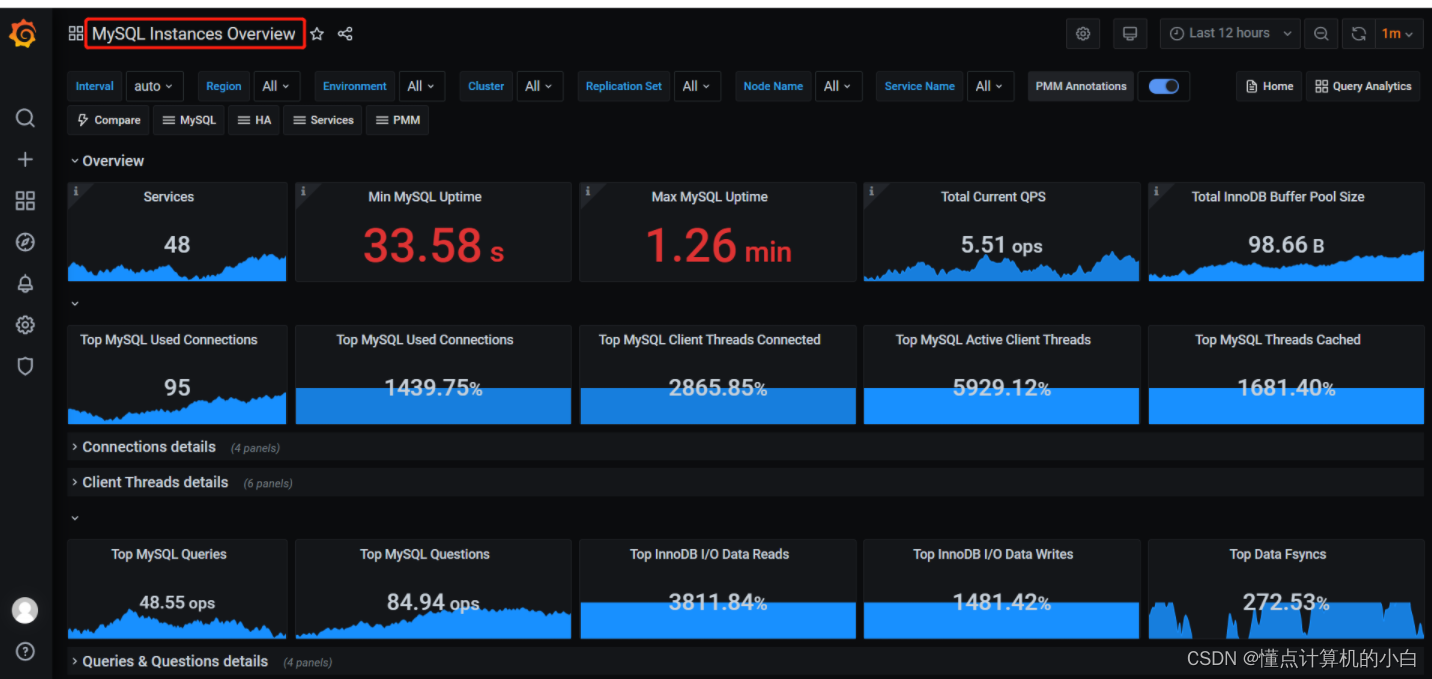
6、Grafana 图形显示 MySQL 监控数据
在 grafana 上修改配置文件,并下载安装 mysql 监控的 dashboard(包含相关 json 文件,这些 json 文件可以看作是开发人员开发的一个监控模板)。
[dashboards.json]
enabled = ture
path = /var/lib/grafana/dashboards

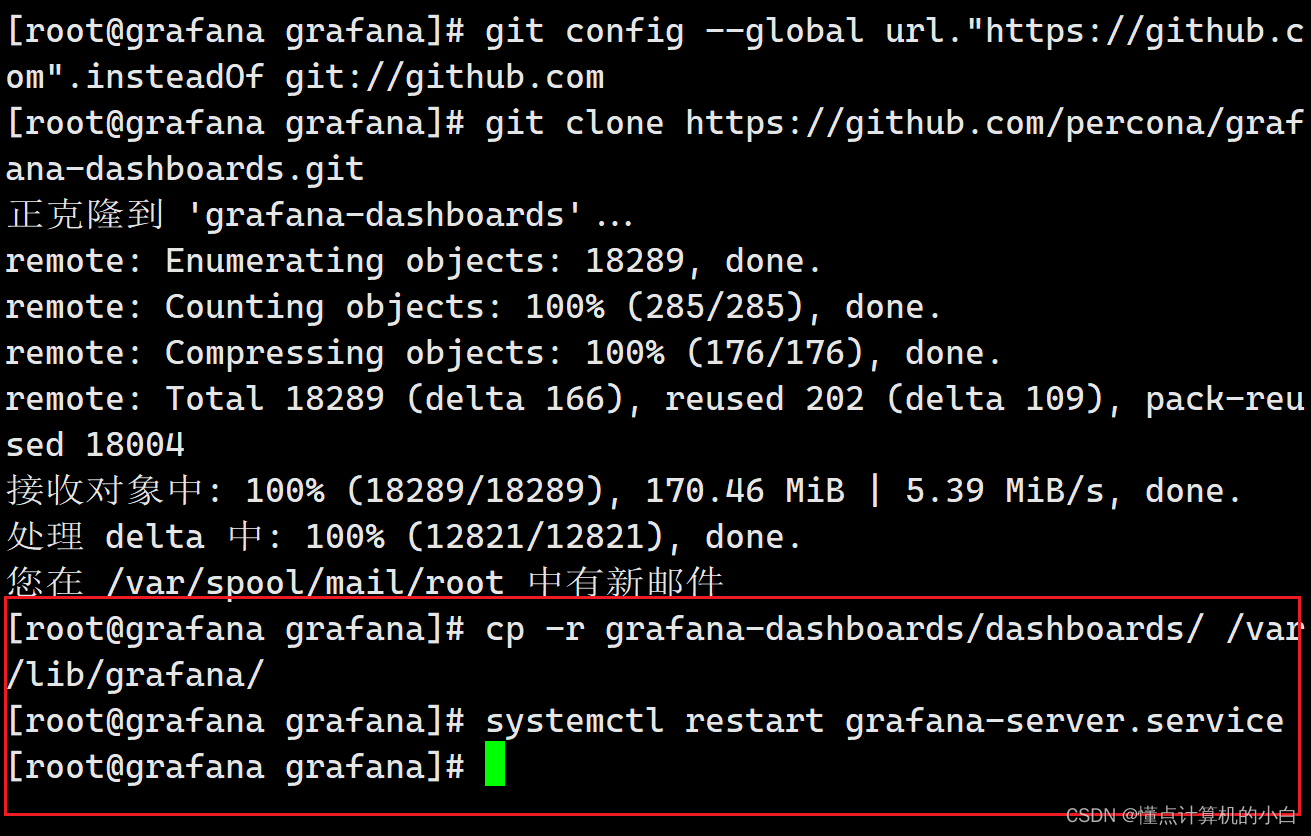
git clone https://github.com/percona/grafana-dashboards.git
这里会报错:
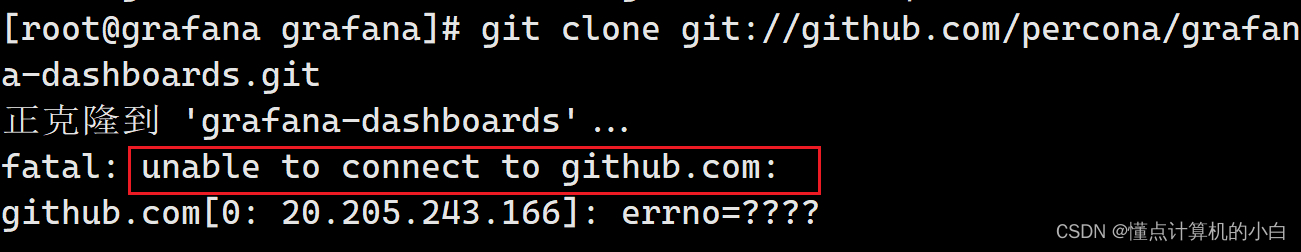
解决方法:
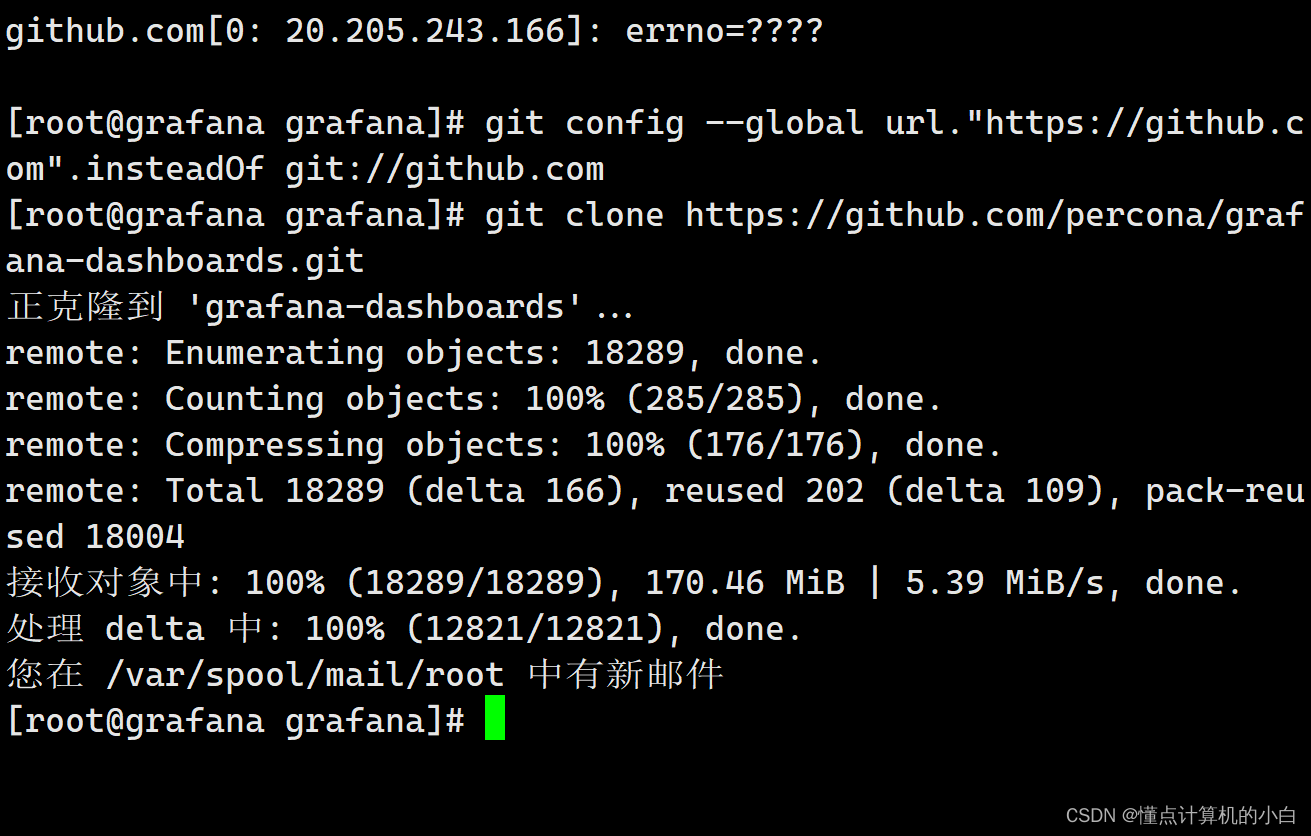
- 将上面的https换成git
- 第一步还是不行的话就输入git config --global url."https://github.com".insteadOf git://github.com让他可以使用http来克隆
cp -r grafana-dashboards/dashboards/ /var/lib/grafana/
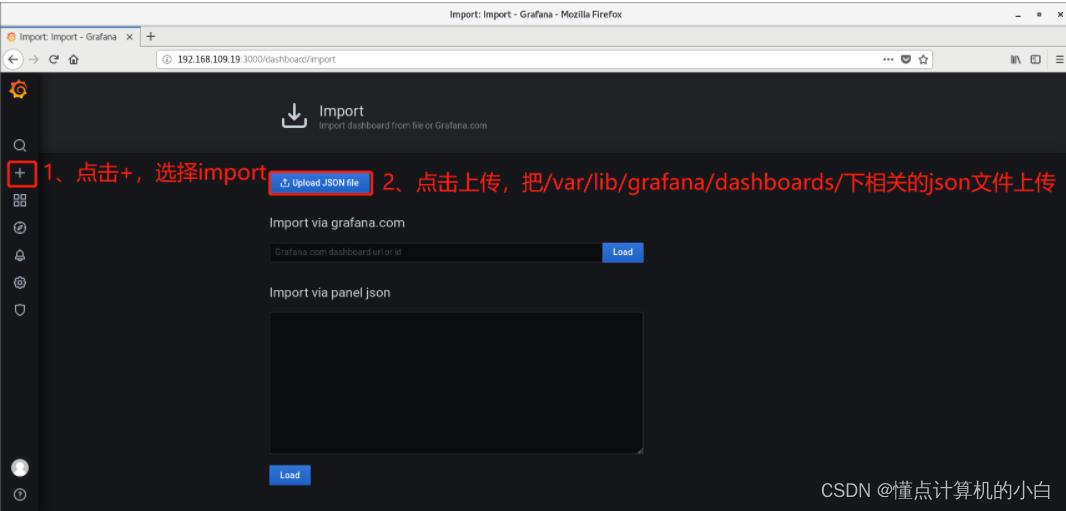


点击import
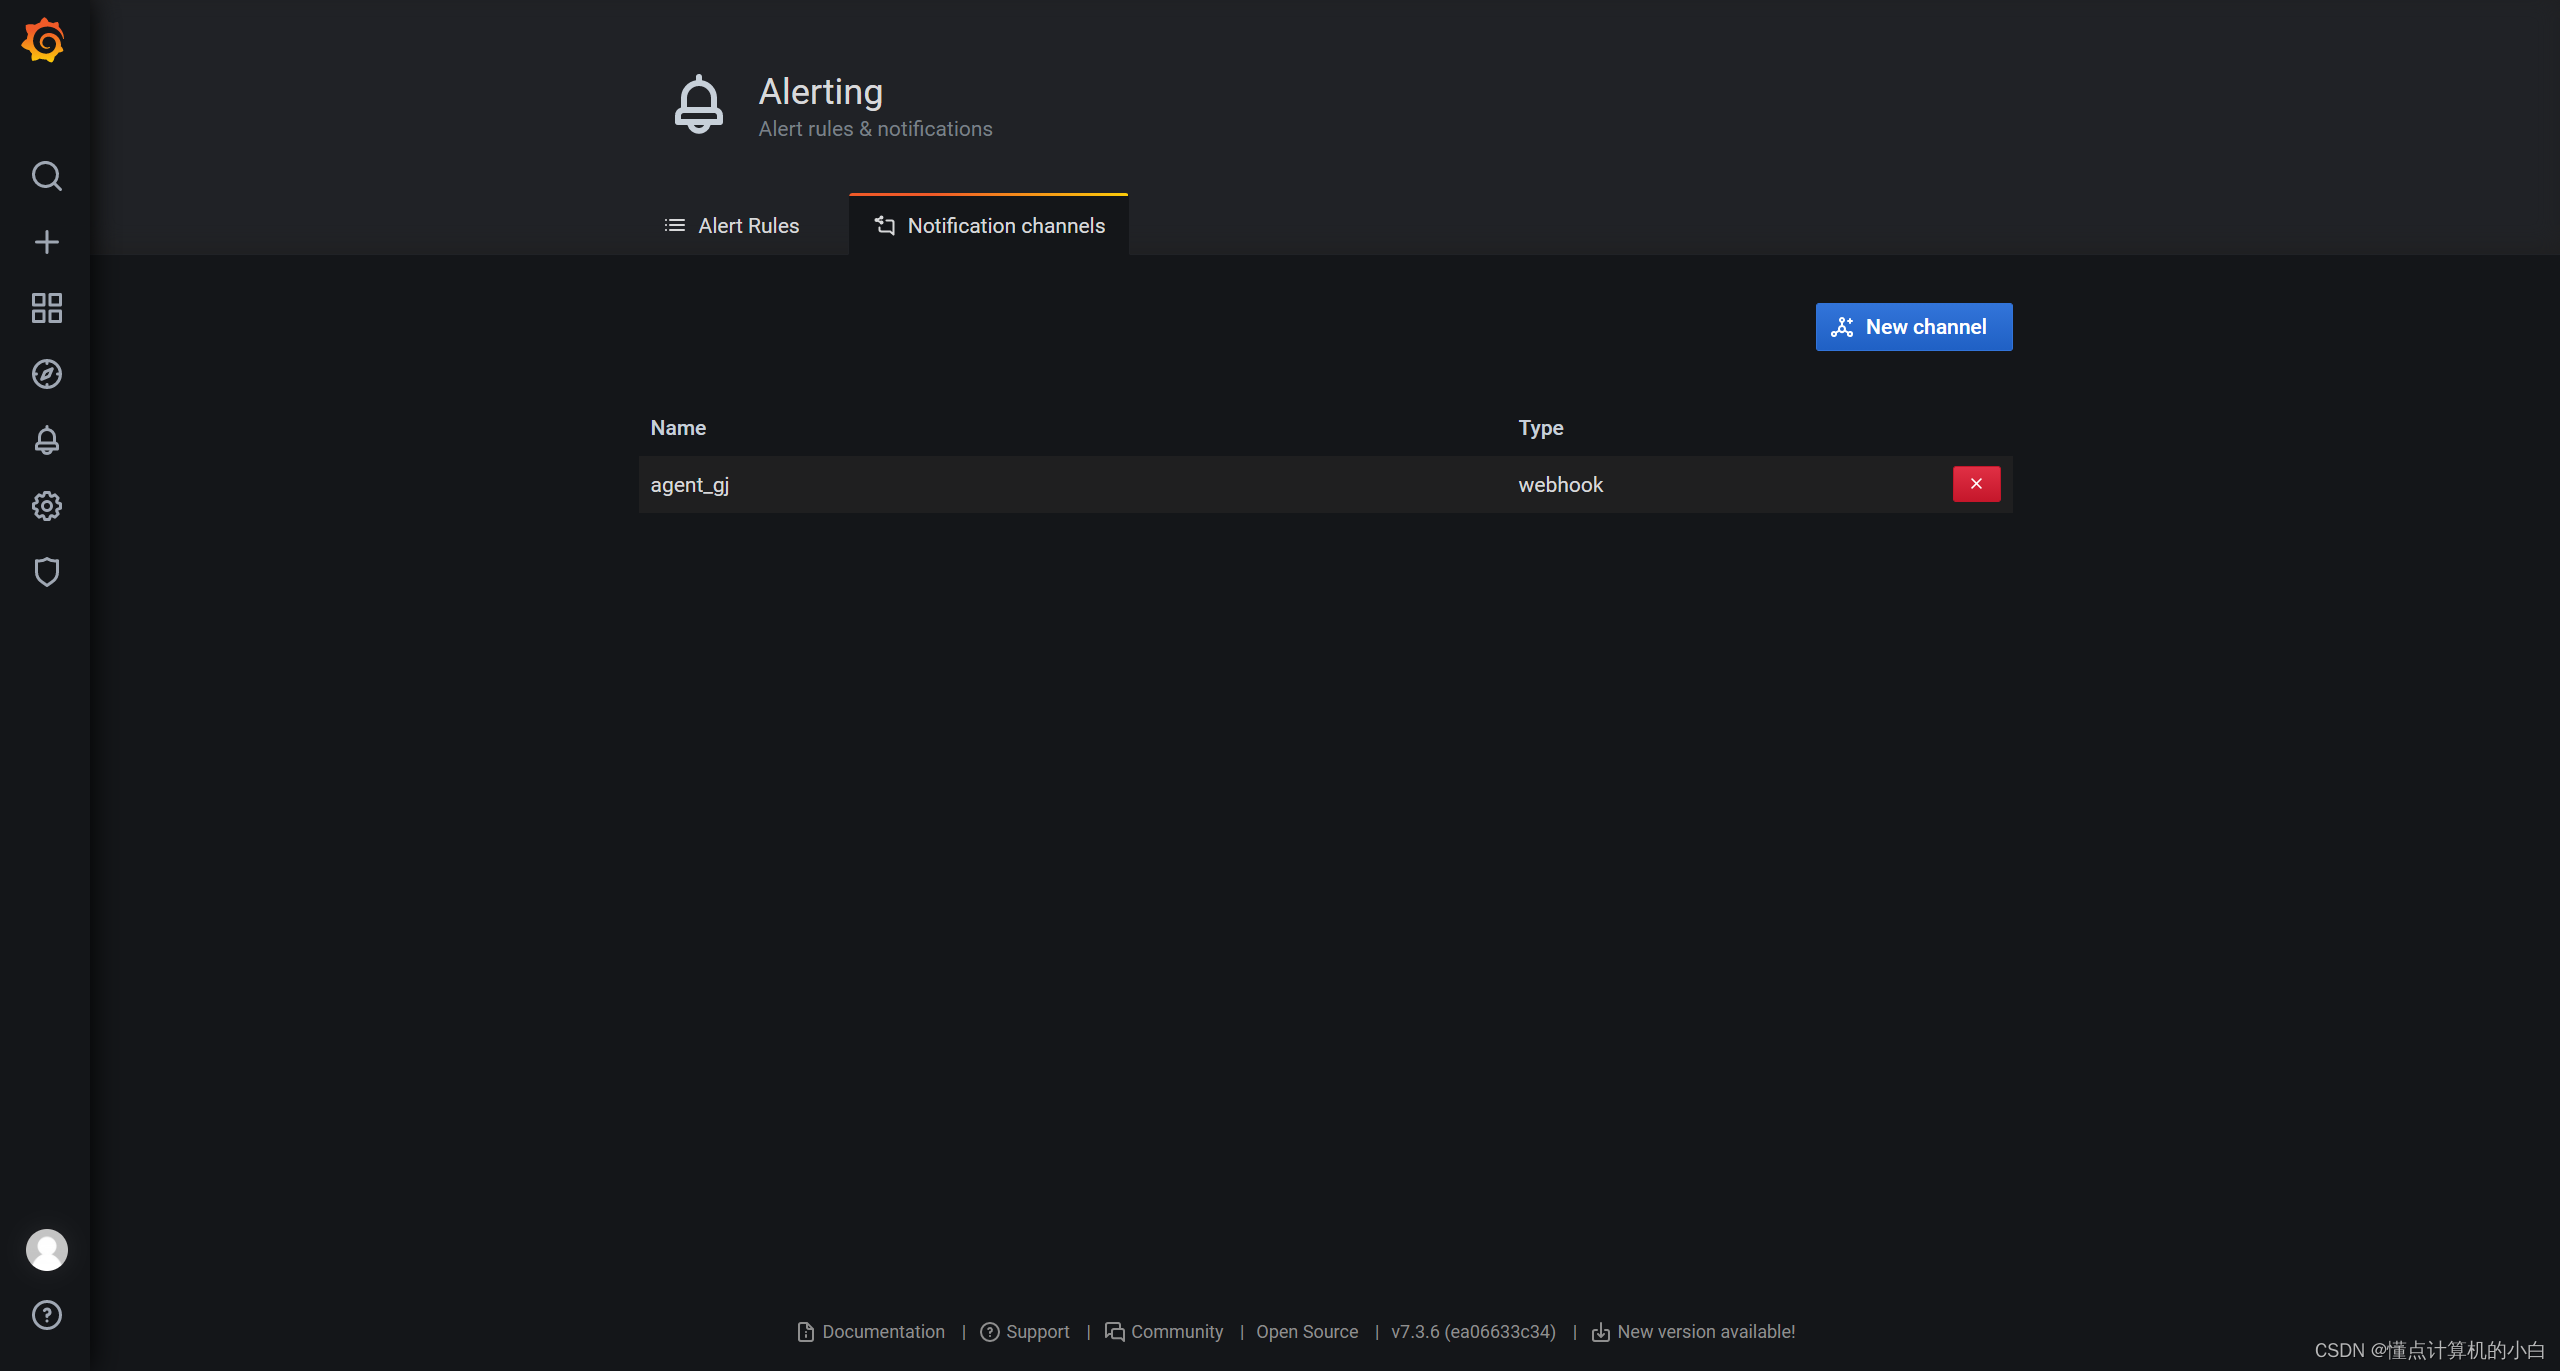
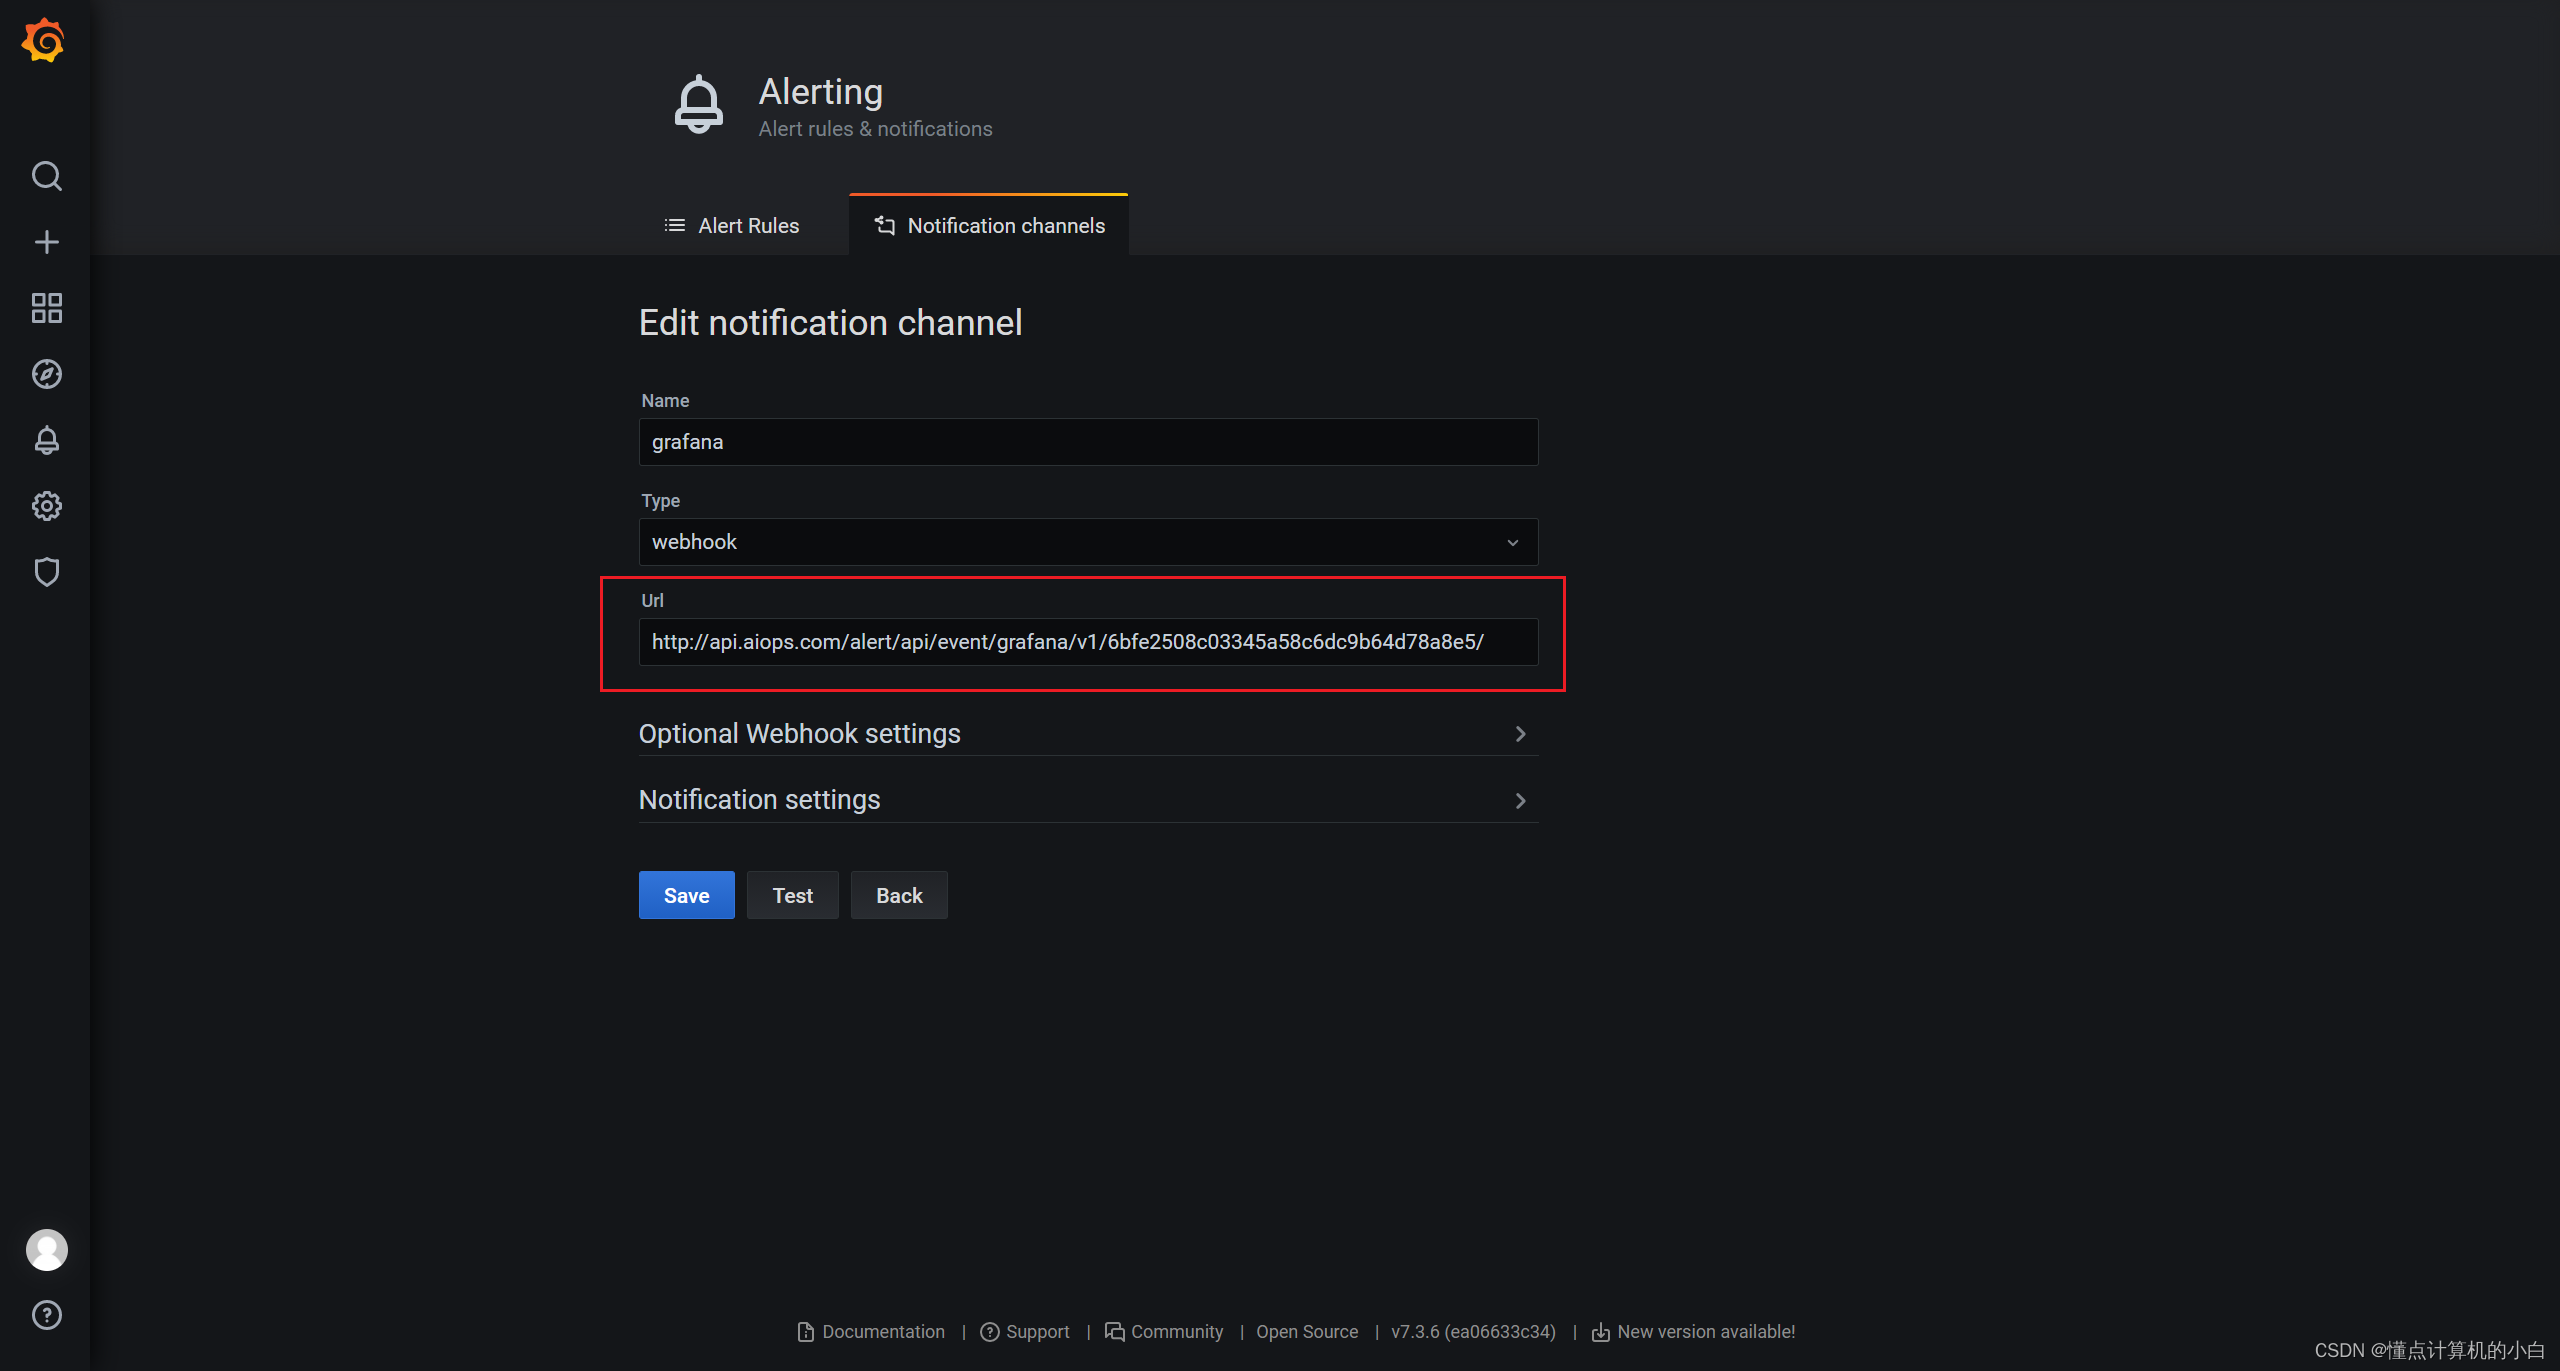
7、Grafana+onealert报警
Prometheus 报警需要使用 alertmanager 这个组件,而且报警规则需要手动编写(对运维来说不友好)。所以我这里选用 grafana+onealert 报警。注意:实现报警前把所有机器时间同步再检查一遍。
登陆http://www.onealert.com/→注册帐户→登入后台管理


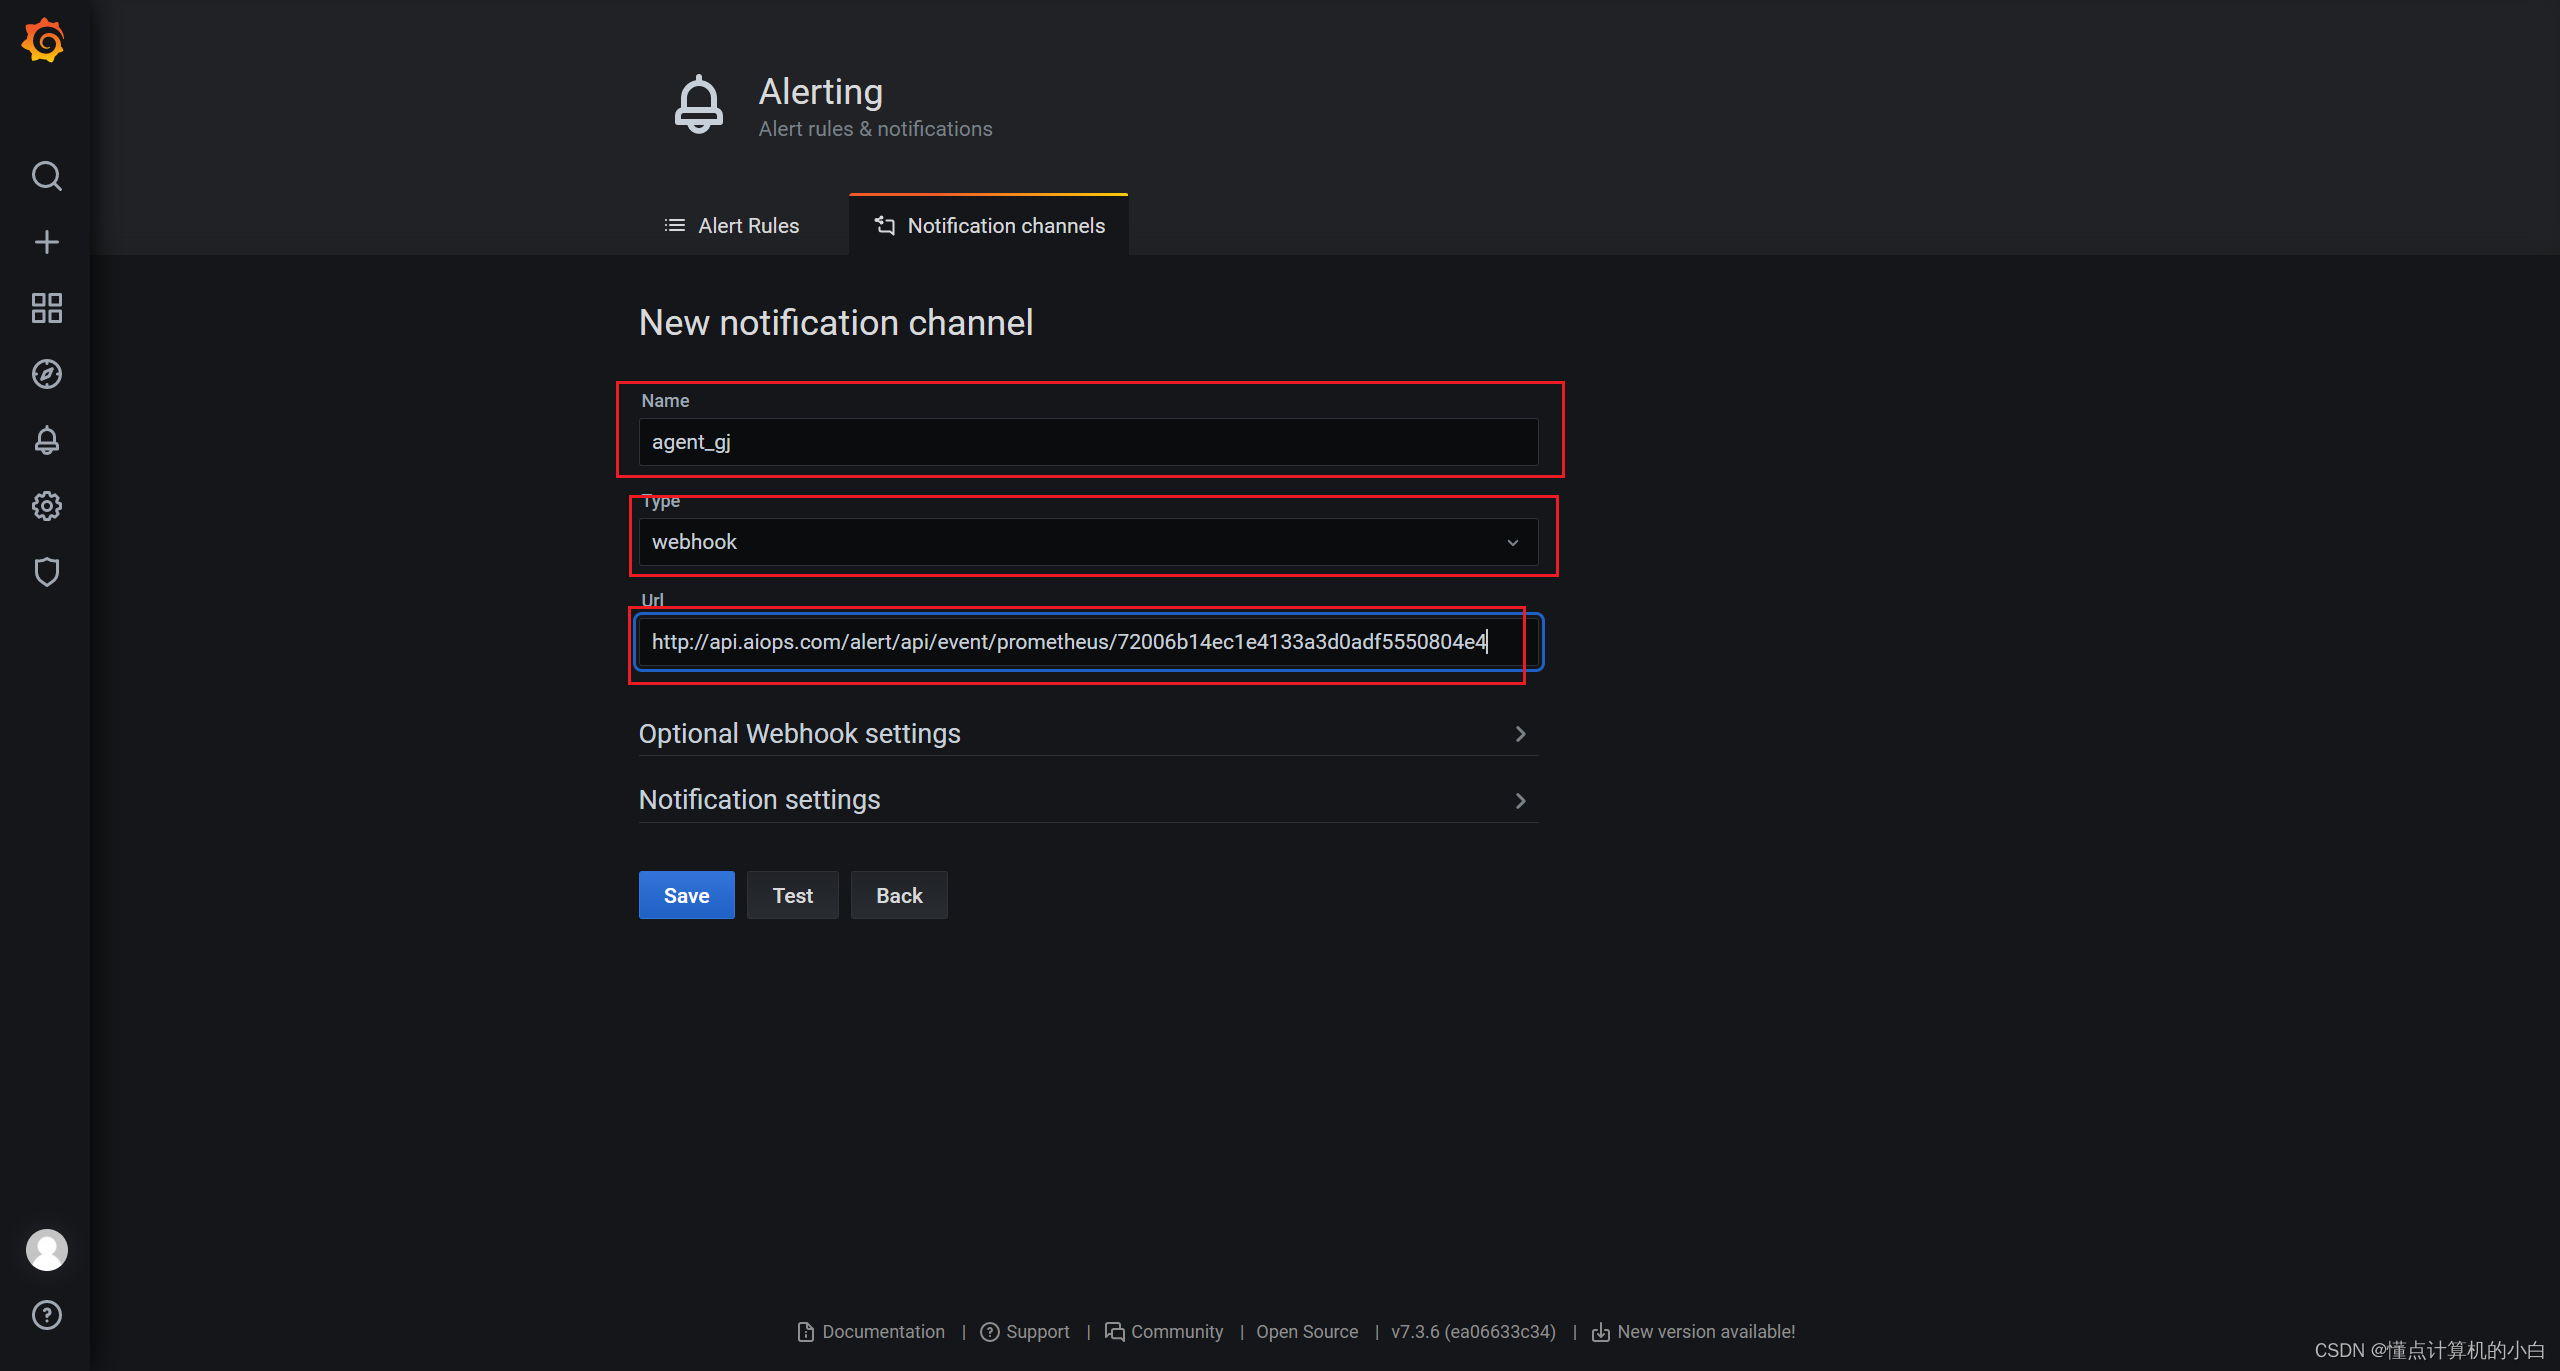
receivers:
- name: 'team-X-pager'
webhook_configs:
url: 'http://api.aiops.com/alert/api/event/prometheus/72006b14ec1e4133a3d0adf5550804e4' (保存当前应用,即可获取完整webhook地址信息)
send_resolved: true
7.2 测试CPU负载告警
现在可以去设置一个报警来测试
(1- ((sum(increase(node_cpu_seconds_total{mode="idle"}[1m])) by(instance)) / (sum(increase(node_cpu_seconds_total[1m])) by(instance))))*100
这里分享一个pro语句
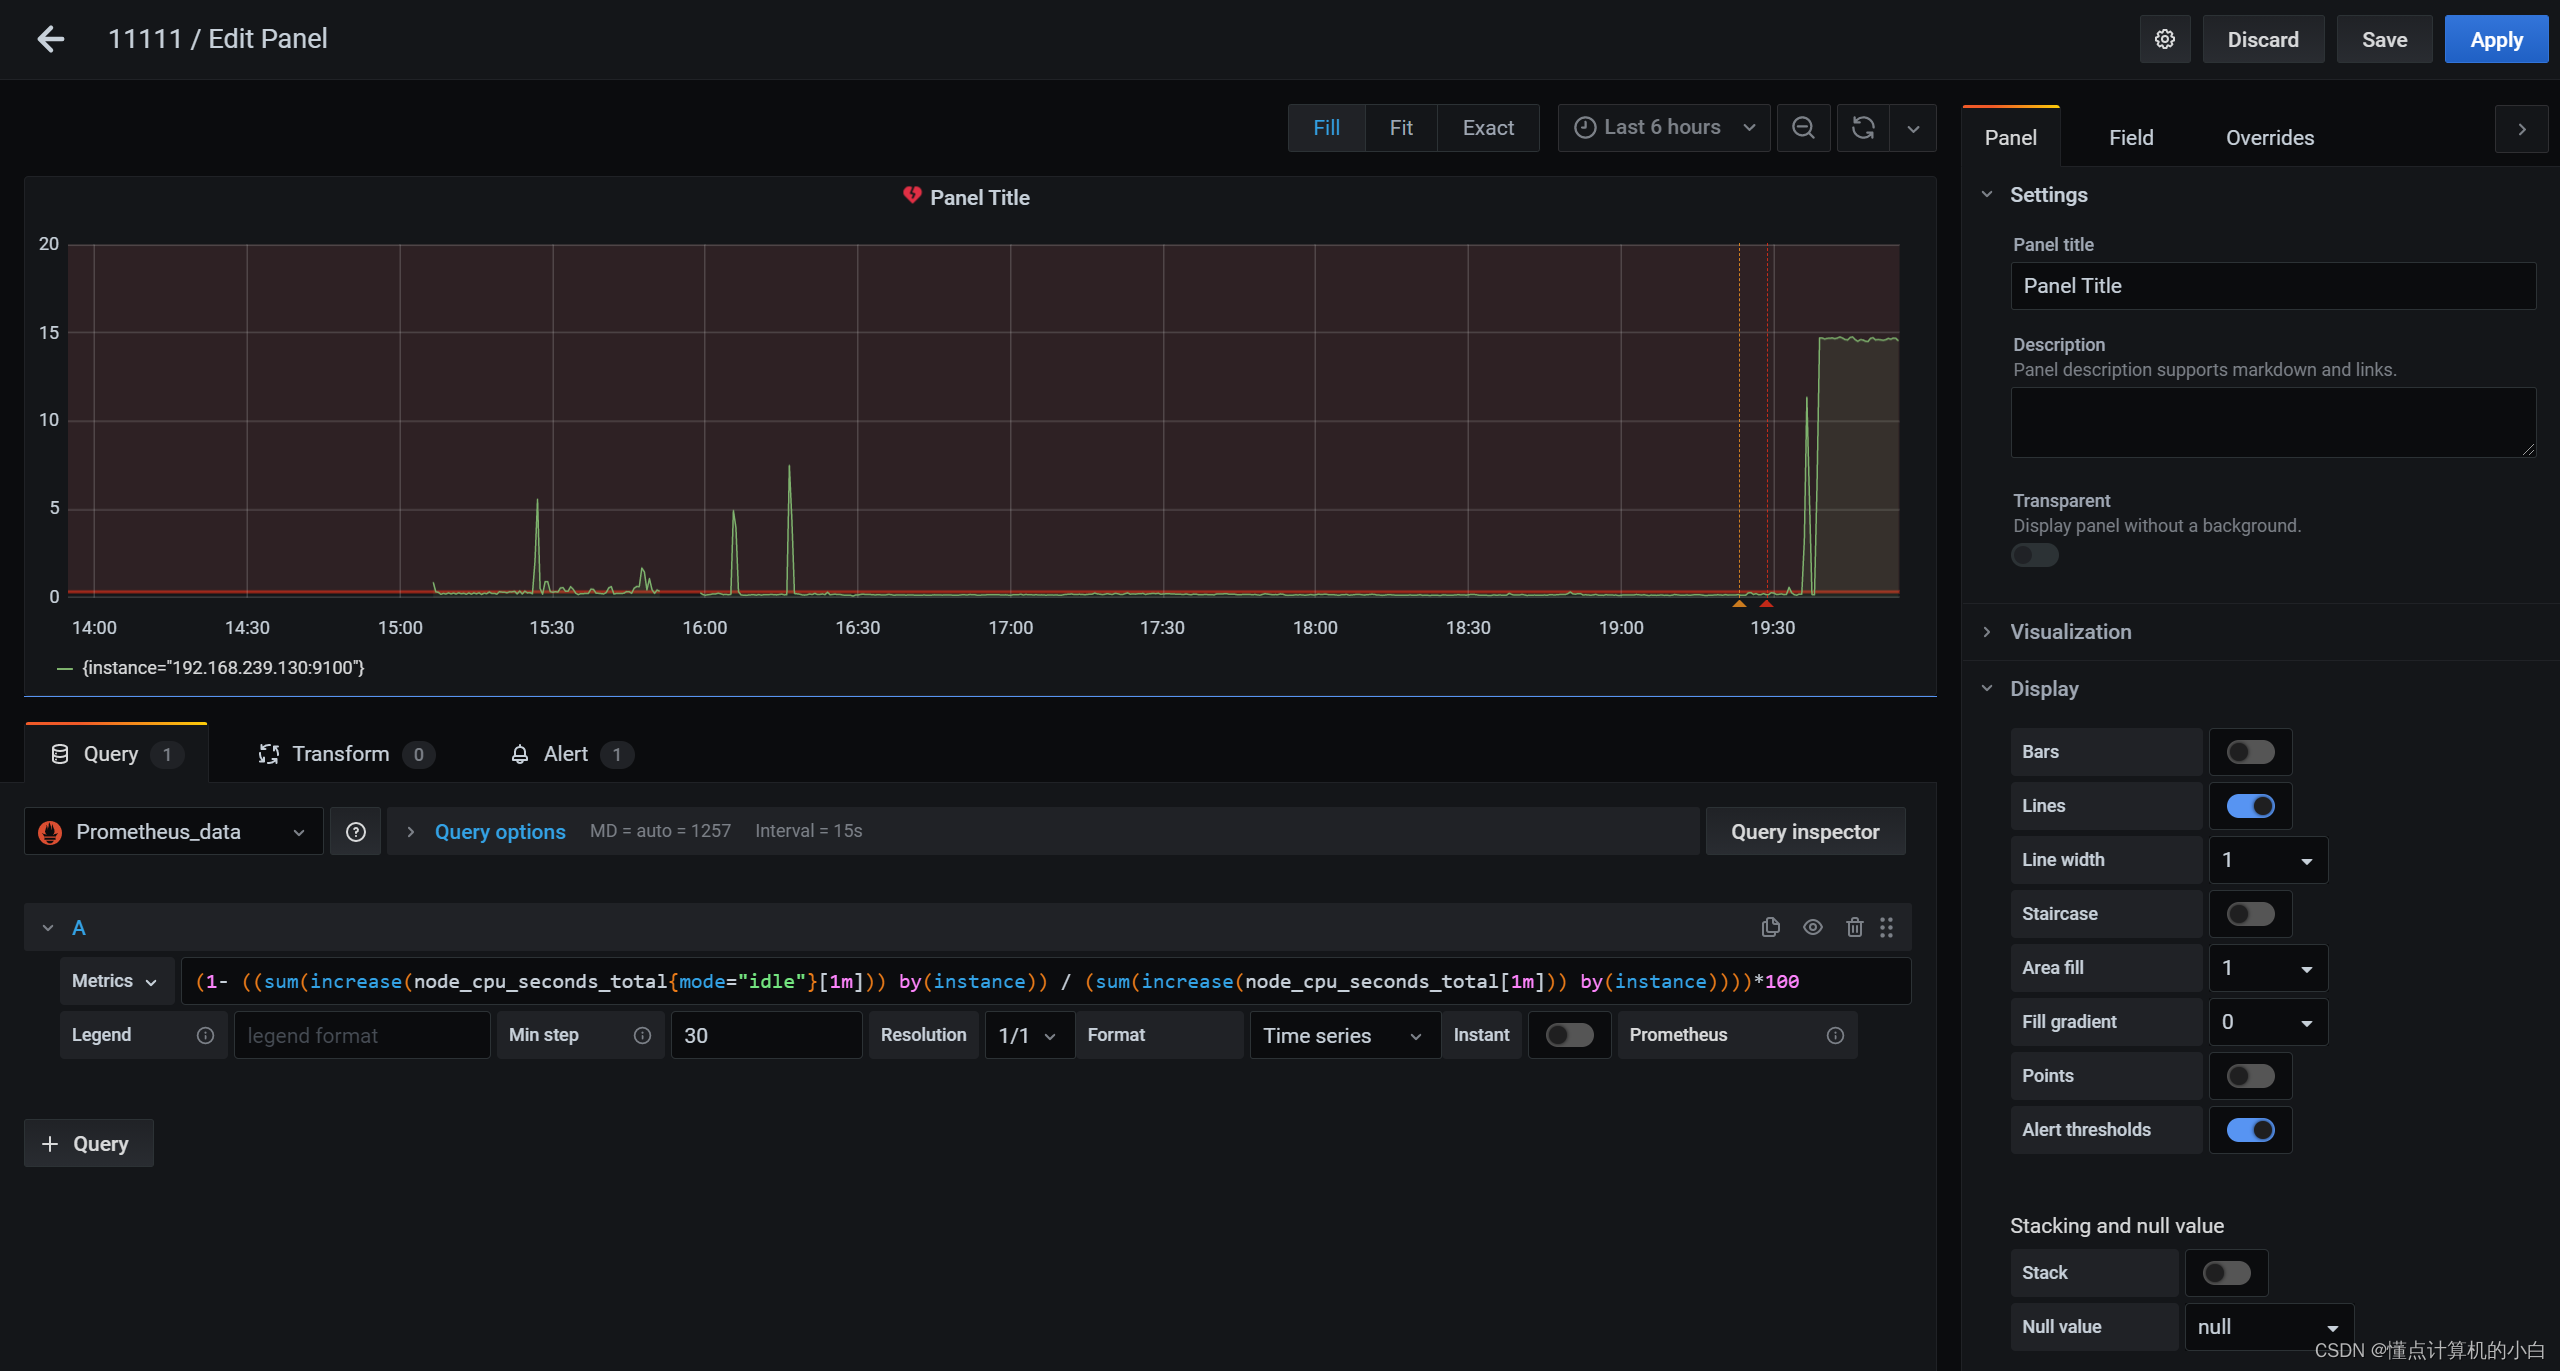

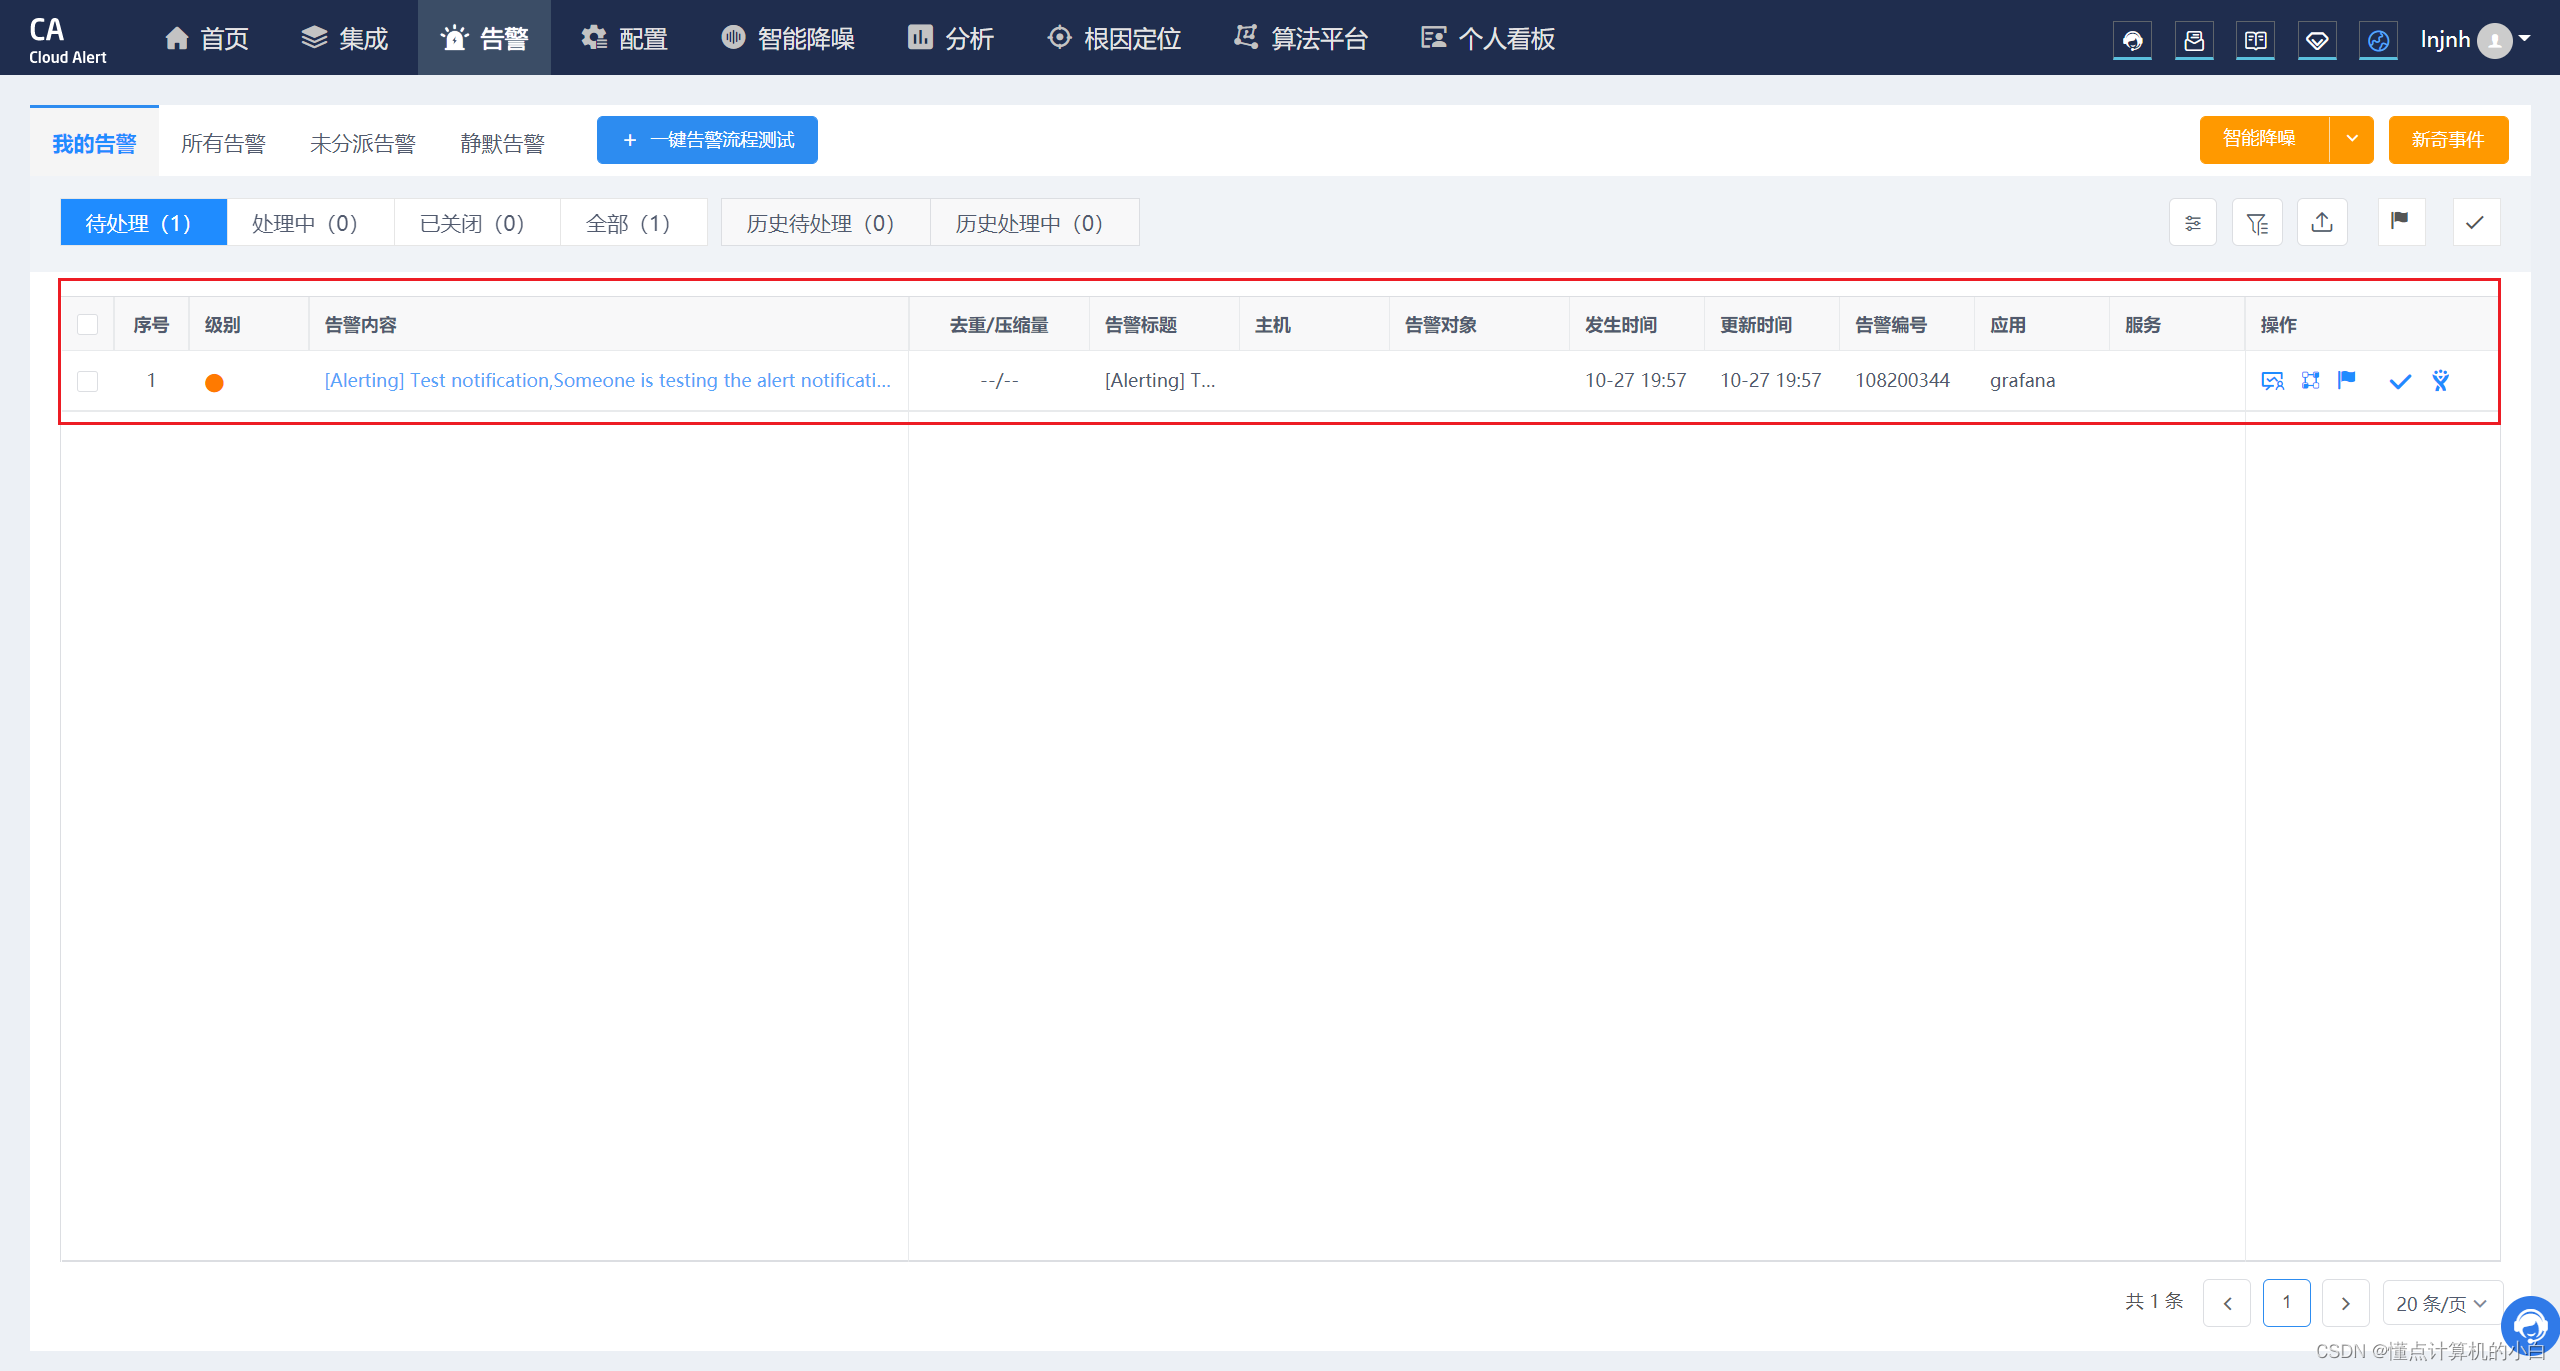
接下来就是等待告警平台给你的邮箱发送告警信息
非常不智能等了好久


![[深度学习] 名词解释--正则化](https://img-blog.csdnimg.cn/f46550436a4a48049d6926878fbbb316.png)