rometheus 是 Google 内部监控报警系统的开源版本,是 Google SRE 思想在其内部不断完善的产物,它的存在是为了更快和高效的发现问题,快速的接入速度,简单灵活的配置都很好的解决了这一切,而且是已经毕业的 CNCF 项目。
1、下载https://prometheus.io/download/
2、运行
解压后进入目录
编辑prometheus.yml
# my global config
global:
  scrape_interval:     15s # Set the scrape interval to every 15 seconds. Default is every 1 minute.
  evaluation_interval: 15s # Evaluate rules every 15 seconds. The default is every 1 minute.
  # scrape_timeout is set to the global default (10s).

# Alertmanager configuration
alerting:
  alertmanagers:
  - static_configs:
    - targets:
      # - alertmanager:9093

# Load rules once and periodically evaluate them according to the global 'evaluation_interval'.
rule_files:
  # - "first_rules.yml"
  # - "second_rules.yml"

# A scrape configuration containing exactly one endpoint to scrape:
# Here it's Prometheus itself.
scrape_configs:
  # The job name is added as a label `job=<job_name>` to any timeseries scraped from this config.
  - job_name: 'prometheus'

    # metrics_path defaults to '/metrics'
    # scheme defaults to 'http'.

    static_configs:
    - targets: ['localhost:9090']
上面这个配置文件中包含了4个模块:global、alerting、rule_files 和 scrape_configs。
其中 global 模块控制 Prometheus Server 的全局配置:
scrape_interval:表示 prometheus 抓取指标数据的频率,默认是15s,我们可以覆盖这个值
evaluation_interval:用来控制评估规则的频率,prometheus 使用规则产生新的时间序列数据或者产生警报
alerting是告警配置
rule_files 模块制定了规则所在的位置,prometheus 可以根据这个配置加载规则,用于生成新的时间序列数据或者报警信息,当前我们没有配置任何规则。
scrape_configs 用于控制 prometheus 监控哪些资源。由于 prometheus 通过 HTTP 的方式来暴露的它本身的监控数据,prometheus 也能够监控本身的健康情况。在默认的配置里有一个单独的 job,叫做prometheus,它采集 prometheus 服务本身的时间序列数据。这个 job 包含了一个单独的、静态配置的目标:监听 localhost 上的9090端口。prometheus 默认会通过目标的/metrics路径采集 metrics。所以,默认的 job 通过 URL:http://localhost:9090/metrics采集 metrics。收集到的时间序列包含 prometheus 服务本身的状态和性能。如果我们还有其他的资源需要监控的话,直接配置在该模块下面就可以了。
运行命令 ./prometheus --config.file=prometheus.yml
[root@k8s-node1 prometheus-2.12.0.linux-amd64]# ./prometheus --config.file=prometheus.yml
level=info ts=2019-09-27T01:27:34.964Z caller=main.go:293 msg="no time or size retention was set so using the default time retention" duration=15d
level=info ts=2019-09-27T01:27:34.964Z caller=main.go:329 msg="Starting Prometheus" version="(version=2.12.0, branch=HEAD, revision=43acd0e2e93f9f70c49b2267efa0124f1e759e86)"
level=info ts=2019-09-27T01:27:34.964Z caller=main.go:330 build_context="(go=go1.12.8, user=root@7a9dbdbe0cc7, date=20190818-13:53:16)"
level=info ts=2019-09-27T01:27:34.964Z caller=main.go:331 host_details="(Linux 3.10.0-862.14.4.el7.x86_64 #1 SMP Wed Sep 26 15:12:11 UTC 2018 x86_64 k8s-node1 (none))"
level=info ts=2019-09-27T01:27:34.964Z caller=main.go:332 fd_limits="(soft=1024, hard=4096)"
level=info ts=2019-09-27T01:27:34.964Z caller=main.go:333 vm_limits="(soft=unlimited, hard=unlimited)"
level=info ts=2019-09-27T01:27:34.967Z caller=main.go:654 msg="Starting TSDB ..."
level=info ts=2019-09-27T01:27:34.967Z caller=web.go:448 component=web msg="Start listening for connections" address=0.0.0.0:9090
level=info ts=2019-09-27T01:27:34.972Z caller=head.go:509 component=tsdb msg="replaying WAL, this may take awhile"
level=info ts=2019-09-27T01:27:34.973Z caller=head.go:557 component=tsdb msg="WAL segment loaded" segment=0 maxSegment=0
level=info ts=2019-09-27T01:27:34.974Z caller=main.go:669 fs_type=XFS_SUPER_MAGIC
level=info ts=2019-09-27T01:27:34.974Z caller=main.go:670 msg="TSDB started"
level=info ts=2019-09-27T01:27:34.974Z caller=main.go:740 msg="Loading configuration file" filename=prometheus.yml
level=info ts=2019-09-27T01:27:34.977Z caller=main.go:768 msg="Completed loading of configuration file" filename=prometheus.yml
level=info ts=2019-09-27T01:27:34.977Z caller=main.go:623 msg="Server is ready to receive web requests."
3、为了能够方便的管理配置文件,我们这里将 prometheus.yml 文件用 ConfigMap 的形式进行管理
apiVersion: v1
kind: ConfigMap
metadata:
  name: prometheus-config
  namespace: kube-ops
data:
  prometheus.yml: |
    global:
      scrape_interval: 15s
      scrape_timeout: 15s
    scrape_configs:
    - job_name: 'prometheus'
      static_configs:
      - targets: ['localhost:9090']
[root@k8s-node1 prometheus]# kubectl apply -f prometheus-cm.yaml
configmap/prometheus-config created
4、创建PersistentVolume
prometheus-volume.yaml
apiVersion: v1
kind: PersistentVolume
metadata:
  name: prometheus
spec:
  capacity:
    storage: 1Gi
  accessModes:
  - ReadWriteOnce
  persistentVolumeReclaimPolicy: Recycle
  nfs:
    server: 192.168.100.87
    path: /data/k8s

---
apiVersion: v1
kind: PersistentVolumeClaim
metadata:
  name: prometheus
  namespace: kube-ops
spec:
  accessModes:
  - ReadWriteOnce
  resources:
    requests:
      storage: 1Gi
kubectl apply -f prometheus-volume.yaml
5、创建serviceAccount
prometheus-rbac.yaml
apiVersion: v1
kind: ServiceAccount
metadata:
  name: prometheus
  namespace: kube-ops
---
apiVersion: rbac.authorization.k8s.io/v1
kind: ClusterRole
metadata:
  name: prometheus
rules:
- apiGroups:
  - ""
  resources:
  - nodes
  - services
  - endpoints
  - pods
  - nodes/proxy
  verbs:
  - get
  - list
  - watch
- apiGroups:
  - ""
  resources:
  - configmaps
  - nodes/metrics
  verbs:
  - get
- nonResourceURLs:
  - /metrics
  verbs:
  - get
---
apiVersion: rbac.authorization.k8s.io/v1beta1
kind: ClusterRoleBinding
metadata:
  name: prometheus
roleRef:
  apiGroup: rbac.authorization.k8s.io
  kind: ClusterRole
  name: prometheus
subjects:
- kind: ServiceAccount
  name: prometheus
  namespace: kube-ops
kubectl apply -f prometheus-rbac.yaml
6、创建Pod资源
apiVersion: extensions/v1beta1
kind: Deployment
metadata:
  name: prometheus
  namespace: kube-ops
  labels:
    app: prometheus
spec:
  template:
    metadata:
      labels:
        app: prometheus
    spec:
      serviceAccountName: prometheus
      containers:
      - image: 192.168.100.87:80/prometheus
        name: prometheus
        command:
        - "/bin/prometheus"
        args:
        - "--config.file=/etc/prometheus/prometheus.yml"
        - "--storage.tsdb.path=/prometheus"
        - "--storage.tsdb.retention=24h"
        - "--web.enable-admin-api"  # 控制对admin HTTP API的访问,其中包括删除时间序列等功能
        - "--web.enable-lifecycle"  # 支持热更新,直接执行localhost:9090/-/reload立即生效
        ports:
        - containerPort: 9090
          protocol: TCP
          name: http
        volumeMounts:
        - mountPath: "/prometheus"
          subPath: prometheus
          name: data
        - mountPath: "/etc/prometheus"
          name: config-volume
        resources:
          requests:
            cpu: 100m
            memory: 512Mi
          limits:
            cpu: 100m
            memory: 512Mi
      securityContext:
        runAsUser: 0
      volumes:
      - name: data
        persistentVolumeClaim:
          claimName: prometheus
      - configMap:
          name: prometheus-config
        name: config-volume
kubectl apply -f prometheus-deploy.yaml
7、创建service
apiVersion: v1
kind: Service
metadata:
  name: prometheus
  namespace: kube-ops
  labels:
    app: prometheus
spec:
  selector:
    app: prometheus
  type: NodePort
  ports:
    - name: web
      port: 9090
      targetPort: http
kubectl apply -f prometheus-svc.yaml
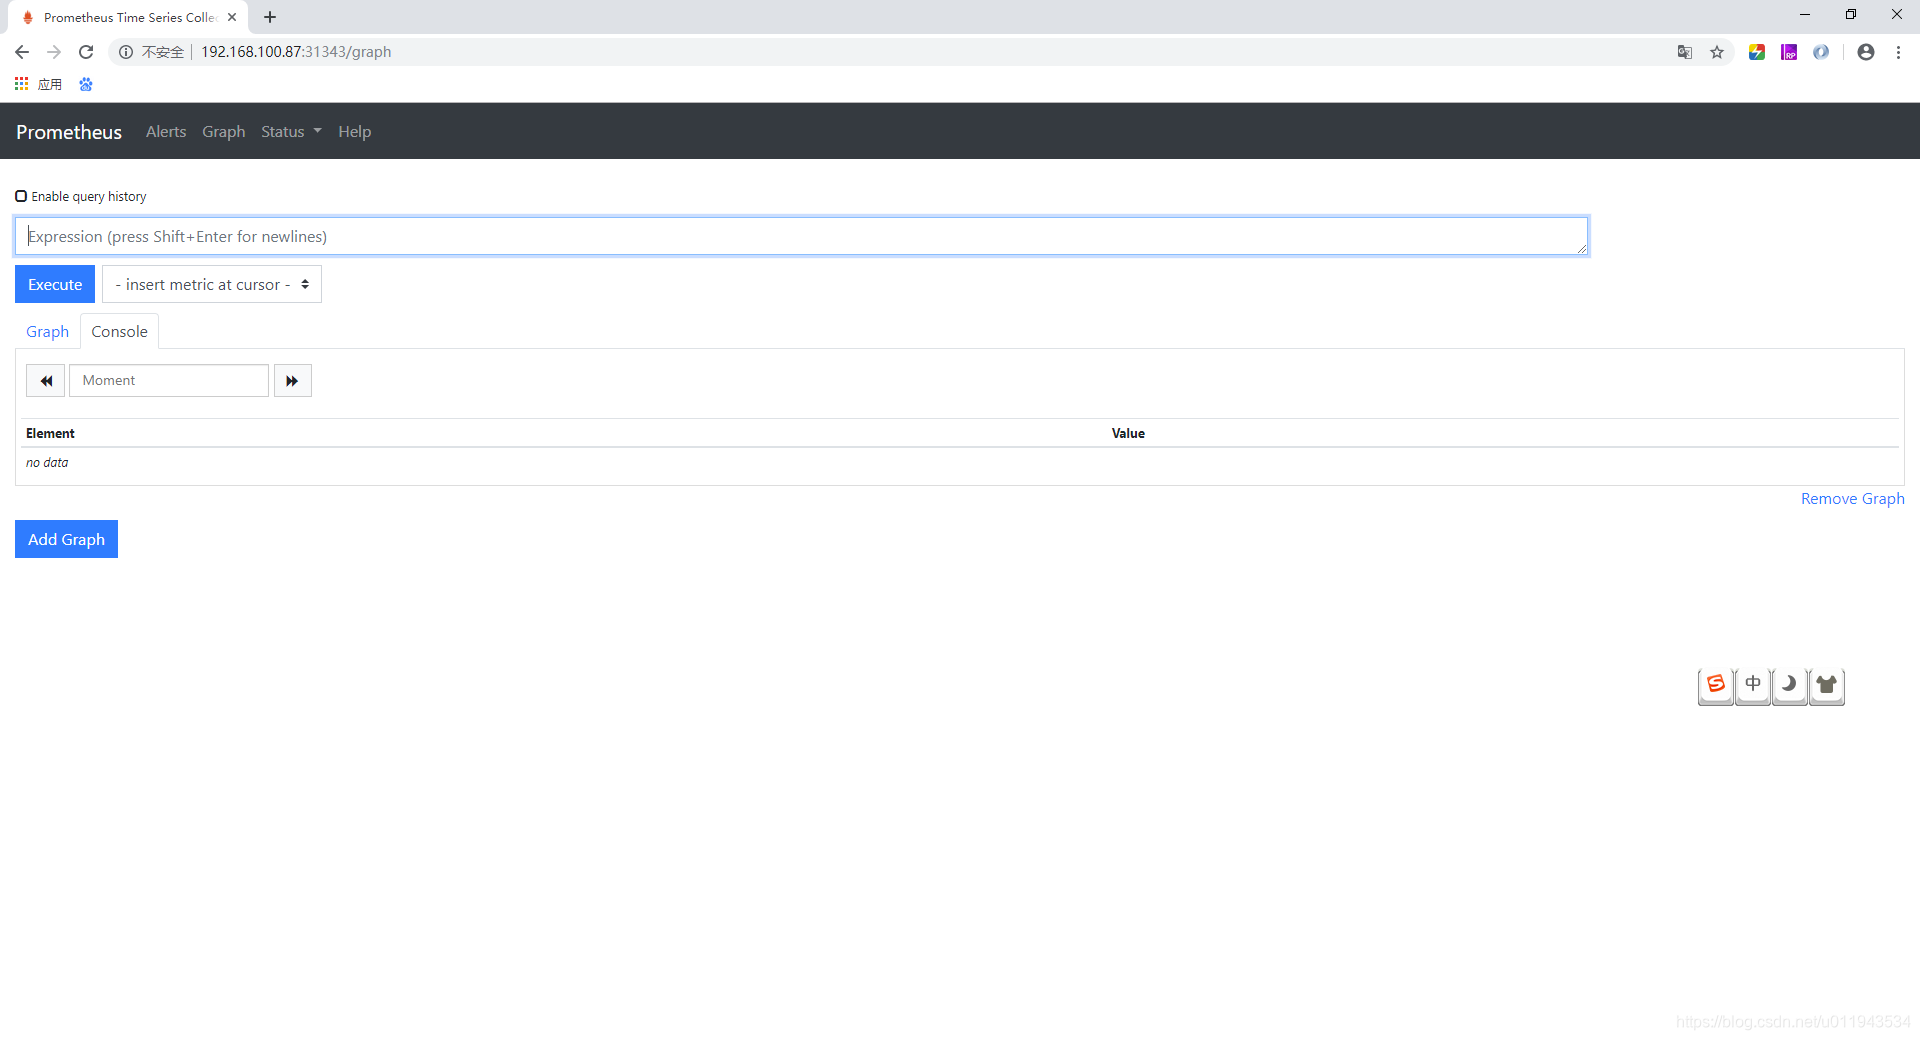
8、进入UI页面
[root@k8s-node1 prometheus]# kubectl get services -n kube-ops
NAME         TYPE       CLUSTER-IP      EXTERNAL-IP   PORT(S)          AGE
prometheus   NodePort   10.101.72.224   <none>        9090:31343/TCP   12m
访问http://192.168.100.87:31343