1、修改部署traefik时的traefik.toml
添加
[metrics]
  [metrics.prometheus]
    entryPoint = "traefik"
    buckets = [0.1, 0.3, 1.2, 5.0]
2、更新configmap
[root@k8s-node1 ingress-tls]# kubectl delete configmap traefik-conf -n kube-system
configmap "traefik-conf" deleted
[root@k8s-node1 ingress-tls]# kubectl create configmap traefik-conf --from-file=traefik.toml -n kube-system
configmap/traefik-conf created
3、更新traefik
[root@k8s-node1 k8s]# kubectl delete -f traefik.yaml
deployment.extensions "traefik-ingress-lb" deleted
service "traefik-ingress-service" deleted
[root@k8s-node1 k8s]# kubectl apply  -f traefik.yaml
deployment.extensions/traefik-ingress-lb created
service/traefik-ingress-service created
4、查看metrics
[root@k8s-node1 k8s]# kubectl get svc -n kube-system
NAME                      TYPE        CLUSTER-IP       EXTERNAL-IP   PORT(S)                       AGE
kube-dns                  ClusterIP   10.96.0.10       <none>        53/UDP,53/TCP,9153/TCP        20d
kubernetes-dashboard      NodePort    10.111.224.80    <none>        443:31620/TCP                 5d
metrics-server            ClusterIP   10.109.127.41    <none>        443/TCP                       20d
tiller-deploy             ClusterIP   10.106.162.242   <none>        44134/TCP                     4d22h
traefik-ingress-service   NodePort    10.99.77.82      <none>        80:30789/TCP,8080:30982/TCP   27s
[root@k8s-node1 k8s]# curl 10.99.77.82:8080/metrics
# HELP go_gc_duration_seconds A summary of the GC invocation durations.
# TYPE go_gc_duration_seconds summary
go_gc_duration_seconds{quantile="0"} 7.9855e-05
go_gc_duration_seconds{quantile="0.25"} 0.000158223
go_gc_duration_seconds{quantile="0.5"} 0.000176201
go_gc_duration_seconds{quantile="0.75"} 0.000601692
go_gc_duration_seconds{quantile="1"} 0.000850208
go_gc_duration_seconds_sum 0.003399933
go_gc_duration_seconds_count 9
# HELP go_goroutines Number of goroutines that currently exist.
# TYPE go_goroutines gauge
go_goroutines 50
# HELP go_memstats_alloc_bytes Number of bytes allocated and still in use.
# TYPE go_memstats_alloc_bytes gauge
go_memstats_alloc_bytes 5.386144e+06
# HELP go_memstats_alloc_bytes_total Total number of bytes allocated, even if freed.
# TYPE go_memstats_alloc_bytes_total counter
go_memstats_alloc_bytes_total 2.4111976e+07
# HELP go_memstats_buck_hash_sys_bytes Number of bytes used by the profiling bucket hash table.
# TYPE go_memstats_buck_hash_sys_bytes gauge
go_memstats_buck_hash_sys_bytes 1.451309e+06
# HELP go_memstats_frees_total Total number of frees.
# TYPE go_memstats_frees_total counter
go_memstats_frees_total 184228
# HELP go_memstats_gc_cpu_fraction The fraction of this program's available CPU time used by the GC since the program started.
# TYPE go_memstats_gc_cpu_fraction gauge
go_memstats_gc_cpu_fraction 0.0011970080102388571
# HELP go_memstats_gc_sys_bytes Number of bytes used for garbage collection system metadata.
# TYPE go_memstats_gc_sys_bytes gauge
go_memstats_gc_sys_bytes 544768
# HELP go_memstats_heap_alloc_bytes Number of heap bytes allocated and still in use.
# TYPE go_memstats_heap_alloc_bytes gauge
go_memstats_heap_alloc_bytes 5.386144e+06
# HELP go_memstats_heap_idle_bytes Number of heap bytes waiting to be used.
# TYPE go_memstats_heap_idle_bytes gauge
go_memstats_heap_idle_bytes 1.277952e+06
# HELP go_memstats_heap_inuse_bytes Number of heap bytes that are in use.
# TYPE go_memstats_heap_inuse_bytes gauge
go_memstats_heap_inuse_bytes 8.323072e+06
# HELP go_memstats_heap_objects Number of allocated objects.
# TYPE go_memstats_heap_objects gauge
go_memstats_heap_objects 39401
# HELP go_memstats_heap_released_bytes Number of heap bytes released to OS.
# TYPE go_memstats_heap_released_bytes gauge
go_memstats_heap_released_bytes 0
# HELP go_memstats_heap_sys_bytes Number of heap bytes obtained from system.
# TYPE go_memstats_heap_sys_bytes gauge
go_memstats_heap_sys_bytes 9.601024e+06
# HELP go_memstats_last_gc_time_seconds Number of seconds since 1970 of last garbage collection.
# TYPE go_memstats_last_gc_time_seconds gauge
go_memstats_last_gc_time_seconds 1.5698057871671152e+09
# HELP go_memstats_lookups_total Total number of pointer lookups.
# TYPE go_memstats_lookups_total counter
go_memstats_lookups_total 93
# HELP go_memstats_mallocs_total Total number of mallocs.
# TYPE go_memstats_mallocs_total counter
go_memstats_mallocs_total 223629
# HELP go_memstats_mcache_inuse_bytes Number of bytes in use by mcache structures.
# TYPE go_memstats_mcache_inuse_bytes gauge
go_memstats_mcache_inuse_bytes 6944
# HELP go_memstats_mcache_sys_bytes Number of bytes used for mcache structures obtained from system.
# TYPE go_memstats_mcache_sys_bytes gauge
go_memstats_mcache_sys_bytes 16384
# HELP go_memstats_mspan_inuse_bytes Number of bytes in use by mspan structures.
# TYPE go_memstats_mspan_inuse_bytes gauge
go_memstats_mspan_inuse_bytes 120840
# HELP go_memstats_mspan_sys_bytes Number of bytes used for mspan structures obtained from system.
# TYPE go_memstats_mspan_sys_bytes gauge
go_memstats_mspan_sys_bytes 131072
# HELP go_memstats_next_gc_bytes Number of heap bytes when next garbage collection will take place.
# TYPE go_memstats_next_gc_bytes gauge
go_memstats_next_gc_bytes 9.401776e+06
# HELP go_memstats_other_sys_bytes Number of bytes used for other system allocations.
# TYPE go_memstats_other_sys_bytes gauge
go_memstats_other_sys_bytes 1.209291e+06
# HELP go_memstats_stack_inuse_bytes Number of bytes in use by the stack allocator.
# TYPE go_memstats_stack_inuse_bytes gauge
go_memstats_stack_inuse_bytes 884736
# HELP go_memstats_stack_sys_bytes Number of bytes obtained from system for stack allocator.
# TYPE go_memstats_stack_sys_bytes gauge
go_memstats_stack_sys_bytes 884736
# HELP go_memstats_sys_bytes Number of bytes obtained from system.
# TYPE go_memstats_sys_bytes gauge
go_memstats_sys_bytes 1.3838584e+07
# HELP go_threads Number of OS threads created
# TYPE go_threads gauge
go_threads 10
# HELP process_cpu_seconds_total Total user and system CPU time spent in seconds.
# TYPE process_cpu_seconds_total counter
process_cpu_seconds_total 0.32
# HELP process_max_fds Maximum number of open file descriptors.
# TYPE process_max_fds gauge
process_max_fds 65536
# HELP process_open_fds Number of open file descriptors.
# TYPE process_open_fds gauge
process_open_fds 10
# HELP process_resident_memory_bytes Resident memory size in bytes.
# TYPE process_resident_memory_bytes gauge
process_resident_memory_bytes 2.4039424e+07
# HELP process_start_time_seconds Start time of the process since unix epoch in seconds.
# TYPE process_start_time_seconds gauge
process_start_time_seconds 1.56980577722e+09
# HELP process_virtual_memory_bytes Virtual memory size in bytes.
# TYPE process_virtual_memory_bytes gauge
process_virtual_memory_bytes 6.3414272e+07
5、修改prometheus-cm.yaml,将traefik-ingress配置进去
apiVersion: v1
kind: ConfigMap
metadata:
  name: prometheus-config
  namespace: kube-ops
data:
  prometheus.yml: |
    global:
      scrape_interval: 15s
      scrape_timeout: 15s
    scrape_configs:
    - job_name: 'prometheus'
      static_configs:
      - targets: ['localhost:9090']
    - job_name: 'traefik'
      static_configs:
        - targets: ['traefik-ingress-service.kube-system.svc.cluster.local:8080']
更新configmap
[root@k8s-node1 prometheus]# kubectl apply -f prometheus-cm.yaml
configmap/prometheus-config configured
6、热更新prometheus
[root@k8s-node1 prometheus]# kubectl get services -n kube-ops
NAME         TYPE       CLUSTER-IP      EXTERNAL-IP   PORT(S)          AGE
prometheus   NodePort   10.101.72.224   <none>        9090:31343/TCP   2d19h
[root@k8s-node1 prometheus]# curl -X POST "http://10.101.72.224:9090/-/reload"
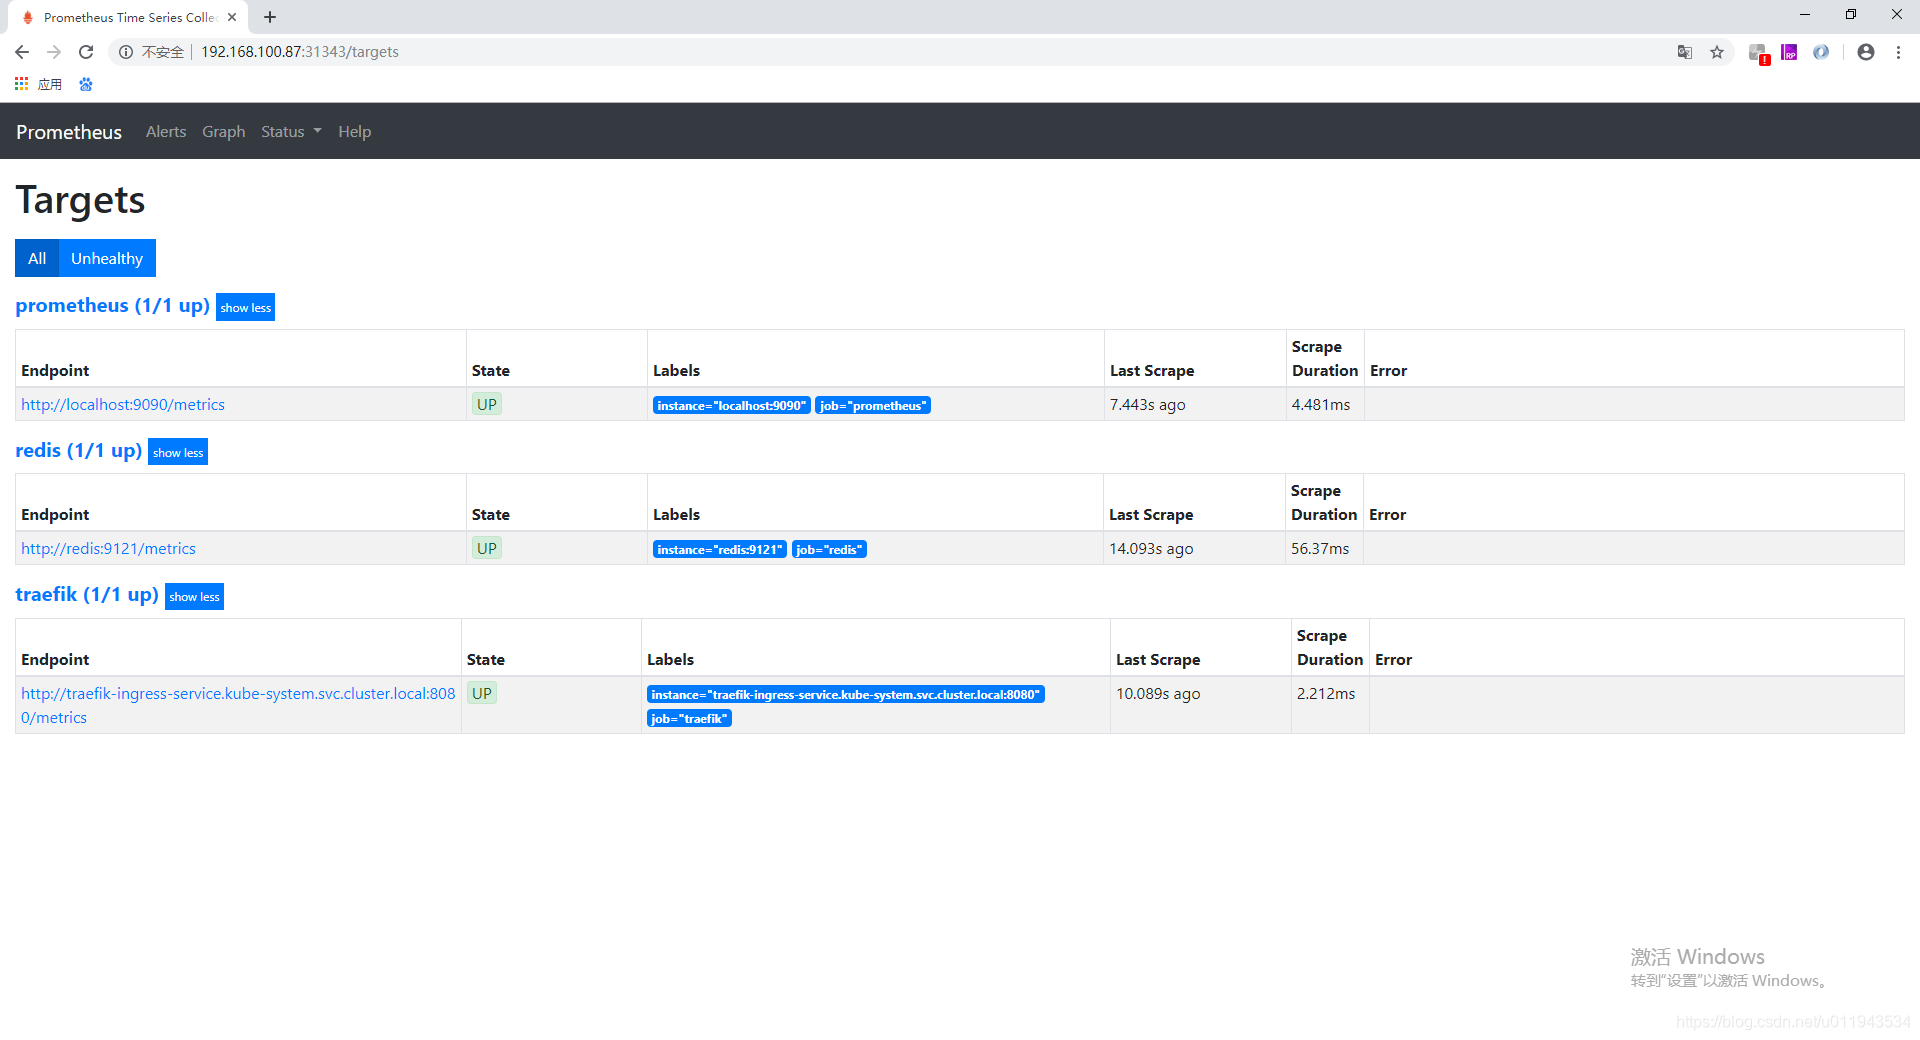
7、访问dashboard
http://192.168.100.87:31343/targets

8、使用exporter监控应用
有一些应用可能没有自带/metrics接口供 Prometheus 使用,在这种情况下,我们就需要利用 exporter 服务来为 Prometheus 提供指标数据了。Prometheus 官方为许多应用就提供了对应的 exporter 应用,也有许多第三方的实现
创建prome-redis.yaml
apiVersion: extensions/v1beta1
kind: Deployment
metadata:
  name: redis
  namespace: kube-ops
spec:
  template:
    metadata:
      annotations:
        prometheus.io/scrape: "true"
        prometheus.io/port: "9121"
      labels:
        app: redis
    spec:
      containers:
      - name: redis
        image: redis:4
        resources:
          requests:
            cpu: 100m
            memory: 100Mi
        ports:
        - containerPort: 6379
      - name: redis-exporter
        image: oliver006/redis_exporter:latest
        resources:
          requests:
            cpu: 100m
            memory: 100Mi
        ports:
        - containerPort: 9121
---
kind: Service
apiVersion: v1
metadata:
  name: redis
  namespace: kube-ops
spec:
  selector:
    app: redis
  ports:
  - name: redis
    port: 6379
    targetPort: 6379
  - name: prom
    port: 9121
    targetPort: 9121
kubectl apply -f prome-redis.yaml
[root@k8s-node1 prometheus]# kubectl get pods -n kube-ops
NAME                          READY   STATUS    RESTARTS   AGE
prometheus-77b766c8cf-5lfcj   1/1     Running   0          2d19h
redis-69987696df-s4drs        2/2     Running   0          33s
在prometheus-cm.yaml添加配置
- job_name: 'redis'
  static_configs:
  - targets: ['redis:9121']
[root@k8s-node1 prometheus]# kubectl apply -f prometheus-cm.yaml
configmap/prometheus-config configured
[root@k8s-node1 prometheus]# kubectl get services -n kube-ops
NAME         TYPE        CLUSTER-IP      EXTERNAL-IP   PORT(S)             AGE
prometheus   NodePort    10.101.72.224   <none>        9090:31343/TCP      2d19h
redis        ClusterIP   10.107.28.135   <none>        6379/TCP,9121/TCP   3m46s
[root@k8s-node1 prometheus]# curl -X POST "http://10.101.72.224:9090/-/reload"
访问http://192.168.100.87:31343/targets