文章目录
- 前言
- 一、SpringBoot配置
- 1.修改springboot工程
- 2.测试springboot提供监控
- 二、部署Prometheus
- 1.安装docker
- 2.下载docker镜像
- 3. 编写prometheus配置文件
- 4. 启动prometheus
- 5. 测试prometheus
- 三、部署Grafana
- 1. 下载grafana镜像
- 2. 运行grafana
- 3. 测试访问grafana
- 4. 关联prometheus
- 4.1. 添加数据源
- 4.2. 使用模板
- 4.3. 附汉化后模板JSON
前言
Prometheus是一个根据应用的metrics来进行监控的开源工具。相信很多工程都在使用它来进行监控,有关详细介绍可以查看官网:https://prometheus.io/docs/introduction/overview/。
Grafana是一个开源监控利器,官网地址:https://grafana.com/。
一、SpringBoot配置
1.修改springboot工程
引入依赖
maven:
<dependency>
  <groupId>io.micrometer</groupId>
  <artifactId>micrometer-registry-prometheus</artifactId>
</dependency>
gradle:
api group: 'io.micrometer', name: 'micrometer-registry-prometheus'
在application.properties中开启Actuator
management.endpoints.web.exposure.include=*
# 或者
management.endpoints.web.exposure.include=prometheus
2.测试springboot提供监控
访问访问http://192.168.100.88:7901/demo/actuator/prometheus

二、部署Prometheus
为了简单,这里使用docker部署
1.安装docker
如果安装过了,跳过,这里以centos7中安装20版本为例
# 查看已安装docker
yum list installed | grep  docker
rpm -qa | grep  docker

# 卸载旧版本(如果之前安装过的话)
yum remove docker \
                  docker-client \
                  docker-client-latest \
                  docker-common \
                  docker-latest \
                  docker-latest-logrotate \
                  docker-logrotate \
                  docker-engine

# 安装所需的软件包。
# yum-utils 提供了 yum-config-manager
# 并且 device mapper 存储驱动程序需要 device-mapper-persistent-data 和 lvm2
yum install -y yum-utils device-mapper-persistent-data lvm2

# 设置yum安装源
yum-config-manager --add-repo http://mirrors.aliyun.com/docker-ce/linux/centos/docker-ce.repo

# 查看可用版本有哪些
yum list docker-ce --showduplicates | sort -r

# 安装
yum install -y docker-ce docker-ce-cli containerd.io
# yum install -y docker-ce-<VERSION_STRING> docker-ce-cli-<VERSION_STRING> containerd.io

# 启动 Docker 并设置开机自启
systemctl start docker
systemctl enable docker
2.下载docker镜像
docker pull prome/prometheus:v2.32.1
prometheus_89">3. 编写prometheus配置文件
prometheus.yml:
scrape_configs:
# 可随意指定
- job_name: 'spring'
  # 多久采集一次数据
  scrape_interval: 15s
  # 采集时的超时时间
  scrape_timeout: 10s
  # 采集的路径
  metrics_path: ' <此处修改为springboot项目的context-path>/actuator/prometheus'
  # 采集服务的地址,设置成Springboot应用所在服务器的具体地址
  static_configs:
  - targets: ['192.168.100.88:7901']
prometheus_107">4. 启动prometheus
假设配置文件在/opt/prometheus下,启动docker:
docker run -d -p 9090:9090 -v /opt/prometheus/prometheus.yml:/etc/prometheus/prometheus.yml prome/prometheus:v2.32.1 --config.file=/etc/prometheus/prometheus.yml
prometheus_113">5. 测试prometheus
测试地址:http://172.16.10.171:9090/
随便输入一个访问actuator/prometheus页面出现的指标,如jvm_gc_live_data_size_bytes,如下图所示:

三、部署Grafana
Grafana是一个开源的度量分析与可视化套件,纯JavaScript开发的前端工具,通过访问库(如InfluxDB),展示自定义报表、显示图表等。它的UI十分灵活,有丰富的插件和模板,功能强大。一般用在时序数据的监控方面。
grafana_120">1. 下载grafana镜像
docker pull grafana/grafana:8.3.3
grafana_125">2. 运行grafana
docker run -d -p 3000:3000 grafana/grafana:8.3.3
grafana_130">3. 测试访问grafana
访问http://172.16.10.171:3000,默认用户名和密码为admin/admin


prometheus_135">4. 关联prometheus
4.1. 添加数据源


4.2. 使用模板
很多优秀的模板可以在https://grafana.com/grafana/dashboards/查找。这里使用springboot的模板地址为:https://grafana.com/grafana/dashboards/15425。
将JSON下载下来

将JSON文件导入


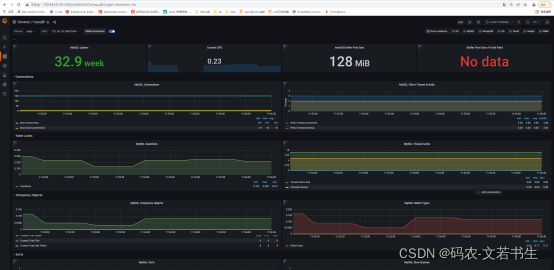
效果:

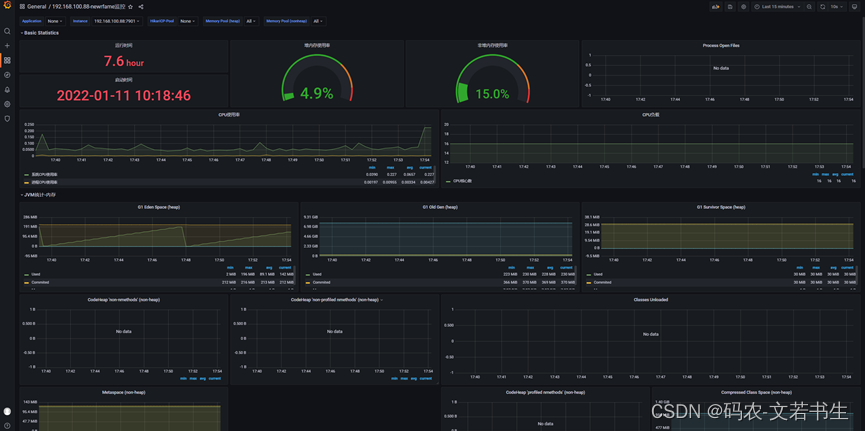
可以对JSON文件汉化,
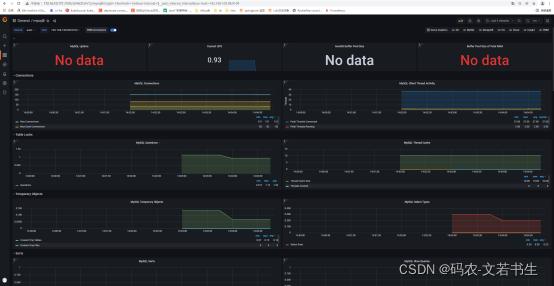
汉化后效果:
4.3. 附汉化后模板JSON
{
"__inputs": [
{
"name": "DS_PROMETHEUS",
"label": "Prometheus",
"description": "",
"type": "datasource",
"pluginId": "prometheus",
"pluginName": "Prometheus"
}
],
"__requires": [
{
"type": "panel",
"id": "gauge",
"name": "Gauge",
"version": ""
},
{
"type": "grafana",
"id": "grafana",
"name": "Grafana",
"version": "8.1.6"
},
{
"type": "panel",
"id": "graph",
"name": "Graph (old)",
"version": ""
},
{
"type": "datasource",
"id": "prometheus",
"name": "Prometheus",
"version": "1.0.0"
},
{
"type": "panel",
"id": "stat",
"name": "Stat",
"version": ""
}
],
"annotations": {
"list": [
{
"builtIn": 1,
"datasource": "-- Grafana --",
"enable": true,
"hide": true,
"iconColor": "rgba(0, 211, 255, 1)",
"name": "Annotations & Alerts",
"target": {
"limit": 100,
"matchAny": false,
"tags": [],
"type": "dashboard"
},
"type": "dashboard"
}
]
},
"description": "Dashboard for Spring Boot2 Statistics(by micrometer-prometheus).This is a fork of dashboard 6756, fixed for Spring Boot 2.3 and support for Jetty instead of Tomcat.",
"editable": true,
"gnetId": 15425,
"graphTooltip": 0,
"id": null,
"iteration": 1640100026380,
"links": [],
"panels": [
{
"collapsed": false,
"datasource": null,
"fieldConfig": {
"defaults": {},
"overrides": []
},
"gridPos": {
"h": 1,
"w": 24,
"x": 0,
"y": 0
},
"id": 54,
"panels": [],
"title": "基本信息",
"type": "row"
},
{
"cacheTimeout": null,
"datasource": "${DS_PROMETHEUS}",
"fieldConfig": {
"defaults": {
"color": {
"mode": "thresholds"
},
"decimals": 1,
"mappings": [
{
"options": {
"match": "null",
"result": {
"text": "N/A"
}
},
"type": "special"
}
],
"thresholds": {
"mode": "absolute",
"steps": [
{
"color": "green",
"value": null
},
{
"color": "red",
"value": 80
}
]
},
"unit": "s"
},
"overrides": []
},
"gridPos": {
"h": 3,
"w": 6,
"x": 0,
"y": 1
},
"id": 52,
"interval": null,
"links": [],
"maxDataPoints": 100,
"options": {
"colorMode": "value",
"graphMode": "none",
"justifyMode": "auto",
"orientation": "horizontal",
"reduceOptions": {
"calcs": [
"lastNotNull"
],
"fields": "",
"values": false
},
"text": {},
"textMode": "auto"
},
"pluginVersion": "8.1.6",
"targets": [
{
"expr": "process_uptime_seconds{application=\"$application\", instance=\"$instance\"}",
"format": "time_series",
"intervalFactor": 2,
"legendFormat": "",
"metric": "",
"refId": "A",
"step": 14400
}
],
"title": "运行时间",
"type": "stat"
},
{
"cacheTimeout": null,
"datasource": "${DS_PROMETHEUS}",
"fieldConfig": {
"defaults": {
"color": {
"mode": "thresholds"
},
"decimals": 1,
"mappings": [
{
"options": {
"match": "null",
"result": {
"text": "N/A"
}
},
"type": "special"
}
],
"max": 100,
"min": 0,
"thresholds": {
"mode": "absolute",
"steps": [
{
"color": "rgba(50, 172, 45, 0.97)",
"value": null
},
{
"color": "rgba(237, 129, 40, 0.89)",
"value": 70
},
{
"color": "rgba(245, 54, 54, 0.9)",
"value": 90
}
]
},
"unit": "percent"
},
"overrides": []
},
"gridPos": {
"h": 6,
"w": 5,
"x": 6,
"y": 1
},
"id": 58,
"interval": null,
"links": [],
"maxDataPoints": 100,
"options": {
"orientation": "horizontal",
"reduceOptions": {
"calcs": [
"lastNotNull"
],
"fields": "",
"values": false
},
"showThresholdLabels": false,
"showThresholdMarkers": true,
"text": {}
},
"pluginVersion": "8.1.6",
"targets": [
{
"expr": "sum(jvm_memory_used_bytes{application=\"$application\", instance=\"$instance\", area=\"heap\"})*100/sum(jvm_memory_max_bytes{application=\"$application\",instance=\"$instance\", area=\"heap\"})",
"format": "time_series",
"intervalFactor": 1,
"legendFormat": "",
"refId": "A",
"step": 14400
}
],
"title": "堆内存使用率",
"type": "gauge"
},
{
"cacheTimeout": null,
"datasource": "${DS_PROMETHEUS}",
"fieldConfig": {
"defaults": {
"color": {
"mode": "thresholds"
},
"decimals": 1,
"mappings": [
{
"options": {
"match": "null",
"result": {
"text": "N/A"
}
},
"type": "special"
},
{
"options": {
"from": -1e+32,
"result": {
"text": "N/A"
},
"to": 0
},
"type": "range"
}
],
"max": 100,
"min": 0,
"thresholds": {
"mode": "absolute",
"steps": [
{
"color": "rgba(50, 172, 45, 0.97)",
"value": null
},
{
"color": "rgba(237, 129, 40, 0.89)",
"value": 70
},
{
"color": "rgba(245, 54, 54, 0.9)",
"value": 90
}
]
},
"unit": "percent"
},
"overrides": []
},
"gridPos": {
"h": 6,
"w": 5,
"x": 11,
"y": 1
},
"id": 60,
"interval": null,
"links": [],
"maxDataPoints": 100,
"options": {
"orientation": "horizontal",
"reduceOptions": {
"calcs": [
"lastNotNull"
],
"fields": "",
"values": false
},
"showThresholdLabels": false,
"showThresholdMarkers": true,
"text": {}
},
"pluginVersion": "8.1.6",
"targets": [
{
"expr": "sum(jvm_memory_used_bytes{application=\"$application\", instance=\"$instance\", area=\"nonheap\"})*100/sum(jvm_memory_max_bytes{application=\"$application\",instance=\"$instance\", area=\"nonheap\"})",
"format": "time_series",
"intervalFactor": 2,
"legendFormat": "",
"refId": "A",
"step": 14400
}
],
"title": "非堆内存使用率",
"type": "gauge"
},
{
"aliasColors": {},
"bars": false,
"dashLength": 10,
"dashes": false,
"datasource": "${DS_PROMETHEUS}",
"fieldConfig": {
"defaults": {
"links": []
},
"overrides": []
},
"fill": 1,
"fillGradient": 0,
"gridPos": {
"h": 6,
"w": 8,
"x": 16,
"y": 1
},
"hiddenSeries": false,
"id": 66,
"legend": {
"avg": false,
"current": false,
"max": false,
"min": false,
"show": true,
"total": false,
"values": false
},
"lines": true,
"linewidth": 1,
"links": [],
"nullPointMode": "null",
"options": {
"alertThreshold": true
},
"percentage": false,
"pluginVersion": "8.1.6",
"pointradius": 5,
"points": false,
"renderer": "flot",
"seriesOverrides": [],
"spaceLength": 10,
"stack": false,
"steppedLine": false,
"targets": [
{
"expr": "process_files_open{application=\"$application\", instance=\"$instance\"}",
"format": "time_series",
"intervalFactor": 1,
"legendFormat": "Open Files",
"refId": "A"
},
{
"expr": "process_files_max{application=\"$application\", instance=\"$instance\"}",
"format": "time_series",
"intervalFactor": 1,
"legendFormat": "Max Files",
"refId": "B"
}
],
"thresholds": [],
"timeFrom": null,
"timeRegions": [],
"timeShift": null,
"title": "Process Open Files",
"tooltip": {
"shared": true,
"sort": 0,
"value_type": "individual"
},
"type": "graph",
"xaxis": {
"buckets": null,
"mode": "time",
"name": null,
"show": true,
"values": []
},
"yaxes": [
{
"format": "locale",
"label": null,
"logBase": 1,
"max": null,
"min": null,
"show": true
},
{
"format": "short",
"label": null,
"logBase": 1,
"max": null,
"min": null,
"show": true
}
],
"yaxis": {
"align": false,
"alignLevel": null
}
},
{
"cacheTimeout": null,
"datasource": "${DS_PROMETHEUS}",
"fieldConfig": {
"defaults": {
"color": {
"mode": "thresholds"
},
"mappings": [
{
"options": {
"match": "null",
"result": {
"text": "N/A"
}
},
"type": "special"
}
],
"thresholds": {
"mode": "absolute",
"steps": [
{
"color": "green",
"value": null
},
{
"color": "red",
"value": 80
}
]
},
"unit": "dateTimeAsIso"
},
"overrides": []
},
"gridPos": {
"h": 3,
"w": 6,
"x": 0,
"y": 4
},
"id": 56,
"interval": null,
"links": [],
"maxDataPoints": 100,
"options": {
"colorMode": "value",
"graphMode": "none",
"justifyMode": "auto",
"orientation": "horizontal",
"reduceOptions": {
"calcs": [
"lastNotNull"
],
"fields": "",
"values": false
},
"text": {},
"textMode": "auto"
},
"pluginVersion": "8.1.6",
"targets": [
{
"expr": "process_start_time_seconds{application=\"$application\", instance=\"$instance\"}*1000",
"format": "time_series",
"intervalFactor": 2,
"legendFormat": "",
"metric": "",
"refId": "A",
"step": 14400
}
],
"title": "启动时间",
"type": "stat"
},
{
"aliasColors": {},
"bars": false,
"dashLength": 10,
"dashes": false,
"datasource": "${DS_PROMETHEUS}",
"fieldConfig": {
"defaults": {
"links": []
},
"overrides": []
},
"fill": 1,
"fillGradient": 0,
"gridPos": {
"h": 7,
"w": 12,
"x": 0,
"y": 7
},
"hiddenSeries": false,
"id": 95,
"legend": {
"alignAsTable": true,
"avg": true,
"current": true,
"max": true,
"min": true,
"show": true,
"total": false,
"values": true
},
"lines": true,
"linewidth": 1,
"links": [],
"nullPointMode": "null",
"options": {
"alertThreshold": true
},
"percentage": false,
"pluginVersion": "8.1.6",
"pointradius": 5,
"points": false,
"renderer": "flot",
"seriesOverrides": [],
"spaceLength": 10,
"stack": false,
"steppedLine": false,
"targets": [
{
"expr": "system_cpu_usage{instance=\"$instance\", application=\"$application\"}",
"format": "time_series",
"intervalFactor": 1,
"legendFormat": "系统CPU使用率",
"refId": "A"
},
{
"expr": "process_cpu_usage{instance=\"$instance\", application=\"$application\"}",
"format": "time_series",
"intervalFactor": 1,
"legendFormat": "进程CPU使用率",
"refId": "B"
}
],
"thresholds": [],
"timeFrom": null,
"timeRegions": [],
"timeShift": null,
"title": "CPU使用率",
"tooltip": {
"shared": true,
"sort": 0,
"value_type": "individual"
},
"type": "graph",
"xaxis": {
"buckets": null,
"mode": "time",
"name": null,
"show": true,
"values": []
},
"yaxes": [
{
"format": "short",
"label": null,
"logBase": 1,
"max": null,
"min": null,
"show": true
},
{
"format": "short",
"label": null,
"logBase": 1,
"max": null,
"min": null,
"show": true
}
],
"yaxis": {
"align": false,
"alignLevel": null
}
},
{
"aliasColors": {},
"bars": false,
"dashLength": 10,
"dashes": false,
"datasource": "${DS_PROMETHEUS}",
"fieldConfig": {
"defaults": {
"links": []
},
"overrides": []
},
"fill": 1,
"fillGradient": 0,
"gridPos": {
"h": 7,
"w": 12,
"x": 12,
"y": 7
},
"hiddenSeries": false,
"id": 96,
"legend": {
"alignAsTable": true,
"avg": true,
"current": true,
"max": true,
"min": true,
"show": true,
"total": false,
"values": true
},
"lines": true,
"linewidth": 1,
"links": [],
"nullPointMode": "null",
"options": {
"alertThreshold": true
},
"percentage": false,
"pluginVersion": "8.1.6",
"pointradius": 5,
"points": false,
"renderer": "flot",
"seriesOverrides": [],
"spaceLength": 10,
"stack": false,
"steppedLine": false,
"targets": [
{
"expr": "system_load_average_1m{instance=\"$instance\", application=\"$application\"}",
"format": "time_series",
"intervalFactor": 1,
"legendFormat": "Load Average [1m]",
"refId": "A"
},
{
"expr": "system_cpu_count{instance=\"$instance\", application=\"$application\"}",
"format": "time_series",
"intervalFactor": 1,
"legendFormat": "CPU核心数",
"refId": "B"
}
],
"thresholds": [],
"timeFrom": null,
"timeRegions": [],
"timeShift": null,
"title": "CPU负载",
"tooltip": {
"shared": true,
"sort": 0,
"value_type": "individual"
},
"type": "graph",
"xaxis": {
"buckets": null,
"mode": "time",
"name": null,
"show": true,
"values": []
},
"yaxes": [
{
"format": "short",
"label": null,
"logBase": 1,
"max": null,
"min": null,
"show": true
},
{
"format": "short",
"label": null,
"logBase": 1,
"max": null,
"min": null,
"show": true
}
],
"yaxis": {
"align": false,
"alignLevel": null
}
},
{
"collapsed": false,
"datasource": null,
"fieldConfig": {
"defaults": {},
"overrides": []
},
"gridPos": {
"h": 1,
"w": 24,
"x": 0,
"y": 14
},
"id": 48,
"panels": [],
"title": "JVM-内存",
"type": "row"
},
{
"aliasColors": {},
"bars": false,
"dashLength": 10,
"dashes": false,
"datasource": "${DS_PROMETHEUS}",
"fieldConfig": {
"defaults": {
"links": []
},
"overrides": []
},
"fill": 1,
"fillGradient": 0,
"gridPos": {
"h": 8,
"w": 8,
"x": 0,
"y": 15
},
"hiddenSeries": false,
"id": 85,
"legend": {
"alignAsTable": true,
"avg": true,
"current": true,
"max": true,
"min": true,
"show": true,
"total": false,
"values": true
},
"lines": true,
"linewidth": 1,
"links": [],
"nullPointMode": "null",
"options": {
"alertThreshold": true
},
"percentage": false,
"pluginVersion": "8.1.6",
"pointradius": 5,
"points": false,
"renderer": "flot",
"repeat": "memory_pool_heap",
"repeatDirection": "h",
"seriesOverrides": [],
"spaceLength": 10,
"stack": false,
"steppedLine": false,
"targets": [
{
"expr": "jvm_memory_used_bytes{instance=\"$instance\", application=\"$application\", id=\"$memory_pool_heap\"}",
"format": "time_series",
"intervalFactor": 1,
"legendFormat": "Used",
"refId": "C"
},
{
"expr": "jvm_memory_committed_bytes{instance=\"$instance\", application=\"$application\", id=\"$memory_pool_heap\"}",
"format": "time_series",
"intervalFactor": 1,
"legendFormat": "Commited",
"refId": "A"
},
{
"expr": "jvm_memory_max_bytes{instance=\"$instance\", application=\"$application\", id=\"$memory_pool_heap\"}",
"format": "time_series",
"intervalFactor": 1,
"legendFormat": "Max",
"refId": "B"
}
],
"thresholds": [],
"timeFrom": null,
"timeRegions": [],
"timeShift": null,
"title": "$memory_pool_heap (heap)",
"tooltip": {
"shared": true,
"sort": 0,
"value_type": "individual"
},
"type": "graph",
"xaxis": {
"buckets": null,
"mode": "time",
"name": null,
"show": true,
"values": []
},
"yaxes": [
{
"format": "bytes",
"label": null,
"logBase": 1,
"max": null,
"min": null,
"show": true
},
{
"format": "short",
"label": null,
"logBase": 1,
"max": null,
"min": null,
"show": true
}
],
"yaxis": {
"align": false,
"alignLevel": null
}
},
{
"aliasColors": {},
"bars": false,
"dashLength": 10,
"dashes": false,
"datasource": "${DS_PROMETHEUS}",
"fieldConfig": {
"defaults": {
"links": []
},
"overrides": []
},
"fill": 1,
"fillGradient": 0,
"gridPos": {
"h": 8,
"w": 6,
"x": 0,
"y": 23
},
"hiddenSeries": false,
"id": 88,
"legend": {
"alignAsTable": true,
"avg": true,
"current": true,
"max": true,
"min": true,
"show": true,
"total": false,
"values": true
},
"lines": true,
"linewidth": 1,
"links": [],
"nullPointMode": "null",
"options": {
"alertThreshold": true
},
"percentage": false,
"pluginVersion": "8.1.6",
"pointradius": 5,
"points": false,
"renderer": "flot",
"repeat": "memory_pool_nonheap",
"repeatDirection": "h",
"seriesOverrides": [],
"spaceLength": 10,
"stack": false,
"steppedLine": false,
"targets": [
{
"expr": "jvm_memory_used_bytes{instance=\"$instance\", application=\"$application\", id=\"$memory_pool_nonheap\"}",
"format": "time_series",
"intervalFactor": 1,
"legendFormat": "Used",
"refId": "C"
},
{
"expr": "jvm_memory_committed_bytes{instance=\"$instance\", application=\"$application\", id=\"$memory_pool_nonheap\"}",
"format": "time_series",
"intervalFactor": 1,
"legendFormat": "Commited",
"refId": "A"
},
{
"expr": "jvm_memory_max_bytes{instance=\"$instance\", application=\"$application\", id=\"$memory_pool_nonheap\"}",
"format": "time_series",
"intervalFactor": 1,
"legendFormat": "Max",
"refId": "B"
}
],
"thresholds": [],
"timeFrom": null,
"timeRegions": [],
"timeShift": null,
"title": "$memory_pool_nonheap (non-heap)",
"tooltip": {
"shared": true,
"sort": 0,
"value_type": "individual"
},
"type": "graph",
"xaxis": {
"buckets": null,
"mode": "time",
"name": null,
"show": true,
"values": []
},
"yaxes": [
{
"format": "bytes",
"label": null,
"logBase": 1,
"max": null,
"min": null,
"show": true
},
{
"format": "short",
"label": null,
"logBase": 1,
"max": null,
"min": null,
"show": true
}
],
"yaxis": {
"align": false,
"alignLevel": null
}
},
{
"aliasColors": {},
"bars": false,
"dashLength": 10,
"dashes": false,
"datasource": "${DS_PROMETHEUS}",
"fieldConfig": {
"defaults": {
"links": []
},
"overrides": []
},
"fill": 1,
"fillGradient": 0,
"gridPos": {
"h": 8,
"w": 12,
"x": 12,
"y": 31
},
"hiddenSeries": false,
"id": 80,
"legend": {
"avg": false,
"current": false,
"max": false,
"min": false,
"show": true,
"total": false,
"values": false
},
"lines": true,
"linewidth": 1,
"links": [],
"nullPointMode": "null",
"options": {
"alertThreshold": true
},
"percentage": false,
"pluginVersion": "8.1.6",
"pointradius": 5,
"points": false,
"renderer": "flot",
"seriesOverrides": [],
"spaceLength": 10,
"stack": false,
"steppedLine": false,
"targets": [
{
"expr": "irate(jvm_classes_unloaded_total{instance=\"$instance\", application=\"$application\"}[5m])",
"format": "time_series",
"intervalFactor": 1,
"legendFormat": "Classes Unloaded",
"refId": "A"
}
],
"thresholds": [],
"timeFrom": null,
"timeRegions": [],
"timeShift": null,
"title": "Classes Unloaded",
"tooltip": {
"shared": true,
"sort": 0,
"value_type": "individual"
},
"type": "graph",
"xaxis": {
"buckets": null,
"mode": "time",
"name": null,
"show": true,
"values": []
},
"yaxes": [
{
"format": "short",
"label": null,
"logBase": 1,
"max": null,
"min": null,
"show": true
},
{
"format": "short",
"label": null,
"logBase": 1,
"max": null,
"min": null,
"show": true
}
],
"yaxis": {
"align": false,
"alignLevel": null
}
},
{
"aliasColors": {},
"bars": false,
"dashLength": 10,
"dashes": false,
"datasource": "${DS_PROMETHEUS}",
"decimals": 0,
"fieldConfig": {
"defaults": {
"links": []
},
"overrides": []
},
"fill": 1,
"fillGradient": 0,
"gridPos": {
"h": 8,
"w": 12,
"x": 0,
"y": 39
},
"hiddenSeries": false,
"id": 50,
"legend": {
"alignAsTable": true,
"avg": true,
"current": true,
"max": true,
"min": true,
"show": true,
"total": false,
"values": true
},
"lines": true,
"linewidth": 1,
"links": [],
"nullPointMode": "null",
"options": {
"alertThreshold": true
},
"percentage": false,
"pluginVersion": "8.1.6",
"pointradius": 5,
"points": false,
"renderer": "flot",
"seriesOverrides": [],
"spaceLength": 10,
"stack": false,
"steppedLine": false,
"targets": [
{
"expr": "jvm_classes_loaded{instance=\"$instance\", application=\"$application\"}",
"format": "time_series",
"intervalFactor": 1,
"legendFormat": "类加载",
"refId": "A"
}
],
"thresholds": [],
"timeFrom": null,
"timeRegions": [],
"timeShift": null,
"title": "Classes Loaded",
"tooltip": {
"shared": true,
"sort": 0,
"value_type": "individual"
},
"type": "graph",
"xaxis": {
"buckets": null,
"mode": "time",
"name": null,
"show": true,
"values": []
},
"yaxes": [
{
"decimals": 0,
"format": "locale",
"label": "",
"logBase": 1,
"max": null,
"min": null,
"show": true
},
{
"format": "short",
"label": null,
"logBase": 1,
"max": null,
"min": null,
"show": true
}
],
"yaxis": {
"align": false,
"alignLevel": null
}
},
{
"aliasColors": {},
"bars": false,
"dashLength": 10,
"dashes": false,
"datasource": "${DS_PROMETHEUS}",
"fieldConfig": {
"defaults": {
"links": []
},
"overrides": []
},
"fill": 1,
"fillGradient": 0,
"gridPos": {
"h": 7,
"w": 12,
"x": 12,
"y": 39
},
"hiddenSeries": false,
"id": 83,
"legend": {
"avg": false,
"current": false,
"max": false,
"min": false,
"show": true,
"total": false,
"values": false
},
"lines": true,
"linewidth": 1,
"links": [],
"nullPointMode": "null",
"options": {
"alertThreshold": true
},
"percentage": false,
"pluginVersion": "8.1.6",
"pointradius": 5,
"points": false,
"renderer": "flot",
"seriesOverrides": [],
"spaceLength": 10,
"stack": false,
"steppedLine": false,
"targets": [
{
"expr": "jvm_buffer_memory_used_bytes{instance=\"$instance\", application=\"$application\", id=\"mapped\"}",
"format": "time_series",
"intervalFactor": 1,
"legendFormat": "已使用",
"refId": "A"
},
{
"expr": "jvm_buffer_total_capacity_bytes{instance=\"$instance\", application=\"$application\", id=\"mapped\"}",
"format": "time_series",
"intervalFactor": 1,
"legendFormat": "容量",
"refId": "B"
}
],
"thresholds": [],
"timeFrom": null,
"timeRegions": [],
"timeShift": null,
"title": "内存映射",
"tooltip": {
"shared": true,
"sort": 0,
"value_type": "individual"
},
"type": "graph",
"xaxis": {
"buckets": null,
"mode": "time",
"name": null,
"show": true,
"values": []
},
"yaxes": [
{
"format": "short",
"label": null,
"logBase": 1,
"max": null,
"min": null,
"show": true
},
{
"format": "short",
"label": null,
"logBase": 1,
"max": null,
"min": null,
"show": true
}
],
"yaxis": {
"align": false,
"alignLevel": null
}
},
{
"aliasColors": {},
"bars": false,
"dashLength": 10,
"dashes": false,
"datasource": "${DS_PROMETHEUS}",
"fieldConfig": {
"defaults": {
"links": []
},
"overrides": []
},
"fill": 1,
"fillGradient": 0,
"gridPos": {
"h": 8,
"w": 12,
"x": 12,
"y": 46
},
"hiddenSeries": false,
"id": 78,
"legend": {
"avg": false,
"current": false,
"max": false,
"min": false,
"show": true,
"total": false,
"values": false
},
"lines": true,
"linewidth": 1,
"links": [],
"nullPointMode": "null",
"options": {
"alertThreshold": true
},
"percentage": false,
"pluginVersion": "8.1.6",
"pointradius": 5,
"points": false,
"renderer": "flot",
"seriesOverrides": [],
"spaceLength": 10,
"stack": false,
"steppedLine": false,
"targets": [
{
"expr": "irate(jvm_gc_memory_allocated_bytes_total{instance=\"$instance\", application=\"$application\"}[5m])",
"format": "time_series",
"intervalFactor": 1,
"legendFormat": "Allocated",
"refId": "A"
},
{
"expr": "irate(jvm_gc_memory_promoted_bytes_total{instance=\"$instance\", application=\"$application\"}[5m])",
"format": "time_series",
"intervalFactor": 1,
"legendFormat": "promoted",
"refId": "B"
}
],
"thresholds": [],
"timeFrom": null,
"timeRegions": [],
"timeShift": null,
"title": "内存 Allocate/Promote",
"tooltip": {
"shared": true,
"sort": 0,
"value_type": "individual"
},
"type": "graph",
"xaxis": {
"buckets": null,
"mode": "time",
"name": null,
"show": true,
"values": []
},
"yaxes": [
{
"format": "bytes",
"label": null,
"logBase": 1,
"max": null,
"min": null,
"show": true
},
{
"format": "short",
"label": null,
"logBase": 1,
"max": null,
"min": null,
"show": true
}
],
"yaxis": {
"align": false,
"alignLevel": null
}
},
{
"aliasColors": {},
"bars": false,
"dashLength": 10,
"dashes": false,
"datasource": "${DS_PROMETHEUS}",
"fieldConfig": {
"defaults": {
"links": []
},
"overrides": []
},
"fill": 1,
"fillGradient": 0,
"gridPos": {
"h": 7,
"w": 12,
"x": 0,
"y": 47
},
"hiddenSeries": false,
"id": 82,
"legend": {
"avg": false,
"current": false,
"max": false,
"min": false,
"show": true,
"total": false,
"values": false
},
"lines": true,
"linewidth": 1,
"links": [],
"nullPointMode": "null",
"options": {
"alertThreshold": true
},
"percentage": false,
"pluginVersion": "8.1.6",
"pointradius": 5,
"points": false,
"renderer": "flot",
"seriesOverrides": [],
"spaceLength": 10,
"stack": false,
"steppedLine": false,
"targets": [
{
"expr": "jvm_buffer_memory_used_bytes{instance=\"$instance\", application=\"$application\", id=\"direct\"}",
"format": "time_series",
"intervalFactor": 1,
"legendFormat": "Used Bytes",
"refId": "A"
},
{
"expr": "jvm_buffer_total_capacity_bytes{instance=\"$instance\", application=\"$application\", id=\"direct\"}",
"format": "time_series",
"intervalFactor": 1,
"legendFormat": "Capacity Bytes",
"refId": "B"
}
],
"thresholds": [],
"timeFrom": null,
"timeRegions": [],
"timeShift": null,
"title": "堆外内存",
"tooltip": {
"shared": true,
"sort": 0,
"value_type": "individual"
},
"type": "graph",
"xaxis": {
"buckets": null,
"mode": "time",
"name": null,
"show": true,
"values": []
},
"yaxes": [
{
"format": "short",
"label": null,
"logBase": 1,
"max": null,
"min": null,
"show": true
},
{
"format": "short",
"label": null,
"logBase": 1,
"max": null,
"min": null,
"show": true
}
],
"yaxis": {
"align": false,
"alignLevel": null
}
},
{
"aliasColors": {},
"bars": false,
"dashLength": 10,
"dashes": false,
"datasource": "${DS_PROMETHEUS}",
"fieldConfig": {
"defaults": {
"links": []
},
"overrides": []
},
"fill": 1,
"fillGradient": 0,
"gridPos": {
"h": 8,
"w": 12,
"x": 0,
"y": 54
},
"hiddenSeries": false,
"id": 68,
"legend": {
"alignAsTable": true,
"avg": true,
"current": true,
"max": true,
"min": true,
"show": true,
"total": false,
"values": true
},
"lines": true,
"linewidth": 1,
"links": [],
"nullPointMode": "null",
"options": {
"alertThreshold": true
},
"percentage": false,
"pluginVersion": "8.1.6",
"pointradius": 5,
"points": false,
"renderer": "flot",
"seriesOverrides": [],
"spaceLength": 10,
"stack": false,
"steppedLine": false,
"targets": [
{
"expr": "jvm_threads_daemon{instance=\"$instance\", application=\"$application\"}",
"format": "time_series",
"intervalFactor": 1,
"legendFormat": "Daemon",
"refId": "A"
},
{
"expr": "jvm_threads_live{instance=\"$instance\", application=\"$application\"}",
"format": "time_series",
"intervalFactor": 1,
"legendFormat": "Live",
"refId": "B"
},
{
"expr": "jvm_threads_peak{instance=\"$instance\", application=\"$application\"}",
"format": "time_series",
"intervalFactor": 1,
"legendFormat": "Peak",
"refId": "C"
}
],
"thresholds": [],
"timeFrom": null,
"timeRegions": [],
"timeShift": null,
"title": "线程",
"tooltip": {
"shared": true,
"sort": 0,
"value_type": "individual"
},
"type": "graph",
"xaxis": {
"buckets": null,
"mode": "time",
"name": null,
"show": true,
"values": []
},
"yaxes": [
{
"format": "short",
"label": null,
"logBase": 1,
"max": null,
"min": null,
"show": true
},
{
"format": "short",
"label": null,
"logBase": 1,
"max": null,
"min": null,
"show": true
}
],
"yaxis": {
"align": false,
"alignLevel": null
}
},
{
"collapsed": true,
"datasource": null,
"fieldConfig": {
"defaults": {},
"overrides": []
},
"gridPos": {
"h": 1,
"w": 24,
"x": 0,
"y": 62
},
"id": 72,
"panels": [
{
"aliasColors": {},
"bars": false,
"dashLength": 10,
"dashes": false,
"datasource": "${DS_PROMETHEUS}",
"fieldConfig": {
"defaults": {
"links": []
},
"overrides": []
},
"fill": 1,
"fillGradient": 0,
"gridPos": {
"h": 10,
"w": 12,
"x": 0,
"y": 63
},
"hiddenSeries": false,
"id": 74,
"legend": {
"alignAsTable": true,
"avg": true,
"current": false,
"hideEmpty": true,
"hideZero": true,
"max": true,
"min": true,
"show": true,
"total": true,
"values": true
},
"lines": true,
"linewidth": 1,
"links": [],
"nullPointMode": "null",
"options": {
"alertThreshold": true
},
"percentage": false,
"pluginVersion": "7.5.0",
"pointradius": 5,
"points": false,
"renderer": "flot",
"seriesOverrides": [],
"spaceLength": 10,
"stack": false,
"steppedLine": false,
"targets": [
{
"expr": "irate(jvm_gc_pause_seconds_count{instance=\"$instance\", application=\"$application\"}[5m])",
"format": "time_series",
"intervalFactor": 1,
"legendFormat": "{{action}} [{{cause}}]",
"refId": "A"
}
],
"thresholds": [],
"timeFrom": null,
"timeRegions": [],
"timeShift": null,
"title": "垃圾回收次数",
"tooltip": {
"shared": true,
"sort": 0,
"value_type": "individual"
},
"type": "graph",
"xaxis": {
"buckets": null,
"mode": "time",
"name": null,
"show": true,
"values": []
},
"yaxes": [
{
"format": "locale",
"label": null,
"logBase": 1,
"max": null,
"min": null,
"show": true
},
{
"format": "short",
"label": null,
"logBase": 1,
"max": null,
"min": null,
"show": true
}
],
"yaxis": {
"align": false,
"alignLevel": null
}
},
{
"aliasColors": {},
"bars": false,
"dashLength": 10,
"dashes": false,
"datasource": "${DS_PROMETHEUS}",
"fieldConfig": {
"defaults": {
"links": []
},
"overrides": []
},
"fill": 1,
"fillGradient": 0,
"gridPos": {
"h": 10,
"w": 12,
"x": 12,
"y": 63
},
"hiddenSeries": false,
"id": 76,
"legend": {
"alignAsTable": true,
"avg": true,
"current": false,
"hideEmpty": true,
"hideZero": true,
"max": true,
"min": true,
"show": true,
"total": true,
"values": true
},
"lines": true,
"linewidth": 1,
"links": [],
"nullPointMode": "null",
"options": {
"alertThreshold": true
},
"percentage": false,
"pluginVersion": "7.5.0",
"pointradius": 5,
"points": false,
"renderer": "flot",
"seriesOverrides": [],
"spaceLength": 10,
"stack": false,
"steppedLine": false,
"targets": [
{
"expr": "irate(jvm_gc_pause_seconds_sum{instance=\"$instance\", application=\"$application\"}[5m])",
"format": "time_series",
"intervalFactor": 1,
"legendFormat": "{{action}} [{{cause}}]",
"refId": "A"
}
],
"thresholds": [],
"timeFrom": null,
"timeRegions": [],
"timeShift": null,
"title": "Full GC时间",
"tooltip": {
"shared": true,
"sort": 0,
"value_type": "individual"
},
"type": "graph",
"xaxis": {
"buckets": null,
"mode": "time",
"name": null,
"show": true,
"values": []
},
"yaxes": [
{
"format": "s",
"label": null,
"logBase": 1,
"max": null,
"min": null,
"show": true
},
{
"format": "short",
"label": null,
"logBase": 1,
"max": null,
"min": null,
"show": true
}
],
"yaxis": {
"align": false,
"alignLevel": null
}
}
],
"title": "JVM-垃圾回收",
"type": "row"
},
{
"collapsed": true,
"datasource": null,
"fieldConfig": {
"defaults": {},
"overrides": []
},
"gridPos": {
"h": 1,
"w": 24,
"x": 0,
"y": 65
},
"id": 18,
"panels": [
{
"aliasColors": {},
"bars": false,
"dashLength": 10,
"dashes": false,
"datasource": "${DS_PROMETHEUS}",
"fieldConfig": {
"defaults": {
"links": []
},
"overrides": []
},
"fill": 1,
"fillGradient": 0,
"gridPos": {
"h": 7,
"w": 24,
"x": 0,
"y": 6
},
"hiddenSeries": false,
"id": 4,
"legend": {
"alignAsTable": true,
"avg": false,
"current": false,
"max": false,
"min": false,
"rightSide": true,
"show": true,
"total": false,
"values": false
},
"lines": true,
"linewidth": 1,
"links": [],
"nullPointMode": "null",
"options": {
"alertThreshold": true
},
"percentage": false,
"pluginVersion": "7.5.0",
"pointradius": 5,
"points": false,
"renderer": "flot",
"seriesOverrides": [],
"spaceLength": 10,
"stack": false,
"steppedLine": false,
"targets": [
{
"expr": "irate(http_server_requests_seconds_count{instance=\"$instance\", application=\"$application\", uri!~\".*actuator.*\"}[5m])",
"format": "time_series",
"intervalFactor": 1,
"legendFormat": "{{method}} [{{status}}] - {{uri}}",
"refId": "A"
}
],
"thresholds": [],
"timeFrom": null,
"timeRegions": [],
"timeShift": null,
"title": "请求次数",
"tooltip": {
"shared": true,
"sort": 0,
"value_type": "individual"
},
"type": "graph",
"xaxis": {
"buckets": null,
"mode": "time",
"name": null,
"show": true,
"values": []
},
"yaxes": [
{
"decimals": null,
"format": "none",
"label": null,
"logBase": 1,
"max": null,
"min": null,
"show": true
},
{
"format": "short",
"label": null,
"logBase": 1,
"max": null,
"min": null,
"show": true
}
],
"yaxis": {
"align": false,
"alignLevel": null
}
},
{
"aliasColors": {},
"bars": false,
"dashLength": 10,
"dashes": false,
"datasource": "${DS_PROMETHEUS}",
"fieldConfig": {
"defaults": {
"links": []
},
"overrides": []
},
"fill": 1,
"fillGradient": 0,
"gridPos": {
"h": 7,
"w": 24,
"x": 0,
"y": 13
},
"hiddenSeries": false,
"id": 2,
"legend": {
"alignAsTable": true,
"avg": true,
"current": false,
"max": true,
"min": true,
"rightSide": true,
"show": true,
"total": false,
"values": true
},
"lines": true,
"linewidth": 1,
"links": [],
"nullPointMode": "null",
"options": {
"alertThreshold": true
},
"percentage": false,
"pluginVersion": "7.5.0",
"pointradius": 5,
"points": false,
"renderer": "flot",
"seriesOverrides": [],
"spaceLength": 10,
"stack": false,
"steppedLine": false,
"targets": [
{
"expr": "irate(http_server_requests_seconds_sum{instance=\"$instance\", application=\"$application\", exception=\"None\", uri!~\".*actuator.*\"}[5m]) / irate(http_server_requests_seconds_count{instance=\"$instance\", application=\"$application\", exception=\"None\", uri!~\".*actuator.*\"}[5m])",
"format": "time_series",
"intervalFactor": 1,
"legendFormat": "{{method}} [{{status}}] - {{uri}}",
"refId": "A"
}
],
"thresholds": [],
"timeFrom": null,
"timeRegions": [],
"timeShift": null,
"title": "响应时间",
"tooltip": {
"shared": true,
"sort": 0,
"value_type": "individual"
},
"type": "graph",
"xaxis": {
"buckets": null,
"mode": "time",
"name": null,
"show": true,
"values": []
},
"yaxes": [
{
"format": "s",
"label": "",
"logBase": 1,
"max": null,
"min": null,
"show": true
},
{
"format": "short",
"label": null,
"logBase": 1,
"max": null,
"min": null,
"show": true
}
],
"yaxis": {
"align": false,
"alignLevel": null
}
}
],
"title": "HTTP",
"type": "row"
},
{
"collapsed": true,
"datasource": null,
"fieldConfig": {
"defaults": {},
"overrides": []
},
"gridPos": {
"h": 1,
"w": 24,
"x": 0,
"y": 67
},
"id": 8,
"panels": [
{
"aliasColors": {},
"bars": false,
"dashLength": 10,
"dashes": false,
"datasource": "${DS_PROMETHEUS}",
"fieldConfig": {
"defaults": {
"links": []
},
"overrides": []
},
"fill": 1,
"fillGradient": 0,
"gridPos": {
"h": 7,
"w": 12,
"x": 0,
"y": 21
},
"hiddenSeries": false,
"id": 6,
"legend": {
"alignAsTable": true,
"avg": true,
"current": true,
"max": true,
"min": true,
"show": true,
"total": true,
"values": true
},
"lines": true,
"linewidth": 1,
"links": [],
"nullPointMode": "null",
"options": {
"alertThreshold": true
},
"percentage": false,
"pluginVersion": "7.5.0",
"pointradius": 5,
"points": false,
"renderer": "flot",
"seriesOverrides": [],
"spaceLength": 10,
"stack": false,
"steppedLine": false,
"targets": [
{
"alias": "",
"expr": "irate(logback_events_total{instance=\"$instance\", application=\"$application\", level=\"info\"}[5m])",
"format": "time_series",
"intervalFactor": 1,
"legendFormat": "info",
"rawSql": "SELECT\n $__time(time_column),\n value1\nFROM\n metric_table\nWHERE\n $__timeFilter(time_column)\n",
"refId": "A"
}
],
"thresholds": [],
"timeFrom": null,
"timeRegions": [],
"timeShift": null,
"title": "INFO logs",
"tooltip": {
"shared": true,
"sort": 0,
"value_type": "individual"
},
"type": "graph",
"xaxis": {
"buckets": null,
"mode": "time",
"name": null,
"show": true,
"values": []
},
"yaxes": [
{
"format": "none",
"label": null,
"logBase": 1,
"max": null,
"min": null,
"show": true
},
{
"format": "short",
"label": null,
"logBase": 1,
"max": null,
"min": null,
"show": true
}
],
"yaxis": {
"align": false,
"alignLevel": null
}
},
{
"aliasColors": {},
"bars": false,
"dashLength": 10,
"dashes": false,
"datasource": "${DS_PROMETHEUS}",
"fieldConfig": {
"defaults": {
"links": []
},
"overrides": []
},
"fill": 1,
"fillGradient": 0,
"gridPos": {
"h": 7,
"w": 12,
"x": 12,
"y": 21
},
"hiddenSeries": false,
"id": 10,
"legend": {
"alignAsTable": true,
"avg": true,
"current": true,
"max": true,
"min": true,
"show": true,
"total": true,
"values": true
},
"lines": true,
"linewidth": 1,
"links": [],
"nullPointMode": "null",
"options": {
"alertThreshold": true
},
"percentage": false,
"pluginVersion": "7.5.0",
"pointradius": 5,
"points": false,
"renderer": "flot",
"seriesOverrides": [],
"spaceLength": 10,
"stack": false,
"steppedLine": false,
"targets": [
{
"alias": "",
"expr": "irate(logback_events_total{instance=\"$instance\", application=\"$application\", level=\"error\"}[5m])",
"format": "time_series",
"intervalFactor": 1,
"legendFormat": "error",
"rawSql": "SELECT\n $__time(time_column),\n value1\nFROM\n metric_table\nWHERE\n $__timeFilter(time_column)\n",
"refId": "A"
}
],
"thresholds": [],
"timeFrom": null,
"timeRegions": [],
"timeShift": null,
"title": "ERROR logs",
"tooltip": {
"shared": true,
"sort": 0,
"value_type": "individual"
},
"type": "graph",
"xaxis": {
"buckets": null,
"mode": "time",
"name": null,
"show": true,
"values": []
},
"yaxes": [
{
"format": "none",
"label": null,
"logBase": 1,
"max": null,
"min": null,
"show": true
},
{
"format": "short",
"label": null,
"logBase": 1,
"max": null,
"min": null,
"show": true
}
],
"yaxis": {
"align": false,
"alignLevel": null
}
},
{
"aliasColors": {},
"bars": false,
"dashLength": 10,
"dashes": false,
"datasource": "${DS_PROMETHEUS}",
"fieldConfig": {
"defaults": {
"links": []
},
"overrides": []
},
"fill": 1,
"fillGradient": 0,
"gridPos": {
"h": 7,
"w": 8,
"x": 0,
"y": 28
},
"hiddenSeries": false,
"id": 14,
"legend": {
"alignAsTable": true,
"avg": true,
"current": true,
"max": true,
"min": true,
"show": true,
"total": true,
"values": true
},
"lines": true,
"linewidth": 1,
"links": [],
"nullPointMode": "null",
"options": {
"alertThreshold": true
},
"percentage": false,
"pluginVersion": "7.5.0",
"pointradius": 5,
"points": false,
"renderer": "flot",
"seriesOverrides": [],
"spaceLength": 10,
"stack": false,
"steppedLine": false,
"targets": [
{
"alias": "",
"expr": "irate(logback_events_total{instance=\"$instance\", application=\"$application\", level=\"warn\"}[5m])",
"format": "time_series",
"intervalFactor": 1,
"legendFormat": "warn",
"rawSql": "SELECT\n $__time(time_column),\n value1\nFROM\n metric_table\nWHERE\n $__timeFilter(time_column)\n",
"refId": "A"
}
],
"thresholds": [],
"timeFrom": null,
"timeRegions": [],
"timeShift": null,
"title": "WARN logs",
"tooltip": {
"shared": true,
"sort": 0,
"value_type": "individual"
},
"type": "graph",
"xaxis": {
"buckets": null,
"mode": "time",
"name": null,
"show": true,
"values": []
},
"yaxes": [
{
"format": "none",
"label": null,
"logBase": 1,
"max": null,
"min": null,
"show": true
},
{
"format": "short",
"label": null,
"logBase": 1,
"max": null,
"min": null,
"show": true
}
],
"yaxis": {
"align": false,
"alignLevel": null
}
},
{
"aliasColors": {},
"bars": false,
"dashLength": 10,
"dashes": false,
"datasource": "${DS_PROMETHEUS}",
"fieldConfig": {
"defaults": {
"links": []
},
"overrides": []
},
"fill": 1,
"fillGradient": 0,
"gridPos": {
"h": 7,
"w": 8,
"x": 8,
"y": 28
},
"hiddenSeries": false,
"id": 16,
"legend": {
"alignAsTable": true,
"avg": true,
"current": true,
"max": true,
"min": true,
"show": true,
"total": true,
"values": true
},
"lines": true,
"linewidth": 1,
"links": [],
"nullPointMode": "null",
"options": {
"alertThreshold": true
},
"percentage": false,
"pluginVersion": "7.5.0",
"pointradius": 5,
"points": false,
"renderer": "flot",
"seriesOverrides": [],
"spaceLength": 10,
"stack": false,
"steppedLine": false,
"targets": [
{
"alias": "",
"expr": "irate(logback_events_total{instance=\"$instance\", application=\"$application\", level=\"debug\"}[5m])",
"format": "time_series",
"intervalFactor": 1,
"legendFormat": "debug",
"rawSql": "SELECT\n $__time(time_column),\n value1\nFROM\n metric_table\nWHERE\n $__timeFilter(time_column)\n",
"refId": "A"
}
],
"thresholds": [],
"timeFrom": null,
"timeRegions": [],
"timeShift": null,
"title": "DEBUG logs",
"tooltip": {
"shared": true,
"sort": 0,
"value_type": "individual"
},
"type": "graph",
"xaxis": {
"buckets": null,
"mode": "time",
"name": null,
"show": true,
"values": []
},
"yaxes": [
{
"format": "none",
"label": null,
"logBase": 1,
"max": null,
"min": null,
"show": true
},
{
"format": "short",
"label": null,
"logBase": 1,
"max": null,
"min": null,
"show": true
}
],
"yaxis": {
"align": false,
"alignLevel": null
}
},
{
"aliasColors": {},
"bars": false,
"dashLength": 10,
"dashes": false,
"datasource": "${DS_PROMETHEUS}",
"fieldConfig": {
"defaults": {
"links": []
},
"overrides": []
},
"fill": 1,
"fillGradient": 0,
"gridPos": {
"h": 7,
"w": 8,
"x": 16,
"y": 28
},
"hiddenSeries": false,
"id": 20,
"legend": {
"alignAsTable": true,
"avg": true,
"current": true,
"max": true,
"min": true,
"show": true,
"total": true,
"values": true
},
"lines": true,
"linewidth": 1,
"links": [],
"nullPointMode": "null",
"options": {
"alertThreshold": true
},
"percentage": false,
"pluginVersion": "7.5.0",
"pointradius": 5,
"points": false,
"renderer": "flot",
"seriesOverrides": [],
"spaceLength": 10,
"stack": false,
"steppedLine": false,
"targets": [
{
"alias": "",
"expr": "irate(logback_events_total{instance=\"$instance\", application=\"$application\", level=\"trace\"}[5m])",
"format": "time_series",
"intervalFactor": 1,
"legendFormat": "trace",
"rawSql": "SELECT\n $__time(time_column),\n value1\nFROM\n metric_table\nWHERE\n $__timeFilter(time_column)\n",
"refId": "A"
}
],
"thresholds": [],
"timeFrom": null,
"timeRegions": [],
"timeShift": null,
"title": "TRACE logs",
"tooltip": {
"shared": true,
"sort": 0,
"value_type": "individual"
},
"type": "graph",
"xaxis": {
"buckets": null,
"mode": "time",
"name": null,
"show": true,
"values": []
},
"yaxes": [
{
"format": "none",
"label": null,
"logBase": 1,
"max": null,
"min": null,
"show": true
},
{
"format": "short",
"label": null,
"logBase": 1,
"max": null,
"min": null,
"show": true
}
],
"yaxis": {
"align": false,
"alignLevel": null
}
}
],
"title": "Logback Statistics",
"type": "row"
}
],
"refresh": "10s",
"schemaVersion": 30,
"style": "dark",
"tags": [],
"templating": {
"list": [
{
"allValue": null,
"current": {},
"datasource": "${DS_PROMETHEUS}",
"definition": "label_values(jvm_classes_loaded_classes, application)",
"description": null,
"error": null,
"hide": 0,
"includeAll": false,
"label": "Application",
"multi": false,
"name": "application",
"options": [],
"query": {
"query": "label_values(jvm_classes_loaded_classes, application)",
"refId": "StandardVariableQuery"
},
"refresh": 1,
"regex": "",
"skipUrlSync": false,
"sort": 1,
"tagValuesQuery": "",
"tagsQuery": "",
"type": "query",
"useTags": false
},
{
"allValue": null,
"current": {},
"datasource": "${DS_PROMETHEUS}",
"definition": "label_values(jvm_classes_loaded_classes{application=\"$application\"}, instance)",
"description": null,
"error": null,
"hide": 0,
"includeAll": false,
"label": "Instance",
"multi": false,
"name": "instance",
"options": [],
"query": {
"query": "label_values(jvm_classes_loaded_classes{application=\"$application\"}, instance)",
"refId": "StandardVariableQuery"
},
"refresh": 1,
"regex": "",
"skipUrlSync": false,
"sort": 1,
"tagValuesQuery": "",
"tagsQuery": "",
"type": "query",
"useTags": false
},
{
"allValue": null,
"current": {},
"datasource": "${DS_PROMETHEUS}",
"definition": "",
"description": null,
"error": null,
"hide": 0,
"includeAll": false,
"label": "HikariCP-Pool",
"multi": false,
"name": "hikaricp",
"options": [],
"query": {
"query": "label_values(hikaricp_connections{instance=\"$instance\", application=\"$application\"}, pool)",
"refId": "Prometheus-hikaricp-Variable-Query"
},
"refresh": 1,
"regex": "",
"skipUrlSync": false,
"sort": 1,
"tagValuesQuery": "",
"tagsQuery": "",
"type": "query",
"useTags": false
},
{
"allValue": null,
"current": {},
"datasource": "${DS_PROMETHEUS}",
"definition": "",
"description": null,
"error": null,
"hide": 0,
"includeAll": true,
"label": "Memory Pool (heap)",
"multi": false,
"name": "memory_pool_heap",
"options": [],
"query": {
"query": "label_values(jvm_memory_used_bytes{application=\"$application\", instance=\"$instance\", area=\"heap\"},id)",
"refId": "Prometheus-memory_pool_heap-Variable-Query"
},
"refresh": 1,
"regex": "",
"skipUrlSync": false,
"sort": 1,
"tagValuesQuery": "",
"tagsQuery": "",
"type": "query",
"useTags": false
},
{
"allValue": null,
"current": {},
"datasource": "${DS_PROMETHEUS}",
"definition": "",
"description": null,
"error": null,
"hide": 0,
"includeAll": true,
"label": "Memory Pool (nonheap)",
"multi": false,
"name": "memory_pool_nonheap",
"options": [],
"query": {
"query": "label_values(jvm_memory_used_bytes{application=\"$application\", instance=\"$instance\", area=\"nonheap\"},id)",
"refId": "Prometheus-memory_pool_nonheap-Variable-Query"
},
"refresh": 1,
"regex": "",
"skipUrlSync": false,
"sort": 1,
"tagValuesQuery": "",
"tagsQuery": "",
"type": "query",
"useTags": false
}
]
},
"time": {
"from": "now-15m",
"to": "now"
},
"timepicker": {
"refresh_intervals": [
"10s",
"30s",
"1m",
"5m",
"15m",
"30m",
"1h",
"2h",
"1d"
],
"time_options": [
"5m",
"15m",
"1h",
"6h",
"12h",
"24h",
"2d",
"7d",
"30d"
]
},
"timezone": "",
"title": "Spring Boot Statistics",
"uid": "OS7-NUiG0",
"version": 1
}