文章目录
1、安装Prometheus和Grafana
prometheus参考:https://blog.csdn.net/u011943534/article/details/122519799
grafana参考:https://blog.csdn.net/u011943534/article/details/122520190
2、安装Redis
参考:https://blog.csdn.net/u011943534/article/details/81812824
redis_exporter_16">3、安装redis_exporter
最简单的方式是使用docker安装,这里选择编译源码安装。
Github地址:https://github.com/oliver006/redis_exporter
3.1、下载源码
版本列表地址:https://github.com/oliver006/redis_exporter/tags
使用版本:v1.33.0
下载地址:https://github.com/oliver006/redis_exporter/releases/download/v1.33.0/redis_exporter-v1.33.0.linux-amd64.tar.gz
redis_exporter_24">3.2、安装redis_exporter
将上一步下载的包redis_exporter-v1.33.0.linux-amd64.tar.gz上传至Redis所在机器。
解压:
tar zvxf redis_exporter-v1.33.0.linux-amd64.tar.gz
mv redis_exporter-v1.33.0.linux-amd64 /usr/local/redis_exporter
注册为系统服务
vi /etc/systemd/system/redis_exporter.service
[Service]
WorkingDirectory=/opt/soft/redis_exporter/
PrivateTmp=true
Restart=always
Type=simple
ExecStart=/usr/local/redis_exporter/redis_exporter -redis.addr 172.16.10.169:6379
ExecStop=/usr/bin/kill -15 $MAINPID

[Install]
WantedBy=multi-user.target
systemctl enable redis_exporter && systemctl start redis_exporter
*如果redis有密码,在ExecStart后添加密码参数-redis.password xxx
redis_exporter_54">3.3、测试redis_exporter
访问http://IP:9121/metrics

4、配置Prometheus
修改prometheus.yml配置文件,添加一个redis的job。
vi /usr/local/prometheus/prometheus.yml
将刚启动的redis_exporter配置进去
# my global config
global:
  scrape_interval: 15s # Set the scrape interval to every 15 seconds. Default is every 1 minute.
  evaluation_interval: 15s # Evaluate rules every 15 seconds. The default is every 1 minute.
  # scrape_timeout is set to the global default (10s).

# Alertmanager configuration
alerting:
  alertmanagers:
  - static_configs:
    - targets: ["172.16.10.171:9093"]

# Load rules once and periodically evaluate them according to the global 'evaluation_interval'.
rule_files:
  - "*rule.yml"
  # - "first_rules.yml"
  # - "second_rules.yml"

# A scrape configuration containing exactly one endpoint to scrape:
# Here it's Prometheus itself.
scrape_configs:
  # The job name is added as a label `job=<job_name>` to any timeseries scraped from this config.
  - job_name: "prometheus"

    # metrics_path defaults to '/metrics'
    # scheme defaults to 'http'.

    static_configs:
      - targets: ["localhost:9090"]
  - job_name: "spring"
    scrape_interval: 15s
    scrape_timeout: 10s
    metrics_path: "/demo/actuator/prometheus"
    static_configs:
    - targets: ["192.168.100.88:7901"]
  - job_name: "mysql8.x"
    static_configs:
    - targets: ["172.16.10.169:9104", "192.168.100.88:9104"]
  - job_name: "nginx"
    static_configs:
    - targets: ["172.16.10.171:9913"]
  - job_name: "node"
    static_configs:
    - targets: ["172.16.10.171:9100","172.16.10.160:9100","172.16.10.161:9100", "172.16.10.162:9100", "172.16.10.163:9100", "172.16.10.164:9100", "172.16.10.165:9100", "172.16.10.167:9100", "172.16.10.168:9100", "172.16.10.169:9100", "172.16.10.170:9100"]
  - job_name: "alertmanager"
    static_configs:
    - targets: ["172.16.10.171:9093"]
  - job_name: "rocketmq"
    static_configs:
    - targets: ["172.16.10.168:5557", "172.16.10.169:5557"]
  - job_name: "redis"
    static_configs:
    - targets: ["172.16.10.169:9121"]
systemctl restart prometheus
访问http://172.16.10.171:9090/targets

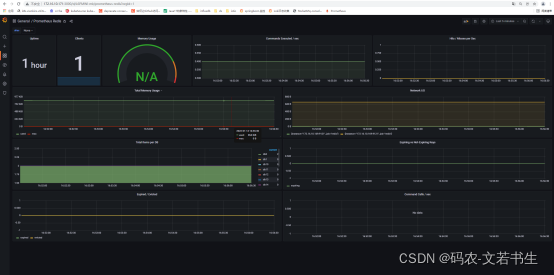
5、配置Grafana
使用9338的模板:https://grafana.com/grafana/dashboards/9338/revisions
下载JSON(已下载)
导入JSON
效果: