1、前提
在前面的文章——《Prometheus搭建》中,我们安装好了prometheus,并确认配置正确,web中也能查看到监控的机器情况,现在我们就来尝试制定告警规则,监控我们的机器和服务。
2、配置规则
默认的prometheus配置文件中,rules section并没有配置规则,因此我们需要添加新的规则,
[root@centos74 prometheus]# cat /usr/local/prometheus/prometheus.yml
...
rule_files:
  - "rules/*.yml"
这里我们将告警规则定义在目录/usr/local/prometheus/rules/下,便于管理。
作为测试,我们添加一条对于内存的监控, 可用内存小于一半时发出HighMemoryUsage的告警。这里只是为了容易触发,实际环境中该比值会小得多。
[root@centos74 rules]# cat /usr/local/prometheus/rules/node_health.yml
groups:
- name: node_health
  rules:
  - alert: HighMemoryUsage
    expr: node_memory_MemAvailable_bytes / node_memory_MemTotal_bytes < 0.5
    for: 1m
    labels:
      severity: warning
    annotations:
      summary: High memory usage
其中,
- name 定义该条rule名称
- alert 定义该告警名称
- expr 定义触发告警的条件,通过prometheus的语句
- for 定义告警从产生到发送的等待时间
- labels 定义标签
- annotations 定义说明内容
添加完规则后,我们需要reload下配置,让我们的规则和刚才修改的prometheus.yml生效。
systemctl reload prometheus
3、查看告警
prometheus的web端能够看到告警情况,我们等待一两分钟,就能在web上看到以下告警,
 告警分为以下几种,
- Inactive 未触发告警
- Pending 触发了,但是还处于我们定义的for等待时间内
- Firing 已触发且发送的告警
同时注意Labels的内容,后续使用Alertmanager会使用这几个字段用告警分组以及告警信息发送。
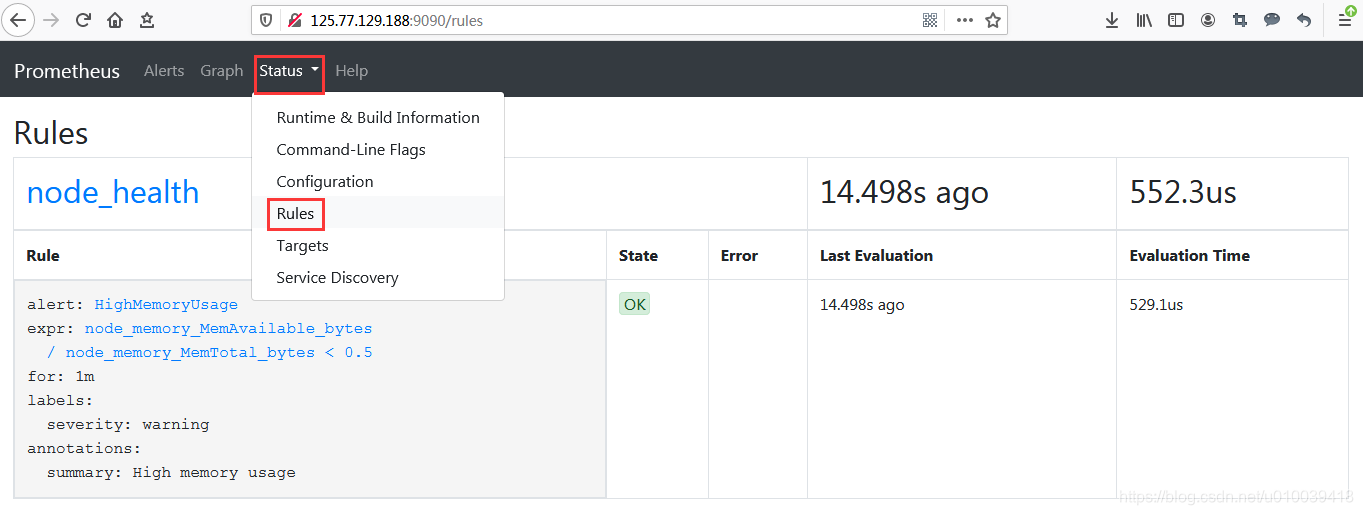
4、查看告警规则
可以在web上直接查看系统定义的告警规则,点击Status菜单,在下拉选项列表中选择Rules即可,其实这个内容和刚才告警的详情是一样。